BTC 4H CHART ROUTE MAPDear Traders,
Please review the BTC 4H chart technical analysis below.
We previously shared our price action analysis, and it remains valid. However, BTC has been moving sideways on the 4H timeframe for nearly three weeks. Recently, price broke the lower trendline, suggesting a potential retest higher—first toward the FVG around 88k, and possibly a further retest at the BPR zone near 91k.
Scenario 1:
If price is rejected from the FVG or BPR levels and the trend line, this would confirm a pullback toward the order block (OB) and demand zone around 83k–84k, clearly marked with a downside arrow.
If this demand zone 83k is broken, price could continue lower toward the next key demand level around 81k and potentially sweep liquidity at 78k.
Scenario 2:
If price successfully breaks above the FVG and BPR levels and trend line, it would confirm a move back into the trendline and zone area, supporting further bullish continuation to collect liquidity around 99k & potentially at 107k zone.
As always, it’s best to buy from dip levels and sell from higher levels. Avoid chasing price at the top, and trade with proper risk management. Our level-based structure typically provides 40–50 pips of reaction, offering solid opportunities for clean entries and exits.
With December 2025 underway and the holiday season approaching, market conditions remain uncertain. There are several red-flag news events on the calendar, so it’s important to keep positions light and tight and avoid choppy market conditions.
Please like, comment, and boost the post.
The Quantum Trading Mastery
Btcmarketcap

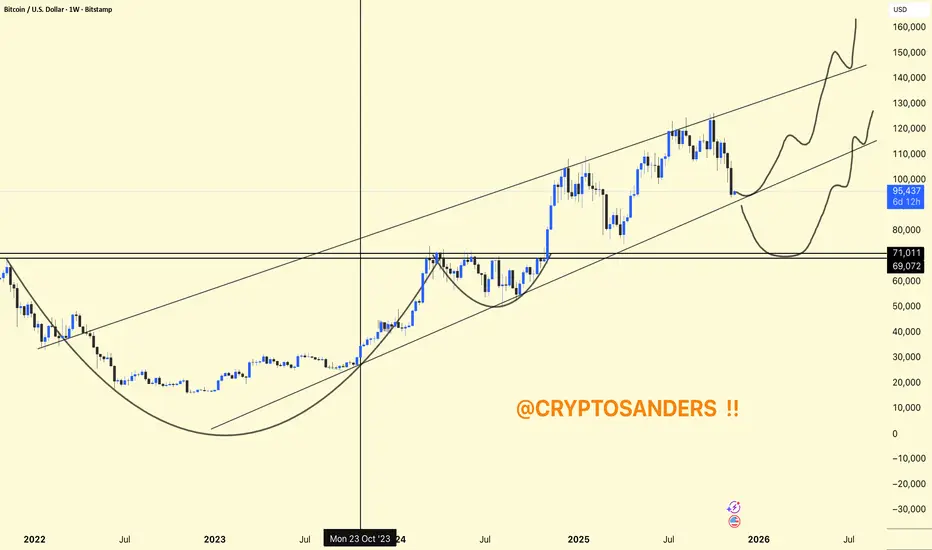
BTCUSDT Weekly Chart Analysis !BTCUSDT Weekly Chart – Full Analysis
Bitcoin is trading within a long-term rising channel, maintaining higher highs and higher lows over multiple years.
Recent Structure: After a powerful uptrend, BTC is currently retesting the midline of the channel as support, which aligns closely with historical breakout levels.
Chart Patterns: Two notable cup-and-handle formations are marked, suggesting strong accumulation phases followed by aggressive rallies. Both patterns played out bullishly with price surges.
Immediate support is in the $90,000–$95,000 region (lower channel line). If lost, deeper support lies around $71,000–$69,000.
BTC holds this channel and midline; the upside path targets $140,000–$160,000 based on the channel ceiling.
A breakdown would likely cause a deeper retrace, with potential demand return at lower horizontal supports.
Short-term volatility is likely, but as long as the major uptrend and channel structure remain intact, BTC is poised for higher targets into 2026.
BTC's weekly chart is still constructive, with a bullish long-term structure, but critical support is being tested. Holding this range could set up for a continuation to new all-time highs, while a breakdown would mean a deeper consolidation first.
DYOR | NFA
Total2 Market Cap vs BTC Market CapToday we are looking at ratio charts. We plot the ratio of Total 2 Market Cap (Total Crypto Market Cap excluding BTC) to BTC Market CAP. This ratio chart is making new lower highs this BTC Halving cycle. There seems to be no bounce from the lows and Alt coin season seems to be elusive. As we move towards the end of the halving cycle there is very little time left for this Alt season. To reach the previous cycle highs of 1.5 in the chart the Alt Coins have to more than double from here and BTC must remain at this price for the rest of the cycle. For this the total Crypto market cap must reach almost 5 trillion USD, which remains unlikely. A better estimate will be the ratio of Total 2 Market Cap vs BTC Market Cap ratio reaches 1.09 which will be 0.618 Fib retracement level. This 0.618 fib retracement repeats in many instances. The same is true for BTC.D. What do you think?

ALT COINs breaking the almost 2 year descending channelI made an interesting comparison between the TOTAL3 (ALT COIN Market Cap, i.e, excluding BTC and ETH) and the BTC Market Cap.
As you can see this ratio just broke the 2 year descending channel with big volumes, projecting a 1:1 capitalization between the two.
Heres are some key notes:
The RSI and MACD bullish divergences also suggest a strong trend reversal.
BTC Market Cap can easily reach 3 trillion dollars , the 2.618 fibonacci extension. This is a reasonable assumption since, in the last run, it reached the 4.236 extension quite fast. If both market caps should match - and my projection gets it's way - that means a 2 trillion dollars increase in the ALT COINs market capitalization (almost 3x)
I've been accumulating on a couple of alts since the end of last year, and I hope now is the time to bring some returns on that.
Stay safe!

btc usdt next tgtbtc usdt next tgt btc all time high brack and next tgt 80k 90k and 100k market bulrun is start 210k usdt

Let Time Be Your GuideCrypto Market Monthly Chart
The Crypto Market Cap can offer great perspective for long term swing trade entry and exits into BTC and ETH, and should be watched closely as this market develops.
There is a clear time pattern which would suggest that you should have your position or at least be DCA'ing now into the reliable market participants BTC and ETH.
You should have a position size that would allow you to withstand volatility down to €17k and not exit the trade, you should have a position you wont exit until mid 2025.
The 10 month moving average is also turning up and moving in the right direction again, as it did during the orange "Get Ready" periods historically, these were good entry periods.
With a recession looking very probable in the next 6 - 18 months (as the yield curve has started to un-invert), it is important to recognize that we might have a March 2020 style correction for the Crypto Market Cap, thus I have overlaid that bull period (Jun 2019 - Nov 2021) onto the chart as a projection of what may be possible. It would not surprise me to see a correction of this magnitude down to approx. €17k, do i expect to happen? NO! but we have to be open to the possibility, especially with the high probability of a recession over coming 6 - 18 month period. Thus it would be wise to position accordingly and potentially have a little powder on the sidelines. Regardless, you should have your core position in place or be getting it in place as there is likely a 29 month period of upwards trajectory incoming and all you truly need is to maintain your emotions and practice patience until mid 2025.
Good luck on your 29 month trading journey, stay focused on time and patience.

THE BULL RUN, MILLIONS WILL MISS.The chart prints are never a mistake, it is for our learning and direction. BTC to 10k is not happening, don't miss this opportunity to buy when millions will be thinking a little retrace is taking BTC to 10k...Be wise the chart is the only chat you need to interact with, not some gurus.

BTC Market Cap - Bearish SentimentBTC's market cap is highly bearish. It touched the 1.3T zone. It is now at 411B. I see that it still has to drop some more to around 60B.

Short Term Bullish Swing TradeHello everyone!
As I mentioned in my previous idea, I'm still bearish.
For now I'm expecting a bounce from this area to 23k-24k.
From there we should see a bearish continuation to 16k.
Btw I will take profit at 22k for this trade.
Good luck to everyone.
And of course thats not a financial advice.

LTC recovering its market share.!The breakout has been confirmed in short term, so the first target is 0.0029BTC and after that the LTC will be looking for 0.0049BTC as medium BINANCE:LTCBTC term target.

Bitcoin Roadmap (Shown with $BTC Market Cap)Putting the evolution of $BTC into the context of the creation of a business or a tech product, it starts to paint an interesting picture. The current market conditions are potentially ones that will enable the first ACTUAL in-real-life (IRL) use of $BTC as it was originally intended to be used. I'm very interested to be able to watch how this will unfold.

BTC Short Term Movement AnalysisAs you can see from the last Bitcoin analysis the 30000 area broke and the price went down with selling pressure and bounced from 25300$. with the price action analysis, Bitcoin is forming a symmetric triangle on lower time frames and we will see a break of this structure soon. The resistance is the $30,500-$31,000 area and we will see a move towards $33,000-$34,000 if BTC breaks above the $31,000 level. A break below $29,000 is bearish and we might see again $27,000-$27,500 levels. Use tight stop loss in all trades.
This analysis will be updated.
5/14/2022

BTC Dominance still consolidating BUT?watch for BTC dominance move up
a bit and come back to the downside.
Do not freak out, this does not mean the
price will crash...it just means that some
of the money will come out of BTC and
be moved into the Alt-coin market...which
will make the Alt coins scream bullishWhen Bitcoin Dominance
gets to 39%-31% thats when
ALT coins will absolutely RIP!

Show the price of shib with the market cap of BTCShow the price of shib with the market cap of BTC
I think soon we will see shiba pump at least for 50% upward to levels 3000-3300 sat.
If you like this analysis, smash the "like button" and leave a comment below to share your thoughts
or let me know what crypto you want to see!
Trading is a reflection of yourself. Learn more daily and be ready for every opportunity.
Have a nice trading!

BTC Market Cap AnalysisPlease zoom out to see all the ups and downs.
If the green trendline cannot hold, then things will get so ugly.

BTC Market Cap (Time to resume the bullish momentum)This is the weekly timeframe of BTC market cap, as you can see the BTC often bounce off the trendline which acts as an support. Base on this, i feel BTC is gaining dominance as we reclaim back 1 trillion market cap for BTC. As history data proven, during the period where we count down to end of the year, it's gonna be bullish for crypto market.
BTC Market Cap

BTC Market Cap Domination Domination is near big support, there is probability that the domination will rise from that support around 39%. If this will happen and the price of btc despite that will go down, it means that alts will bleed a lot, 2x more than btc. If the price will rise along with the domination it simply means that the money will be going mostly to BTC and alts will rise slowly. The other scenario is that we will break that support and domination will fall to around 35% in this case we may have similiar situation to January 2018 when the huge altseason started.
We can also see that there is divergence on 1D timeframe on MACD which may suggest that we won't break this support and the dominance of btc will start to rise.
Be careful, always do your own research.
It is not financial advice, I'm just sharing my personal view.

Crypto Market Capitalization is touching last ATH'sCrypto Market with BTC still has a little road to go until last ATH (red line), but TOTAL ALTS capitalization(without BTC) is touching his last ATH, so its at crucial point right now.
Be careful, tomorrow BTC has a fundamental with El Salvador making it legal money, this can lead to a new 2021 Bull Run or could be the start of a correction, as BTC is touching 68.70% Fibo right now at 52.500.
Regards.
Eng Alexa.

BTC:USD analysis/predictionHello everyone.
Just wanted to share my idea on todays BTC movement. My analysis is based on BTC Shorts and BTC marketcap charts movements.
To clarify:
Green shield= Support,
Red shields= Resistance,
Thank you for checking it out!
Would love to hear your ideas on this analysis.
Disclaimer:
This is just my idea and should not be used as a financial advice.

SHIB- Dog MEME coinAll major Inu coins- Alaska Inu (LAS), Kishu Inu (Kishu), Hachiko Inu (Hachiko), Hokkaidu Inu (HOKK), Akita Inu (Akita) and Shiba Inu (SHIB). They are all copycats of DOGE and we even have the copycat of the copycat- Baby Akita (BKITA).
Most of these meme coins are only available on DEXs/AMMs except Kishu Inu (Kishu)- OKEx, Akita Inu (AKita)- Poloniex & Okex and Shiba Inu (SHIB)- Binance, Huobi, OKEx and Poloniex.
SHIB has the highest liquidity and has the confirmed marketcap (at least it was created in 2020). These meme coins are highly speculative and volatile and have zero fundamentals so they are only good for short swing plays while crypto market remains bullish.
BTC marketcap is short- term bearish and continues to range within the consolidation with the support lvl at 40k. Altcoin marketcap is overheated so I expect some pullback.
Looking for quick bounce back plays inside both demand zones. If BTC breaks below 40k, then looking to get in inside the second demand zone. These meme coins are highly risky so open a small position with tight stop loss and take the profit aggressively.
Follow me and smash that like button.
Just my two cents. Not the investment advice. Please do your own research.

BTC Dominance ideaExpect a small bounce for BTC Dominance and then 30-25%.
Afterwards, BTC will be in full control again...


We already started ALTS honey moon Considering to Market Cap BTC Dominance its really clear that In terms of technical analysis, we have head and shoulders pattern is a predicting chart formation that usually indicates a reversal in the trend where the market makes a shift from bullish to bearish it mean that BTC will have lower control over ALTS coins generally and its predicted that we will have a honey moons for all alts buy closing below 59 with a very high volume for today we may have some short term reverse before a deeper drop toward 50 and then 43 if we are lucky … So lets start the party
