BTC/USDT RSI Analysis !!BTC/USDT RSI Analysis
RSI (Relative Strength Index) breakout analysis.
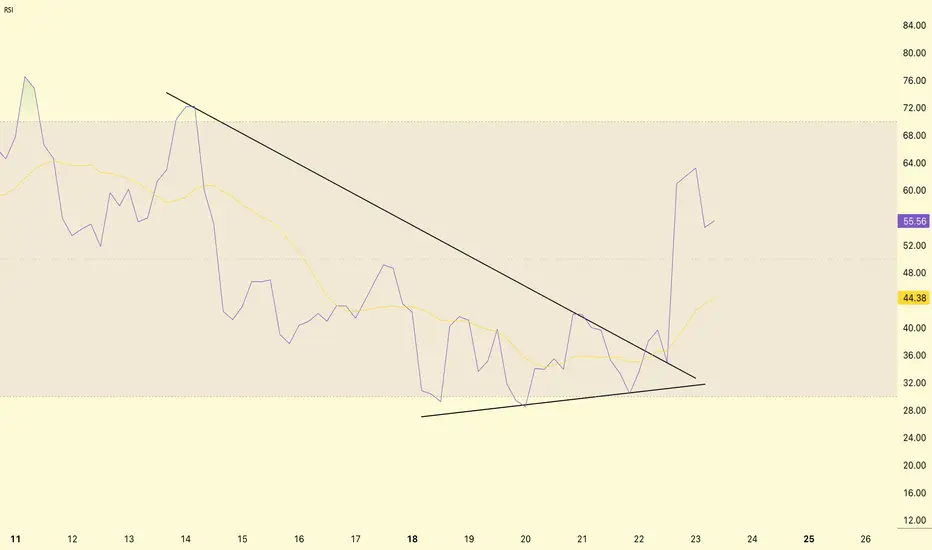
Descending wedge in RSI
From August 11 to August 22, RSI was forming a descending wedge pattern (lower high, higher low).
This is usually a bullish reversal setup.
RSI breakout
RSI broke out of the bullish wedge on August 22 → rose from ~30 to ~65.
Current RSI = 55.97 → from neutral to bullish territory.
Moving average (yellow line) = 44.41, which means RSI is above the trend, indicating positive momentum.
RSI breakout confirms strong buying interest.
This could mean that BTC has completed its short-term correction phase and is ready for another rise.
DYOR | NFA
Btcshort
Will a Fed Rate Cut Cause Bitcoin to Fall? A Look at the Market'As September approaches, the financial world is on high alert for the next Federal Reserve meeting. After a period of high inflation, the Fed has been holding interest rates steady, but recent comments from Fed Chair Jerome Powell have raised expectations for a rate cut. While many might think a rate cut is great news for risky assets like Bitcoin, the reality is more complex. The market's reaction could be a classic case of "buy the rumor, sell the news."
The "Buy the Rumor, Sell the News" Effect
For months, traders have been speculating that the Fed would eventually cut rates. This anticipation has already been a major factor in the recent rally of Bitcoin and other cryptocurrencies. When investors believe that borrowing money is about to get cheaper, they are more willing to move their money out of safe investments, like government bonds, and into riskier assets that have the potential for bigger gains. This is a key reason why Bitcoin has been performing well.
However, this is where the risk lies. The market has likely already "priced in" a September rate cut. This means that the current high price of Bitcoin already reflects the expectation of this event. When the Fed actually announces the cut, there may not be a new reason for the price to go up. In fact, many traders who bought in anticipation of the news might decide to sell their holdings to lock in their profits, causing a short-term drop in price. This is a common pattern in all financial markets.
Looking at the Broader Picture
While a rate cut is generally seen as a positive for Bitcoin in the long run, the short-term impact is not guaranteed to be a straight shot up. The Fed's decision is just one piece of the puzzle. Other factors that could influence Bitcoin's price include:
Inflation: The Fed's main job is to control inflation. If inflation remains stubbornly high, the Fed might signal that this is the only rate cut for a while, which could dampen market enthusiasm.
Economic Outlook: If the Fed cuts rates because the economy is showing signs of weakness, investors might pull back from all risky assets, including Bitcoin, out of fear of a recession.
Regulatory News: Any new regulations or statements from governments about cryptocurrencies could also cause a significant market reaction, regardless of what the Fed does.
⬇️ Sell now or sell on 115669.0
⭕️SL @ 116080.0
🔵TP1 @ 113449.0
🔵TP2 @ 111600.0
Risk Warning
Trading Forex, CFDs, Crypto, Futures, and Stocks involve a risk of loss. Please consider carefully if such trading is appropriate for you. Past performance is not indicative of future results.
Conclusion: Caution is Key
For traders and investors, the key takeaway is to approach the upcoming Fed meeting with a healthy dose of caution. While a rate cut is widely expected, it's not a guaranteed path to higher prices. The smart move is to understand the different scenarios and not to get caught up in the hype. Bitcoin's price has already been influenced by the rumors of a rate cut. The actual announcement could very well lead to a period of volatility and even a temporary pullback as traders take profits.
If you liked our ideas, please support us with your likes 👍 and comments.

BTC Exhaustion Zone-The Finally 📉 BTC Exhaustion Zone = Next Targets in Sight
Now that we’ve had a confirmed daily close below the 2025 High Trendline, the path is clear:
🎯 Next Stop: May 2025 ATH
If we crack that? We’re likely headed straight into our Third Take Profit$ Zone — deep in the volatility pocket.
🔽 What Comes After the Drop?
Once we tag the teal descending trendline (or close to it), it sets up a high-probability trampoline move — launching us back toward the 2021 High Trendline.
🧠 That’s the bounce zone to watch: a powerful spot to reassess, and ride into September with the Exhaustion Zone behind us, but false narrative ahead of us, which can very well bleed AMEX:BTC into RED.
So go ahead — get your long hats ready, but only after the trap is set and sprung.
—
📌 The Alpha View
This is planned destruction → into precision reaccumulation.
We're moving level to level with surgical precision once again.
Stay Sharp. Stay Regulated.

BTC Short Trade Setup – Bearish Momentum
🎯 **BTC Short Trade Setup – Bearish Momentum**
📌 **Instrument:** BTC
📉 **Direction:** SHORT
💰 **Entry Price:** \$115,200
🛑 **Stop Loss:** \$116,500
🏹 **Take Profit:** \$111,500
📏 **Position Size:** \$5M (1% of \$500M account)
💪 **Confidence:** 65%
⏰ **Timing:** Enter at market open
⚠️ **Key Risks:**
* Market volatility can trigger rapid moves.
* Breakout above \$116,500 invalidates setup.
* Macro correlations may amplify risk.
✅ **Rationale:**
* Lower highs & lower lows = bearish momentum
* Price below key MAs, weakening bullish conviction
* Technical indicators support short entry
🔥 **TradingView / Social Tags:**
\#Bitcoin #BTCShort #CryptoTrading #CryptoAnalysis #FuturesTrading #TechnicalAnalysis #TradingSignals #RiskManagement #MarketAnalysis #CryptoAlerts #HighConvictionTrade #BearishSetup #PriceAction #TradingStrategy #CryptoMarket

BTC 1W😎Probabilities of a correction to the 55-period moving average, a technical rebound for bullish continuation, without breaking the weekly uptrend.
♥ Keep in mind that a correction to the 55-period moving average on the weekly chart constitutes a bearish trend on the daily chart.

BTC levels for August 2025Simple channel on BINANCE:BTCUSDT.P
retest of equilibrium with main liquidations of 20x - 40x leverages around 113600
this weekend or if we will see some bad macro news drop by end of 12-15 august
109900
keep charts simple

BTC Update: Still Trapped in the Exhaustion ZoneBTC Update: Still Trapped in the Exhaustion Zone
Yes… we're all exhausted. And right on cue, BTC prints a second Exhaustion Candle on the daily. That’s not bullish.
A dip before a rip? Very likely.
—
🔍 The Setup
BTC still behaving strong overall — this would be a counter-trend dip if it comes.
Shorting here is playing defense, not offense.
📌 Key Level to Watch:
The 2025 High Trendline — drawn from Jan to May highs — is now likely acting as support, not resistance. Expect aggressive buyers there if price drops.
—
🐻 If Bears Claw Through That Line…
• First stop = May ATH (~112K)
• This time, don’t expect the bulls to hold it as easily
• If that cracks, next stop = the downward sloping trendline — the one that's quietly caught every breakdown since this zone began.
—
📌 The Alpha View
The second exhaustion candle is a warning shot.
This dip might be brief — but if bulls fail to show strength at the right level, it could spiral.
Stay sharp. Stay regulated.
Let the structure speak — not your emotions.

BTC Accumulates and Adjusts Slightly💎 BTC WEEKEND PLAN UPDATE (15/08)
BTC Analysis After PPI
Trading Highlights
After the PPI release, BTC completed its bullish wave and reached a peak of 123.2K, exactly at the 2.618 Fibonacci Extension level – a strong resistance zone that had been anticipated.
Afterward, the price sharply reversed, dropping to the 117K support area – aligning with the main uptrend line and the 0.236 Fibonacci retracement of the most recent bullish wave → this was where we successfully executed a bottom-picking buy.
Current Price Action
The price is now recovering from 117K toward the 120.7K – 121K resistance area (a confluence of the 0.618 Fibonacci retracement, a previous supply zone, and the H4 EMA).
The short-term trend remains a technical rebound after a sharp drop, with no confirmed sustained bullish reversal yet.
Scenarios & Next Trend
• Main Scenario: Price rebounds to 120.7K – 121K → faces selling pressure → sharply reverses downward following a corrective wave toward 116K – 115K (strong support).
• Alternative Scenario: If 121K is broken with high volume, BTC could revisit the 122.9K – 123.2K zone.
Key Levels
• Resistance: 120.7K – 121K / 122.9K – 123.2K
• Support: 117K / 116K – 115K”

"BTC at Critical Reversal Zone – Watch This Key Liquidity Trap
"BTC at Critical Reversal Zone – Watch This Key Liquidity Trap 🎯"
Market Structure Overview
BOS (Break of Structure): Multiple BOS points indicate shifts in trend phases, first to the downside (end of July to early August) and then back to the upside.
BOL (Break of Low): This marked a key liquidity grab before the reversal rally began.
Liquidity Zones: The chart highlights both sell-side liquidity (below lows) and buy-side liquidity (above highs), showing where institutional traders hunt stops.
2. Key Supply & Demand Zones
Support Zone (112,500 – 114,500): This level acted as a demand base after the liquidity sweep in early August. Price reacted strongly here, triggering the bullish leg.
Previous Resistance (121,500 – 122,500): This zone has capped price multiple times, making it a critical area for sellers to defend.
3. Current Trade Setup
Entry Zone: Around 120,000 – 120,400, where a short setup is triggered upon rejection.
Stop Loss: Above 122,120, just beyond the resistance to avoid premature stop-outs.
Target: 116,500 – aligning with prior liquidity pools and structural support.
4. Educational Takeaways
Liquidity Hunts: Notice how price often spikes into liquidity pools before reversing—this is common in BTC’s volatile environment.
Confluence Trading: The short setup aligns with resistance retest + liquidity grab + BOS, increasing probability.
Risk Management: Using defined zones for stop loss and target helps maintain a favorable risk/reward ratio.
Summary:
BTC is currently respecting the higher-timeframe resistance zone, with a clear short-term bearish setup in play. A rejection from the entry zone could trigger a drop toward the 116,500 target. Traders should monitor price action closely and avoid chasing entries—patience and precision are key.

14.08 2025Yesterday my plan was clear if we make a little correction then I will open a long position to the ATH or if we go above ATH then I will open short position. And now it is a time to short market and my plan is clear and I'm gonna short market to 118,100 I see there a potential reverse zone if we grab liquidity from there.

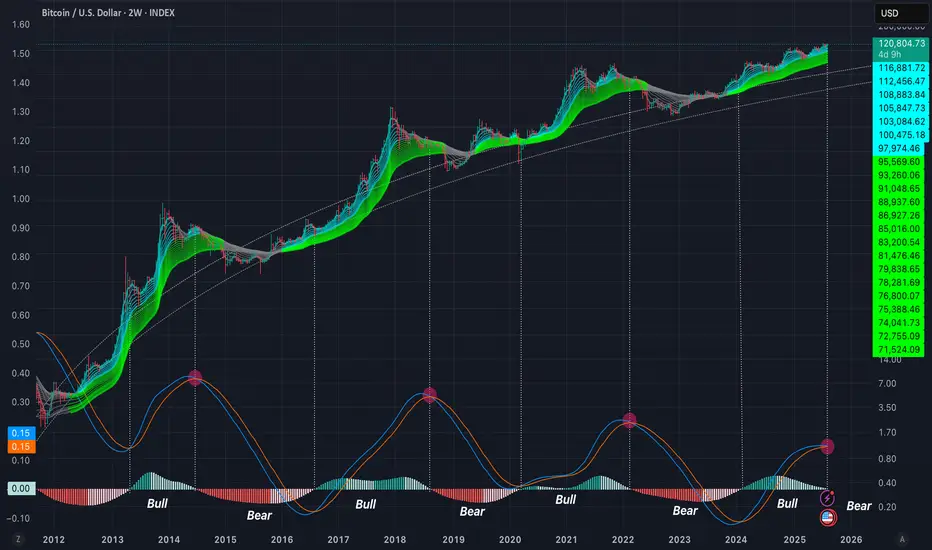
Topping indicator in a 2W Time frameThis time we are going to see the topping indicator in the 2W time frame. As you can see and IF this time is not different we are about to start seeing LMACD crossing and the red histogram showing up indicating the beginning of the bear market. 🥂
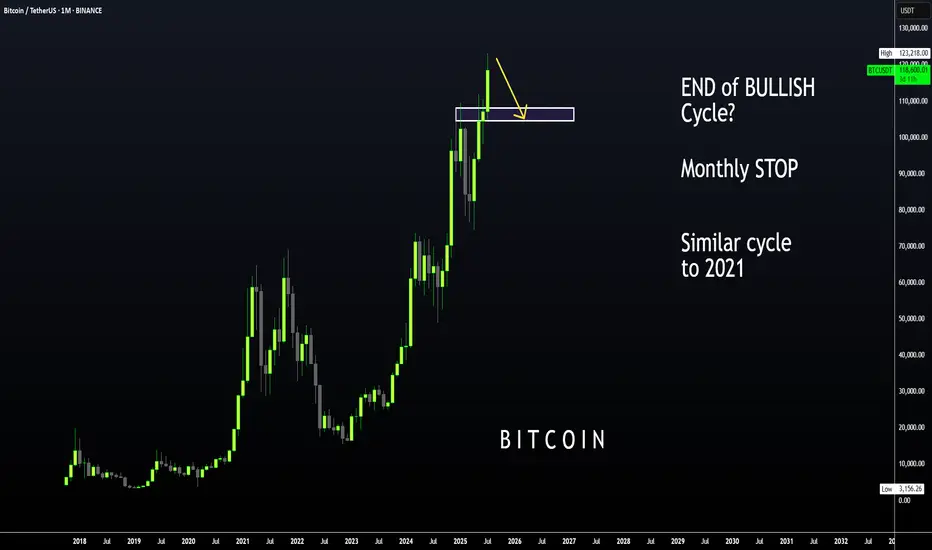
BTC | ALT Season, then BEARISH CYCLE BeginsBitcoin is likely moving in to the beginning of a bearish cycle.
I'm not saying this is immediate, we first need to see altseason - however, if BTC increases it may not go any higher than the last high of $123k. We could easily see the price hover around this zone with a few small increases and decreases for the next few weeks as alts make their respective moves.
I have been talking about the 2021 fractal for a couple of months, where BTC took its time to correct and then made another ATH which was only slightly higher.
We already see a similar pattern playing out in the monthly timeframe if we overlay bars pattern from 2021:
Although Bonce zone 3 may only be in several months, these are the major support zones where BTC could bounce from. Ideal for a swing:
____________________
BINANCE:BTCUSDT
BTC/USD – Key Support Retest & Potential Breakout Zone | Current Price Action:
Trading near 118,543, price has broken below the yellow consolidation zone (~119,000) and is showing short-term weakness.
Resistance Levels:
Immediate resistance at 119,284, then 119,841, with stronger supply zones at 120,900 and 121,545.
Support Levels:
First support at 117,923, followed by 116,495. A breakdown of 117,923 could accelerate selling pressure.
Trend Outlook:
Short-term bias is bearish after repeated rejections from 119,284–119,841 zone; lower highs are forming.
Trading Bias:
Bullish: Break & hold above 119,284 → targets 119,841 / 120,900.
Bearish: Sustained trade below 117,923 → opens path to 116,495.

BTC ~ are you very bullish?BTC looks so dead, ideal buys goes to the range, means any good buys to hold, else its same you will get trapped anyways

BTC Price Action Screams Sell — Is $115K Next?
• The move to $122.5k looks like a sharp liquidity grab / exhaustion wick rather than a sustained follow-through.
• Price failed to hold the top (small bearish candles after the spike) and is now sitting on/near a shallow support area — a classic place for sellers to press once momentum cools.
• Multiple prior “S” markers around the mid-$118k zone show persistent supply there; that same supply can re-assert as price retests.
• Bearish bias while price remains below the red supply zone (~$122.2–122.5k) and until it can reclaim & close above ~123k on 1H.
Key levels (read from the chart)
• Immediate resistance / supply zone: 122,200 – 122,501 (red box).
• Current price shown: 121,506.61.
• Support levels (dotted lines): 119,872.53 (first), 118,864.72 (second), 115,843.52 (stronger support / demand).
• Invalidation for the bearish plan: sustained close above ~123,000 (1H close).
Two actionable bearish setups (with exact math)
Setup A — “Rejection short” (preferred)
• Rationale: Wait for a retest/rejection of the red supply zone (122.2–122.5k).
• Entry: 122,200 (short on clear rejection candle)
• Stop: 123,000 (above the supply) → risk = 123,000 − 122,200 = 800 points.
• Targets:
o TP1 = 119,872.53 → reward = 122,200 − 119,872.53 = 2,327.47 → R:R = 2,327.47 / 800 = 2.91 : 1.
o TP2 = 118,864.72 → reward = 122,200 − 118,864.72 = 3,335.28 → R:R ≈ 4.17 : 1.
o TP3 = 115,843.52 → reward = 122,200 − 115,843.52 = 6,356.48 → R:R ≈ 7.95 : 1.
Setup B — “Breakdown short” (if price loses structure)
• Rationale: Trade the structure break — enter only after a clean breakdown below a nearby support retest.
• Entry: 121,000 (short once price decisively breaks and retests lower side)
• Stop: 122,000 → risk = 1,000 points.
• Targets: same support ladder:
o TP1 = 119,872.53 → reward = 121,000 − 119,872.53 = 1,127.47 → R:R = 1,127.47 / 1,000 = 1.13 : 1.
o TP2 = 118,864.72 → R:R ≈ 2.14 : 1.
o TP3 = 115,843.52 → R:R ≈ 5.16 : 1.
Short trade management / rules
• Position sizing: risk a fixed % of account per trade (e.g., 0.5–1%). Use the risk points above to size the position.
• Scaling: take ~25–40% at TP1, move stop to breakeven on first partial fill, trail rest to TP2/TP3.
• Confirmation: prefer one of these confirmations before entry — bearish 1H close below the short entry or clear rejection wick + volume spike to the upside followed by selling. (I can’t see live volume here — check it on your platform.)
• Invalidation: an hourly close above ~123k invalidates the bearish plan; flip bias to neutral/bull.
Why this is a high-probability bearish setup
• The rally was fast and left small-range candles after the spike — typical of exhaustion where liquidity was swept.
• Prior range had repeated sells around lower highs (S markers) — that supply doesn’t vanish; a failed breakout often returns to fill that liquidity.
• The downside targets are relatively close (TP1 is only ~1.63k points below current price, about 1.34%), so short targets are reachable without needing a large trend reversal.
(Example percent math shown exactly: current 121,506.61 − TP1 119,872.53 = 1,634.08 points → 1,634.08 ÷ 121,506.61 = 0.0134485 → ≈ 1.345% drop to TP1.)
Watchouts / final notes
• If BTC prints strong continuation volume on a push above 122.5k and holds >123k on hourly closes, the short edge is gone.
• Check 4H / daily to ensure this isn’t just a higher-timeframe bullish leg that will quickly absorb short pressure. If higher TF shows strong bullish structure, keep stops tighter.
• Not financial advice — treat this as a technical plan and adjust sizing/risk to your rules.

BTC going back to the trenches to schemeBTC/USD – Bearish Pullback to $110,000 Incoming?
Technical Overview:
Bitcoin is currently showing signs of exhaustion after reaching the $125K–$130K resistance zone, which aligns with the upper boundary of the long-term ascending channel formed since the $20K breakout. RSI is flashing strong bearish divergence on the daily and weekly timeframes, suggesting the bulls are losing momentum.
The price also failed to hold above the key psychological level at $120K, now acting as strong resistance. A decisive break below the $115K support zone could trigger a broader correction down toward $110,000, which marks the following confluences:
0.382 Fibonacci retracement of the last impulse from $95K to $130K
High-volume node on the VPVR (Volume Profile Visible Range)
Retest of the previous macro breakout level (former resistance now potential support)
Macro Factors:
Growing speculation of delayed rate cuts from the Fed is putting pressure on risk-on assets, including crypto
Whales and institutional players have been seen rotating out of BTC into altcoins and cash in recent on-chain data
ETF inflows have slowed dramatically compared to earlier in the cycle
Conclusion:
Unless BTC can reclaim $120K with strong volume, the path of least resistance looks like a healthy correction toward $110,000, where stronger demand may kick in. This could provide a better risk-reward entry for long-term bulls.
🚨 Watch for a daily close below $115K to confirm bearish!

Bitcoin Short SetupHi everyone.
In Bitcoin 1H TF we have a CHoCH followed by a BOS and a pullback, I think it is possible the price meet this area and then continue to go down...
Let's see what happens...
Good luck

U.S. Dollar Index (DXY) !!U.S. Dollar Index (DXY)
Long-Term Channel Support Held
The chart shows DXY moving within a rising parallel channel since around 2008.
Recent price action bounced right from the lower trendline (~98 zone), indicating strong structural support.
Bearish Pressure
DXY dropped below 100, currently around 98.72, down 1.32% this month.
Trading below the 200-month EMA, which suggests weakening long-term strength.
Bearish candlesticks forming near the lower channel indicate an increased risk of a breakdown if support fails.
Ichimoku Cloud Signal
Price below the Kumo (cloud) = bearish territory.
Cloud turning thin ahead — signaling potential indecision or transition.
What This Means for Markets
If the DXY breaks below this channel, it could trigger a broader USD sell-off, potentially bullish for cryptocurrencies, gold, and emerging markets.
If support holds, expect a rebound toward the 104–106 zone, especially if macro sentiment favors the dollar.
Stay updated and manage your risk accordingly.
DYOR | NFA

BTC-Stay Sharp. Self RegulateBTC Update
👀All Eyes on These Levels 👇
We’re back in A zone.
The level? 115,727.
This isn’t just any line on the chart — this is the same trendline that flipped from major resistance to support back to resistance on the same date of the infamous #bUCKmOON pump.
📈 If BTC breaks this level with strength and volume — I’m in long.🟢
No volume? No conviction. No entry.
But let’s not get carried away — resistance lurks right above at 117,000 — the former Exhaustion Zone Support now turned resistance.
A classic case of "what once held you up now wants to drag you down."
And if the bulls somehow clear that hurdle?
They'll run headfirst into the Exhaustion Zone Resistance — the real boss fight.
These are stacked walls — one after the other. No easy wins here.
🧠 As a chartist, I’m not here to write about what happens if we break through every ceiling like it’s some fanboy fantasy. That’s not analysis — that’s hopium.
🥂 Yeah yeah but— it’s fun to daydream about all the champagne showers, yacht parties, laser eyes, and the sudden urge to start a DAO that changes the world.
We all picture it.
We all love it.
And sure, when BTC rips through all resistance like butter, we’ll act like we "knew all along."
But anyways — snap back to reality...
There’s another level we can’t ignore:
112,388
👀 Even a 4-hour close below this level?
Just check the chart.
That’s when the bears come storming out of hibernation — angry, hungry, and ready to feast.
🎯Bottom line:
Stay sharp. Self Regulate.
The chart is the map. Discipline is the treasure.

#BTC Update #13 – Aug 01, 2025#BTC Update #13 – Aug 01, 2025
Bitcoin has approached the lower edge of its current channel and received a reaction from there. However, in the current timeframe, the ongoing candle seems willing to pull back again. The MA200 band held the previous candle well, which also represented the bottom of the current channel. There is high liquidity between the $113,200 and $121,000 zones. I believe Bitcoin will continue to move by sweeping through this region. Therefore, I think Bitcoin’s current target is to reach around the $118,000 level with a 3% push move.
If Bitcoin does not make this move and chooses to pull back instead, it may go as far as filling the imbalance at the $110,000 level. The last impulsive move was made around 20 days ago, and since then, the chart has been progressing with a correction of a correction. As long as there’s no close below $107,500, the uptrend will remain intact in the long term. However, if the $107,500 level is broken with a strong candle, we can say that Bitcoin has turned bearish on the 4-hour timeframe. For now, this doesn’t seem very likely. I believe Bitcoin’s next move will target the $118,000 region, continuing to clear out the liquidity accumulating in the upper ranges. However, this channel will need to break at some point.

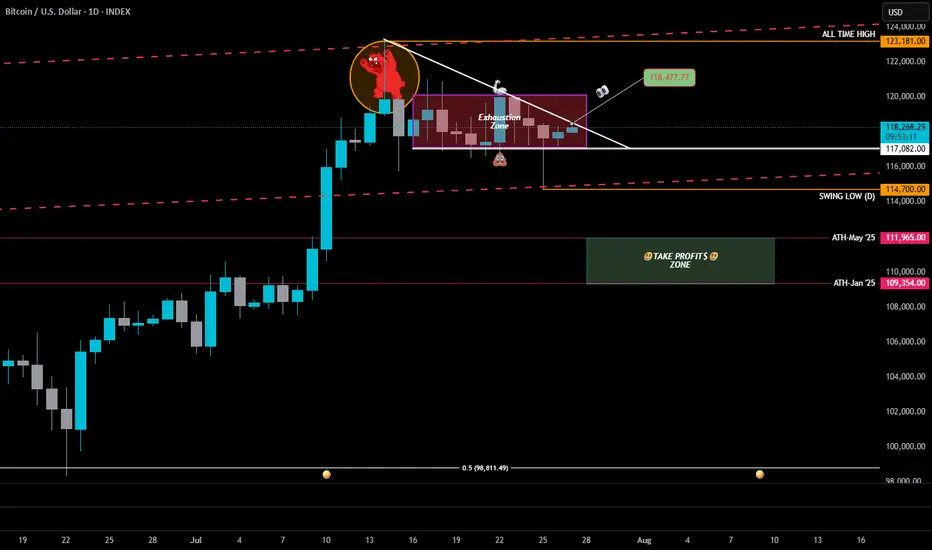
BTC Exhaustion Zone Update: The Bulls Charged… But the Zone HeldExhaustion Zone Update: 2025–208
📉 Exhaustion Zone Update: The Bulls Charged… But the Zone Held
On Friday, BTC dipped to 114,700, printing a fresh Daily Swing Low — a classic liquidity grab. The bulls stormed in for reinforcements, pushed price back up late in the day…
but once again, the Exhaustion Zone stood its ground.
BTC closed lower than Thursday, and since then? Pure chop.
Feels like both bulls and bears took the weekend off to watch Netflix.
—
🔻 The Downward Trendline Still Rules
Today, it’s simple: Bulls must close above 118,477.
That’s the trendline test — hesitation here, and the bears come clawing.
Usually I’d say, "give the bulls until Monday"...
but this year has shown us one thing:
🐋 The Whales Hunt on Sundays.
If the bulls don’t step up today, we might learn the hard way why it’s called the Exhaustion Zone.
—
📉 The Risk if Bulls Fail
BTC already gathered all the bulls it could down at the Daily Swing Low — and they’re tired.
If they can’t break out, the High-Powered Short Zone (dashed red lines) will take over.
The bears? Heavy. Angry. Overdue for a window jump.
🎯 Next floors down:
• May ATH → 111,965
• January ATH → 109,354
That’s the Take Profit$ Zone 👇
And honestly? I’m letting a small short position ride in case the evil whales take us all the way to the 50% level (98,811).
—
📌 The Alpha View
To the bulls: It’s showtime.
Either close above 118,477 today…
or the All-Time High Parade might just reroute — straight down the fire escape. 🐻🔥
BTCUSD Key Supply Zone Rejection – Bearish Target Mapped BTCUSD Key Supply Zone Rejection – Bearish Target Mapped (Educational Breakdown)
⸻
🧠 Technical Analysis (1H Chart):
• Range Structure: BTCUSD is currently trading within a well-defined consolidation range between the Resistance Zone ($119,850–$120,591) and the Support Zone ($116,937).
• Volume Profile (VRVP): Volume is noticeably thick near the mid-range, suggesting accumulation/distribution behavior. Price is struggling to break above the value area high near $120K.
• Resistance Rejection: After testing the upper supply zone, price failed to sustain bullish momentum and is showing signs of exhaustion – a possible sign of institutional selling.
• Target Zone: If price rejects this resistance again, a strong move toward the target level of $117,260 is expected. This aligns with:
• Mid-range liquidity sweep
• Low-volume node (LVN) below current price
• Fair Value Gap fill near $117,200–$116,900
⸻
🧩 Key Concepts Highlighted:
• Support & Resistance Mapping
• Volume Profile Readings
• Institutional Order Flow Bias
• Target Projection using Smart Money Concepts
⸻
⚠ Educational Insight:
This setup is a perfect example of how to combine Volume Profile + Price Action to identify liquidity traps and smart entries. Always wait for confirmation near key zones — not every level breaks!
⸻
✅ Trade Plan (Not Financial Advice):
• Watch for bearish engulfing/rejection wick at resistance
• Short entry below $119,000 with SL above $120,600
• Target: $117,260 / Final TP: $116,937 zone

BTC-Alpha-"Exhaustion Zone" Update📍All Eyes on $119,300
Why? Because that’s the line that could break the bearish narrative.
A clean push above = bulls showing real strength — not just surviving, but swinging.
It might look like BTC is doing nothing… but under the hood, the chart is very much alive.
If bulls can’t break the descending trendline, it’s not just hesitation — it’s exhaustion.
And when bulls run out of gas?
The High-Powered Short Zone starts pulling like gravity.
—
🔸 Chart Patterns in Play
🟥 Bear Flag / Distribution Box
• Price is consolidating beneath a lower high + descending trendline
• Every rally attempt has fizzled inside the Exhaustion Zone
• Repeated failures at $119,300 = a clear ceiling
🟩 Coil Within Compression
• Higher lows pushing up against downtrend resistance
• Price is coiling tight — and compression always precedes expansion
• A breakout (or breakdown) is coming… the spring’s loaded
—
🧭 What to Watch
🔓 Break above $119.3K with volume = bull momentum resumes
❌ Break below $117K = bear flag confirmed → welcome back to the High-Powered Short Zone
—
Stay Sharp. Don’t confuse quiet charts with quiet outcomes.
BTC is gearing up for a move that won’t whisper.
