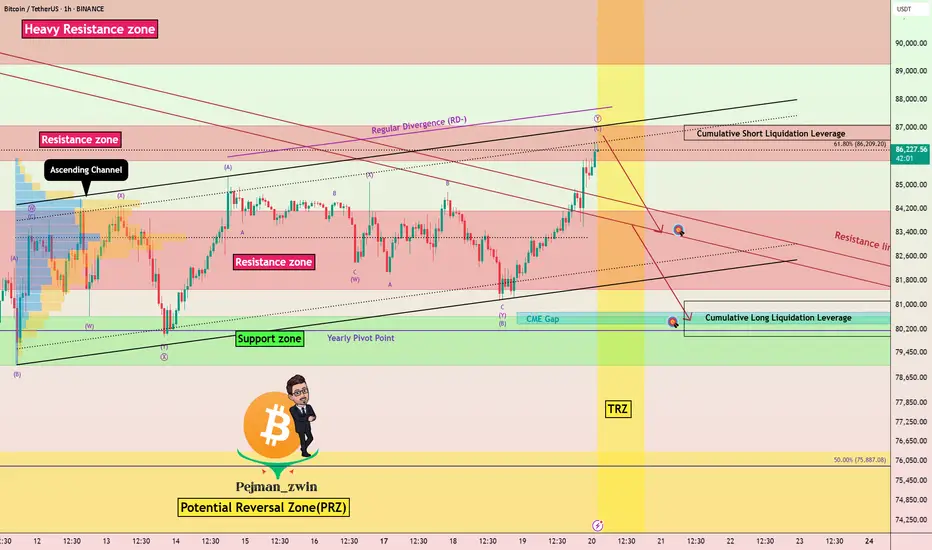
CME Gap Target: Is Bitcoin Headed for $80K!?Bitcoin ( BINANCE:BTCUSDT ) is moving in the important Support zone($84,120_$81,500) , and on the 1-hour time frame , Bitcoin is moving near the Support zone($82,360_$82,000) and the lower line of the ascending channel (small) .
Overall, Bitcoin has started another downtrend after breaking the lower line of the ascending channel (big) .
Since trading volume is generally low on Saturdays and Sundays , it is unlikely that the important Support zone($84,120_$81,500) will be broken before the financial markets open .
In terms of Elliott Wave theory , Bitcoin appears to have completed the main wave 3 at $81,644 and is currently completing microwave C of the main wave 4 . The main wave 4 will most likely have a Zigzag Correction(ABC/5-3-5) .
In general, the financial markets and US indices such as TVC:DJI , SP:SPX CME_MINI:NQ1! were not in a good state last week , and this trend will most likely continue next week . The tariffs that Donald Trump is imposing on countries around the world, as well as the turbulent situation in the Middle East , will all lead to the possibility of a fall in Bitcoin and other financial markets in the coming days.
I expect Bitcoin to make at least a temporary increase to $83,200 and then next target the Resistance zone($84,380_$83,580) and the upper line of the ascending channel before starting to fall and attack the important Support zone($84,120_$81,500) and also fill the CME Gap($80,760_$80,380) .
Note: If Bitcoin breaks above the Resistance zone($84,380_$83,580), we can expect more pumping.
Please respect each other's ideas and express them politely if you agree or disagree.
Bitcoin Analyze (BTCUSDT), 1-hour time frame.
Be sure to follow the updated ideas.
Do not forget to put a Stop loss for your positions (For every position you want to open).
Please follow your strategy and updates; this is just my Idea, and I will gladly see your ideas in this post.
Please do not forget the ✅' like '✅ button 🙏😊 & Share it with your friends; thanks, and Trade safe.
Btcsignals

BTC/USDTwhat's the ultimate bear market signal?
it's the 50-week ema.
if CRYPTOCAP:BTC is above or reclaims the 50w ema it's bull mode. stay long
if CRYPTOCAP:BTC breaks below and can't reclaim it bear market vibes exit and wait.

Bitcoin Short short ermThis is just a trade idea! And an idea is an idea and exists as an idea,as nobody can predict the markets. No body!
Some media say:Trump Pushes Advisers To Intensify Tariffs Ahead Of April 2.If it will be true ,
Then I prepare for this scenario(SEE THE CHART) above!.
Someoone commented below my last idea,he wants price action and I should draw lines and paint the charts for him . I wonder,that he doesent know that there is always price action! We just need to look at the charts. Above is also a chart. Lol.
But drawing lines, projection ghost lines is Not trading! It is drawing and painting.
Whatever: Fundamentals align with long term trend sentiment: Bearish. Sure surprises will always be present.Thats speculation! Therefor:Put always stops. And dont follow blindly any trade idea. Also my trade idea is just an idea. But you should take responssibility to take your own decision. Because you trade with your own money.
EMAS: 15 min. 200MA, 3min. 200MA
Stop above val of yesterday
Resisatnce:POC of yesterday red line. Breakthrough above the red line is bullish setup, and leading to val of yesterday
If rejected, falls back.If holds above the price will climb.I dont think that it happens, because the trend continutation pattern I use(There are billions of trend continuation patterns!!!!!!!! Also billions of ways to define a trend!!!!!)
is currently bearish!....
Ofcourse on any other TF you will have billions of reasons to do the opposite of trade idea,you you are welcomed.
Have a good trading day.

15-Min Bitcoin Setup – Quick Scalping Opportunity?First of all, I must say that this is a short-term analysis in a 15-minute time frame . Please be careful .
Let's take risks while respecting capital management. Be sure to respect capital management.
Bitcoin ( BINANCE:BTCUSDT ) is currently trading in the support zone($84,120_$81,500) , Potential Reversal Zone(PRZ) near the lower line of the ascending channel .
In terms of Elliott Wave theory , it seems that Bitcoin could complete its 5 bearish waves near the lower line of the ascending channel .
Also, we can see the Regular Divergence(RD+) between Consecutive Valleys .
I expect Bitcoin to be able to rise to at least $85,400.
Cumulative Short Liquidation Leverage: $86,397_$85,760
Cumulative Long Liquidation Leverage: $84,262_$83,336
Note: One of the reasons for Bitcoin's decline is the decline in US indices such as CME_MINI:NQ1! , SP:SPX , and TVC:DJI .
Note: If Bitcoin falls below $83,000, we can expect more dumps.
Please respect each other's ideas and express them politely if you agree or disagree.
Bitcoin Analyze (BTCUSDT), 15-minute time frame.
Be sure to follow the updated ideas.
Do not forget to put a Stop loss for your positions (For every position you want to open).
Please follow your strategy and updates; this is just my Idea, and I will gladly see your ideas in this post.
Please do not forget the ✅' like '✅ button 🙏😊 & Share it with your friends; thanks, and Trade safe.

Bitcoin’s Next Move – Another Attack to Heavy Resistance Zone!!!Bitcoin ( BINANCE:BTCUSDT ) was successful in three moves , as I expected in my previous post . I still think Bitcoin will NOT stop trying to break the Heavy Resistance zone($93,300_$89,200) .
Bitcoin is moving near the Support zone($87,100_$85,800) and Cumulative Long Liquidation Leverage($86,376_$85,411) .
Regarding the Elliott Wave theory , Bitcoin appears to be completing microwave C of the main wave 4 . The structure of the main wave 4 is a Zigzag Correction(ABC/5-3-5) .
If we look at the USDT.D% ( CRYPTOCAP:USDT.D ) chart on the 4-hour time frame , USDT.D% is pulling back to the Uptrend line and is currently in the Resistance zone(5.30%-5.15%) . There is a possibility of completing the Bearish Flag Pattern .👇
I expect Bitcoin to rise again in the coming hours and attack the Heavy Resistance zone($93,300_$89,200) , Potential Reversal Zone(PRZ) , Resistance lines , Monthly Pivot Point , and 50_SMA(Daily) .
Note: If Bitcoin falls below $85,400, we can expect more dumps.
Market Developments:
GameStop announced BTC adoption as a treasury asset, signaling growing corporate interest.
Trump Media partnered with Crypto to launch crypto ETFs, adding institutional momentum.
Please respect each other's ideas and express them politely if you agree or disagree.
Bitcoin Analyze (BTCUSDT), 1-hour time frame.
Be sure to follow the updated ideas.
Do not forget to put a Stop loss for your positions (For every position you want to open).
Please follow your strategy and updates; this is just my Idea, and I will gladly see your ideas in this post.
Please do not forget the ✅' like '✅ button 🙏😊 & Share it with your friends; thanks, and Trade safe.

Bitcoin (BTC/USD) Trade Setup: Potential Reversal & Target Proje200 EMA (Blue): 86,960.21
30 EMA (Red): 86,149.39
The price is currently below both EMAs, indicating a short-term bearish trend.
Key Levels:
Stop Loss: 83,954.20 (marked in blue at the bottom)
Re-entry Level: 86,198.54 (near the 30 EMA)
Target Price: 89,056.91
Support & Resistance Zones:
Strong Support Zone: Around 83,954.20
Intermediate Resistance: Near 86,198.54
Major Resistance Zone: Close to 89,056.91
Trade Setup & Projection:
The chart suggests a potential reversal from the support zone.
The expected price movement shows a bounce from support, a breakthrough of the intermediate resistance, and a push toward the target price (89,056.91).
The expected gain is 4,509.86 points (5.34%).
Conclusion:
If BTC holds the support zone, an upside move is likely.
Breaking above 86,198.54 would confirm a bullish reversal.
Failing to hold support at 83,954.20 could lead to further downside.

Bitcoin’s Next Challenge – Can BTC Break the Heavy Resistance?Bitcoin ( BINANCE:BTCUSDT ) started to rise from the Support zone($84,120_$81,500) as I expected in the previous post . The question is, can Bitcoin break the Heavy Resistance zone($93,300_$89,200) and Resistance lines ?
Please stay with me.
Bitcoin appears to have broken through the Resistance zone($87,100_$85,800) and is preparing for its first attack on the Heavy Resistance zone($93,300_$89,200) .
In terms of waves, Bitcoin appears to be completing microwave 4 of microwave C of the main wave Y . The waves structure inside the Ascending Channel appears to be of the Double Three Correction(WXY) .
I expect Bitcoin to prepare for its first attack on the Heavy Resistance zone($93,300_$89,200), the upper line of the ascending channel , the monthly pivot point , 50_SMA(Daily) , and the Resistance lines after completing the pullback to the Resistance zone($87,100_$85,800 ) and fill first CME Gap($86,640_$86,520) . I think the Potential Reversal Zone(PRZ) could be the zone to start a new decline for Bitcoin.
I chose the label of this analysis ''SHORT'' because I think Bitcoin is in a bit of a risky zone for a LONG position, what do you think?
Note: If Bitcoin goes over $91,000, we can expect more pumps.
Note: If Bitcoin falls below $85,200 before hitting the Heavy Resistance zone($93,300_$89,200), we can expect further declines.
Please respect each other's ideas and express them politely if you agree or disagree.
Bitcoin Analyze (BTCUSDT), 2-hour time frame.
Be sure to follow the updated ideas.
Do not forget to put a Stop loss for your positions (For every position you want to open).
Please follow your strategy and updates; this is just my Idea, and I will gladly see your ideas in this post.
Please do not forget the ✅' like '✅ button 🙏😊 & Share it with your friends; thanks, and Trade safe.

Bitcoin’s Next Move – Another Attack on Resistance zone?Bitcoin ( BINANCE:BTCUSDT ) fell to $83,400 as I expected in the previous analysis , the question is whether Bitcoin will continue to decline or not.
Please stay with me.
Bitcoin is moving in the Support zone($84,120_$81,500) and near the Support lines . The way Bitcoin has moved and decreased since yesterday until now has been such that it seems that Bitcoin can attack the Resistance zone($87,100_$85,800) at least once more.
In terms of Elliott Wave theory , given Bitcoin’s movements over the past few hours, it appears that Bitcoin is completing a microwave B of the main wave Y .
I expect Bitcoin to be able to attack the Resistance zone($87,100_$85,800) once again and if it breaks, I have marked the next targets on the chart .
Do you think Bitcoin can touch $90,000 again?
Note: If Bitcoin goes below $81,800, we can expect more dumps.
Please respect each other's ideas and express them politely if you agree or disagree.
Bitcoin Analyze (BTCUSDT), 2-hour time frame.
Be sure to follow the updated ideas.
Do not forget to put a Stop loss for your positions (For every position you want to open).
Please follow your strategy and updates; this is just my Idea, and I will gladly see your ideas in this post.
Please do not forget the ✅' like '✅ button 🙏😊 & Share it with your friends; thanks, and Trade safe.

Bitcoin at Key Resistance – Will Bears Take Control?Bitcoin ( BINANCE:BTCUSDT ) started to rise as I expected in the previous posts .
Bitcoin is moving near the Resistance zone($87,100_$85,800) , the upper line of the Ascending Channel , and the Time Reversal Zone(TRZ) .
In terms of Elliott Wave theory , Bitcoin appears to be completing microwave C of the main wave Y .
Also, we can see the Regular Divergence(RD-) between Consecutive Peaks .
I expect Bitcoin to start declining from the Resistance zone($87,100_$85,800) again, the first target could be $83,400 and the second target can be the CME Gap($80,760_$80,380) filling.
Note: If Bitcoin breaks the Resistance zone($87,100_$85,800) we can expect more pumps.
This analysis is in line with the following analysis that I shared with you on the weekly timeframe. 👇
Please respect each other's ideas and express them politely if you agree or disagree.
Bitcoin Analyze (BTCUSDT), 1-hour time frame.
Be sure to follow the updated ideas.
Do not forget to put a Stop loss for your positions (For every position you want to open).
Please follow your strategy and updates; this is just my Idea, and I will gladly see your ideas in this post.
Please do not forget the ✅' like '✅ button 🙏😊 & Share it with your friends; thanks, and Trade safe.
Bitcoin at the D-Point of a Bullish Gartley – What’s Next?Bitcoin ( BINANCE:BTCUSDT ) is currently trading near the Support zone($80,600_$79,000) and Potential Reversal Zone(PRZ) and Support line .
Bitcoin appears to be completing the Bullish Gartley Harmonic Pattern .
Educational Note : The Bullish Gartley is a harmonic pattern that signals a potential reversal in an uptrend after a corrective move. It consists of five points (X-A-B-C-D) and follows specific Fibonacci retracements, with the D-point acting as a key buying zone.
Regarding Elliott wave theory , Bitcoin is completing the microwave B of the main wave Y .
Also, we can see the Regular Divergence(RD+) between Consecutive Valleys .
I expect Bitcoin to rise at least to Cumulative Short Liquidation Leverage . If the Resistance zone($84,130_$81,500) is broken, we can expect further increases in Bitcoin .
Note: If Bitcoin breaks below the Support zone($80,600_$79,000), we can expect further declines.
Please respect each other's ideas and express them politely if you agree or disagree.
Bitcoin Analyze (BTCUSDT), 1-hour time frame.
Be sure to follow the updated ideas.
Do not forget to put a Stop loss for your positions (For every position you want to open).
Please follow your strategy and updates; this is just my Idea, and I will gladly see your ideas in this post.
Please do not forget the ✅' like '✅ button 🙏😊 & Share it with your friends; thanks, and Trade safe.

Inverse Head & Shoulders in Play – Bitcoin’s Bullish Setup!!!Bitcoin ( BINANCE:BTCUSDT ) touched $84,500 as I expected in my previous post (even higher).
Right now it seems like Bitcoin has managed to break the Resistance zone($84,130_$81,500) and the 200_SMA(Daily) . The formation of the classic pattern , the Inverse Head and Shoulders Pattern , could be a sign that Bitcoin is preparing to break the Resistance zone($84,130_$81,500) .
Another Classic Pattern that we can see on the one-hour Bitcoin chart and hope for an increase in Bitcoin is the Fan Principle at the Bottom Pattern .
Educational tip : The Fan Principle at the Bottom is a bullish reversal pattern where the price forms a series of downward trendline breaks, signaling weakening bearish momentum. As each trendline is broken, buying pressure increases, leading to a potential uptrend.
According to Elliott Wave theory , with the resistance zone broken, we can expect Bitcoin to enter the next impulsive wave , which will likely continue to at least $86,300 .
Also, Today's U.S. economic data release could significantly impact financial markets, including Bitcoin :
UoM Consumer Sentiment : 57.9 (Forecast: 63.1 | Previous: 64.7) – A sharp decline, indicating consumer pessimism about the economy.
UoM Inflation Expectations : 4.9% (Previous: 4.3%) – A worrying increase, which could push the Fed toward a more hawkish stance.
Declining consumer sentiment may pressure the Fed to adopt a more accommodative stance, which is positive for risk assets like Bitcoin.
Rising inflation expectations could increase demand for inflation-hedge assets like Bitcoin.
However, if the Fed sees inflation rising as a concern, they may maintain a tighter policy, which could weigh on markets.
Today's data presents mixed signals, but falling consumer confidence and rising inflation expectations could ultimately fuel Bitcoin's next leg up.
Based on the above explanation , I expect Bitcoin to rise to at least the upper resistance zone($87,000_$85,820) after completing its pullback and complete the mission of filling the CME Gap($86,400_$85,595) . Of course, a CME Gap($80,760_$80,380) has also formed.
In your opinion, has Bitcoin finished its correction or created an opportunity for us to escape again?
Note: If Bitcoin falls below $81,300, we should expect further declines.
Note: If Bitcoin goes above $87,800, we should expect further increases.
Please respect each other's ideas and express them politely if you agree or disagree.
Bitcoin Analyze (BTCUSDT), 1-hour time frame.
Be sure to follow the updated ideas.
Do not forget to put a Stop loss for your positions (For every position you want to open).
Please follow your strategy and updates; this is just my Idea, and I will gladly see your ideas in this post.
Please do not forget the ✅' like '✅ button 🙏😊 & Share it with your friends; thanks, and Trade safe.

Bitcoin under 40k? Possible, but is this also probable?In life, anything is possible , and when it comes to crypto, everything is possible .
But, as I mentioned in my educational post yesterday, there’s a big difference between what is possible and what is probable.
In this article, I want to analyze the possibility of Bitcoin dropping below $40,000 and more importantly, what would need to happen for this scenario to shift from just possible to truly probable.
________________________________________
BTC — From All-Time High to Distribution?
If we look at the Bitcoin chart, we notice that after the first all-time high very close to $100,000 at the end of November, the market began a consolidation phase.
Although we saw two more all-time highs — one around $108,000 in mid-December and another near $110,000 in January — the entire structure from late November to late February appears to be a distribution pattern rather than a healthy continuation.
Once Bitcoin broke below $90,000, we can consider this distribution phase complete, with a target for short positions around $75,000 — a level I’ve highlighted in my previous posts.
________________________________________
Long-Term Logarithmic Chart — Diminishing Returns and the Bigger Picture
Looking at the long-term logarithmic chart, we can see a clear pattern of diminishing returns:
• The first major leg up, starting in late 2011, was approximately 600x and lasted about two years, followed by a correction.
• The next leg was 100x, spanning four years, followed by another correction.
• Then, a 20x rally, which lasted just over a year.
• Finally, the most recent leg up has been around 7x.
What’s crucial here is that returns are decreasing and, even more importantly, the last leg up looks more like an ascending channel than a parabolic move like in previous cycles.
________________________________________
The Significance of the Ascending Channel
This ascending channel is not unusual — the market has matured, and big players are now involved, reducing volatility.
However, ascending channels on the long-term often signal potential reversals, rather than continuation.
________________________________________
What Would Make $40,000 Probable?
Now, let’s address the real question: What would need to happen for Bitcoin to drop to $40,000?
Zooming in on the logarithmic chart, it becomes evident that the $72,000 - $75,000 zone is a major support confluence.
If this area is broken — meaning a weekly candle closes below this level — the scenario of BTC dropping toward $40,000 becomes probable.
The target zone I’m watching in this case is $32,000 - $36,000, a strong historical support that is clearly visible on higher timeframes.
________________________________________
Conclusion — Watch the Key Levels, Not What you Hope
To conclude:
• Bitcoin dropping to those extreme levels is possible, but not yet probable.
• Probabilities will shift only if key support levels are broken — specifically $72k-$75k.
• The market has matured, cycles are changing, and returns are diminishing, so expecting a repeat of past parabolic runs may not be realistic.
• As traders and investors, we must focus on the charts and key levels, not on hopium and hype.

Bitcoin (BTC/USDT) – Potential Bullish BreakoutCurrent Market Overview:
Price: $83,295
24h Change: -1.24% (-$1,043.43)
Exchange: Binance (2-Day Timeframe)
Technical Breakdown:
Support Levels:
38.2% Fibonacci Retracement: ~$77,262 – This level has acted as a significant support area.
Trendline Support: Bitcoin is currently bouncing off a key ascending trendline that has been respected since mid-2023.
Major Fibonacci Support: Lower retracement levels at $67,346 (50%), $57,430 (61.8%), and $50,539 (70%) indicate potential deeper corrections if the trendline breaks.
Resistance Levels:
Key Resistance at $106,183 - $109,588: A breakout above this zone could trigger a rally toward new all-time highs.
Psychological Level at $100,000: A critical milestone for BTC that could act as temporary resistance.
Bullish Scenario:
If Bitcoin maintains support above the 38.2% Fibonacci retracement and trendline, a potential breakout above $109,588 could push prices toward $130,000.
The upward projection aligns with historical price action and Fibonacci extensions.
Bearish Scenario:
A break below $77,262 could lead to further downside, with possible retracements to $67,346 (50%) or lower levels like $50,539 (70%).
The long-term trendline breakdown would be a major bearish signal.
Conclusion & Strategy:
Short-Term: Look for confirmation of support at $77,262 before entering long positions.
Mid-Term: If BTC breaks $109,588 with volume confirmation, a bullish rally toward $130,000 is likely.
Risk Management: A drop below $77,000 could invalidate the bullish setup, prompting caution.
🚀 Bullish Outlook Above $109,588 | ⚠️ Caution Below $77,000

BTC/USDT#BTC's possible bottom is in.
- took support on a long-term weekly trendline.
-bounced off the 50-week Ema support.
-W.D. Gann's 14th march reversal date

Bullish Quasimodo in Play – Bitcoin’s Next Target: $84,500?Bitcoin ( BINANCE:BTCUSDT ) attacked the Resistance zone($84,130_$81,500) again as I expected yesterday . Has Bitcoin given up or is it gathering momentum to attack the resistance zone again? What do you think?
Bitcoin is moving near Yearly Pivot Point and Cumulative Long Liquidation Leverage($80,537_$78,390) .
From Elliott Wave theory , Bitcoin appears to be completing an Expanding Flat(ABC/5-3-5) corrective wave .
According to the Price Action , Bitcoin appears to be completing the Bullish Quasimodo Pattern .
Educational Note : The Bullish Quasimodo Pattern is a reversal pattern that signals a potential uptrend after a downtrend. It forms when the price creates a lower low followed by a higher high and a higher low, confirming a shift in market structure.
I expect Bitcoin will NOT leave the CME Gap($86,400_$84,650) unfilled and will rise to at least $84,500 .
What do you think, will Bitcoin leave this CME Gap($86,400_$84,650)?
Note: If Bitcoin falls below $78,800, we should expect further declines.
Please respect each other's ideas and express them politely if you agree or disagree.
Bitcoin Analyze (BTCUSDT), 1-hour time frame.
Be sure to follow the updated ideas.
Do not forget to put a Stop loss for your positions (For every position you want to open).
Please follow your strategy and updates; this is just my Idea, and I will gladly see your ideas in this post.
Please do not forget the ✅' like '✅ button 🙏😊 & Share it with your friends; thanks, and Trade safe.

Bitcoin Tests Resistance: Will the CME Gap Get Filled?Bitcoin ( BINANCE:BTCUSDT ) continued its downward trend as I expected in the previous post , but over the past 12 hours , Bitcoin has started to increase from Potential Reversal Zone(PRZ) . The question is whether this upward trend will continue in the past few hours or not !?
-------------------------------------------------------------------------
JOLTS Job Openings & Its Potential Impact on Bitcoin
The JOLTS Job Openings report will be released today, March 11 . It provides key insights into the U.S. labor market . This data can influence the Federal Reserve’s monetary policy stance , impacting risk assets like Bitcoin.
Potential Impact on Bitcoin :
Higher-than-expected job openings : Signals labor market strength, increasing the likelihood of Fed tightening → Bearish for Bitcoin
Lower-than-expected job openings : Suggests labor market weakness, increasing the odds of rate cuts → Bullish for Bitcoin
Historical Influence :
In previous months, JOLTS data has triggered volatility across financial markets, including crypto. For instance, a sharp decline in job openings last year led to a weaker dollar and Bitcoin rally. Conversely, stronger-than-expected job numbers have reinforced hawkish Fed expectations, pressuring Bitcoin.
I believe there's a higher probability that the JOLTS report will come in weaker than expected, which could lead to a short-term rally in Bitcoin and gold. However, if the report is stronger than anticipated, we might see temporary selling pressure in the market. What is your idea!?
Today's positive news was " Trump Plans Order to End Crypto Banking Restrictions ". In general, Trump's statements no longer affect the crypto market as much as before. Do you agree with me?
-------------------------------------------------------------------------
Now let's take a look at the Bitcoin chart on the 1-hour timeframe and use technical analysis tools .
Bitcoin is moving in the Resistance zone($84,130_$81,500) and near the 200_SMA(Daily) .
According to Elliott Wave theory , Bitcoin has completed five down waves , and we should wait for the next up waves . One of the signs of the end of wave 5 is the presence of a Regular Divergence (RD+) between two consecutive valleys .
According to the above explanation , I expect Bitcoin to re-attack the Resistance zone($84,130_$81,500) after a downward correction and attempt to fill the CME Gap($86,400_$84,200) .
Note: If Bitcoin can move above $87,200, we can expect the start of an uptrend.
Note: We should expect a bigger drop if Bitcoin falls below $72,000.
Please respect each other's ideas and express them politely if you agree or disagree.
Bitcoin Analyze (BTCUSDT), 1-hour time frame.
Be sure to follow the updated ideas.
Do not forget to put a Stop loss for your positions (For every position you want to open).
Please follow your strategy and updates; this is just my Idea, and I will gladly see your ideas in this post.
Please do not forget the ✅' like '✅ button 🙏😊 & Share it with your friends; thanks, and Trade safe.

Bitcoin / TetherUSHello dear traders,
Here’s the latest update on the Bitcoin chart along with potential reversal points and zones. If there are any changes this week, I will update the chart again and present it to you.
Market Status
Currently, we are in a daily descending channel, and the low point is below our expectations.
Key Points for Analysis
Exit Points for Trades or Short Positions (4-Hour):
Resistance: 86,897.25
Daily Liquidity: 102,500.01
Ideal Time to Sell with Confirmation: 105,250
These resistance points provide us with the best selling opportunities, but it's essential to pay attention to the necessary confirmations. A candlestick pattern is one of the best confirmations to consider.
Order Flow (4-Hour): 71,632.95 and 66,835
This temporary buying zone can offer a good profit opportunity during this downturn and is suitable for short-term buying.
Daily Support: 69,388.62
If we receive confirmation, this level will serve as a strong support.
This analysis has been drawn up simply and clearly for your convenience, dear followers.
Wishing you all success!
Fereydoon Bahrami
A retail trader in the Wall Street Trading Center (Forex)
Risk Disclosure:
Trading in the cryptocurrency market is risky due to high price volatility. This analysis is solely my personal opinion and should not be considered financial advice. Please do your own research. You are responsible for any profits or losses resulting from this analysis.

Powell’s Speech & Bitcoin’s Decline: Is More Downside Ahead? Today, Fed Chair Jerome Powell is set to speak, and traders should brace for potential market volatility! Given the recent economic data , his tone is likely to be balanced but leaning hawkish .
Why a More Hawkish Powell?
1- Strong Job Market :
Unemployment Rate : 4.1% (Still low)
Non-Farm Payrolls (NFP) : 151K (Decent, but lower than before)
Average Hourly Earnings : 0.3% (Steady wage growth)
This suggests that the labor market remains resilient, which might discourage the Fed from cutting rates too soon.
2- Inflation Still a Concern :
Wage growth and inflationary pressures persist, which means Powell may emphasize keeping rates steady longer to combat inflation.
3- Markets Are Too Optimistic on Rate Cuts :
Investors are heavily betting on rate cuts in 2024, but Powell may push back against these expectations to prevent excessive risk-taking.
Powell will likely maintain a cautious yet hawkish stance to manage expectations. Big price swings are expected across forex, crypto, and commodities—so stay alert! (Of course, this is just a personal analysis).
In addition to Donald Trump , Signs Executive Order to Create Bitcoin Strategic Reserve
Of course, today, we didn't see any strange movement in Bitcoin, and probably, the proverb " buy the rumor, sell the news " was fulfilled.
----------------------------------------------------------
Now let's take a look at the Bitcoin chart on the 1-hour time frame and also take help from technical analysis tools .
Bitcoin ( BINANCE:BTCUSDT ) is in a Heavy Resistance zone($93,300_$89,250) and has started to decline from Potential Reversal Zone(PRZ) .
From a Classic Technical Analysis , Bitcoin appears to move in a Symmetrical Triangle .
According to Elliott Wave theory , Bitcoin has completed the Double Three Correction(WXY) , and we should wait for the next bearish wave .
I expect Bitcoin to attack 200_SMA(Daily) again after breaking the lower line of the Symmetrical Triangle .
Note: Bitcoin is likely to pump more if the symmetrical triangle's upper line breaks.
Please respect each other's ideas and express them politely if you agree or disagree.
Bitcoin Analyze (BTCUSDT), 1-hour time frame.
Be sure to follow the updated ideas.
Do not forget to put a Stop loss for your positions (For every position you want to open).
Please follow your strategy and updates; this is just my Idea, and I will gladly see your ideas in this post.
Please do not forget the ✅' like '✅ button 🙏😊 & Share it with your friends; thanks, and Trade safe.

Bitcoin’s Roller Coaster Ride: More Volatility Until March 7?Bitcoin ( BINANCE:BTCUSDT ) has been acting like a Roller Coaster in the last few days, and one of the main reasons for the high momentum movements is Donald Trump's speech . Generally, this market behavior detriments investors and trades. Such movements may continue until March 7 ( Let us recall that Donald Trump will meet with industry representatives at the “first crypto summit” at the White House on March 7 ).
So please pay more attention to Capital Management these days .
It seems that Bitcoin's Main Support is 200_SMA(Daily) , which failed to break yesterday and started to increase again. Now, Bitcoin has succeeded in breaking the Resistance zone($87,100-$85,800) .
According to Elliott wave theory , Bitcoin seems to be completing a Zigzag Correction(ABC/5-3-5) .
I expect Bitcoin to once again attack the Heavy Resistance zone($93,300_$89,250) and rise to at least the Potential Reversal Zone(PRZ) .
Do you think Bitcoin is still Correcting or ready for another major up move?
Note: If Bitcoin falls below $85,000, the possibility of Bitcoin increasing again will decrease.
Note: If Bitcoin can break the Heavy Resistance zone($93,300_$89,250) and the Resistance lines, we can even hope for a new All-Time High(ATH).
Please respect each other's ideas and express them politely if you agree or disagree.
Bitcoin Analyze (BTCUSDT), 1-hour time frame.
Be sure to follow the updated ideas.
Do not forget to put a Stop loss for your positions (For every position you want to open).
Please follow your strategy and updates; this is just my Idea, and I will gladly see your ideas in this post.
Please do not forget the ✅' like '✅ button 🙏😊 & Share it with your friends; thanks, and Trade safe.

Why I shorted BTC?In last weekend’s crypto analyses, I mentioned that many altcoins were in a support zone, with a strong chance of a reversal from that level.
Shortly after I published my analyses, the announcement regarding the federal crypto reserve was released, triggering a massive pump.
However, this surge was short-lived, and prices quickly retraced back to their initial levels. For me, this is not a good sign—when major positive news fails to sustain gains, it often signals weakness in the market.
Now, regarding Bitcoin: although its price remains above the announcement level, it has struggled to hold gains above the 91K support level and continues to break below it.
I don’t believe prices are dropping just to set up a massive bull run for everyone to buy in—this looks like a bearish signal to me.
As a result, I have shorted BTC and expect a decline to 75K. That said, with my stop-loss placed above the initial pump’s high, I’m currently running a 1:3 risk-reward ratio, which—regardless of the outcome—is ideal in my book.

$BTC Daily UpdateCRYPTOCAP:BTC #BTC $92,786 resistance approaching, $91,375 support currently in effect, $86,305 key support from here, possible sign of reversal on 1D with RSI and MACD confirmation, can retake $94,148 support this week if no further manipulation changes it's course. Current Weekly and Previous one both looking bullish showcasing strength of the Bulls, expect resistance at $94,148-$95,878, next key support range at $80,582-$78,034.

Bitcoin & Trump Effect: A Short-Term Pump or Sustainable Rally?Bitcoin ( CRYPTO:BTCUSD ) started to rise as I expected in the previous post , but Donald Trump helped double the momentum of Bitcoin yesterday. But the question here is whether the correction of Bitcoin is over or if this is an increase in the chance of exit.
Bitcoin is trying to break the Heavy Resistance zone($93,300_$89,250) .
According to the theory of Elliott waves , it seems that Bitcoin has succeeded in completing wave 4 and we should wait for wave 5 .
Note : Due to the high momentum of wave 3, it is possible that wave 5 is a truncated wave.
I expect Bitcoin to rise to at least $95,000 in the coming hours. The next target of Bitcoin can be Resistance lines and 100_SMA(Daily) .
What do you think about Bitcoin movement? Time to escape or wait for a new All-Time High(ATH) to be created?
Note: If Bitcoin goes below $89,000, we can expect Bitcoin to decline and the big CME Gap($91,610-$84,830) to be filled.
Please respect each other's ideas and express them politely if you agree or disagree.
Bitcoin Analyze (BTCUSDT), 1-hour time frame.
B e sure to follow the updated ideas.
Do not forget to put a Stop loss for your positions (For every position you want to open).
Please follow your strategy and updates; this is just my Idea, and I will gladly see your ideas in this post.
Please do not forget the ✅' like '✅ button 🙏😊 & Share it with your friends; thanks, and Trade safe.

Bitcoin Roadmap: Breaking the Broadening Wedge – A Buy Signal?After the tariffs that Donald Trump approved for the European Union and China , Bitcoin ( BINANCE:BTCUSDT ) received a shock with each approval. Otherwise, Bitcoin should have returned to the upward trend, at least in the short term.
Bitcoin seems to have failed to break 200_SMA(Daily) , and most of the time the invalid break is accompanied by the opposite movement of that break with high momentum. Also, Bitcoin seems to have broken the Resistance zone($83,530_$82,250) and is pulling back to this zone .
In terms of Classic Technical Analysis , it seems that Bitcoin has succeeded in completing the Descending Broadening Wedge Pattern .
According to the theory of Elliott waves , Bitcoin seems to have completed five downward waves and we should expect Bitcoin to rise .
Also, we can see the Regular Divergence(RD+) between Consecutive Valleys .
I expect Bitcoin to rise AFTER breaking the upper line of the Descending Broadening Wedge Pattern up to the targets I specified on the chart.
Do you think Bitcoin correction is over?
Note: If Bitcoin goes below the 200_SMA(Daily), expect more dumps.
Please respect each other's ideas and express them politely if you agree or disagree.
Bitcoin Analyze (BTCUSDT), 1-hour time frame.
Be sure to follow the updated ideas.
Do not forget to put a Stop loss for your positions (For every position you want to open).
Please follow your strategy and updates; this is just my Idea, and I will gladly see your ideas in this post.
Please do not forget the ✅' like '✅ button 🙏😊 & Share it with your friends; thanks, and Trade safe.
