BITCOIN PREDICTION: SECRET PATTERN FORMING!!! (scary) Yello Paradisers! In this video, I have been analyzing Bitcoin for you on multiple time frames because we are doing professional trading analysis. On the ultra-high timeframe chart, I have been showing you the ABC corrective mode wave formation that we are doing right now and the next targets from an ultra-high timeframe perspective. Thanks to this, we can better understand the context of the overall market and make better trading ideas on lower timeframes.
On the high timeframe chart, I'm sharing with you that the zigzag of that ultra high timeframe degree B wave was, with the highest probability, finished. We are right now working on the first wave from a lower degree. I'm sharing with you also the bullish divergence.
On the medium timeframe chart, I'm putting your focus on the volume, which is dropping with the price rising. This is usually a sign of bulls being weak. Confluence this with being at resistance; it's usually a recipe for a reversal.We are also seeing two bearish divergences, which need to be confirmed, but the medium time frame is kind of bearish.
On the lower timeframe chart, I'm revealing to you the secret pattern formation: the ending diagonal. The Fibonacci sequence levels are sharing with you all the supports and resistances. I forgot to show you the confirmed bearish cross, but that's okay because the ending diagonal itself is revealing to us the next highest probability movement of Bitcoin.
Paradisers! Keep in mind to trade only with a proper professional trading strategy. Wait for confirmations. Play with tactics. This is the only way you can be long-term profitable.
Remember, don’t trade without confirmations. Wait for them before creating a trade. Be disciplined, patient, and emotionally controlled. Only trade the highest probability setups with the greatest risk to reward ratio. This will ensure that you become a long-term profitable professional trader.
Don't be a gambler. Don't try to get rich quick. Make sure that your trading is professionally based on proper strategies and trade tactics.
Btctrade

Bitcoin Analysis: Bitcoin Will Continue to RallyBitcoin began rebounding after confirming support near 107,200 on August 29th and 30th. After several days of volatile gains, it has now stabilized above 110,000. Resistance at 113,500, the highest point on August 28th, saw further declines yesterday. Short-term double top pressure exists, but as long as it stabilizes at 110,000, bullish momentum persists. Looking at the 4-hour chart, the current upward trend remains intact. In terms of short-term trends, I personally believe Bitcoin will continue to rebound, at least breaking through 113,500. Of course, this level is unlikely due to the relatively quiet weekend trading. A breakout is possible next week. Let's wait and see.
Bitcoin Strategy
For Bitcoin: Previously, below 110,000, there were consistent signals for opening long positions to ambush bullish sentiment. Any price below this level presents a good opportunity to open long positions. The market has rebounded to the resistance level, but I think it will continue to rebound after a slight correction. If the price pulls back to 110500, 110000, or 109500, you can consider opening a long position. The target is 112700.

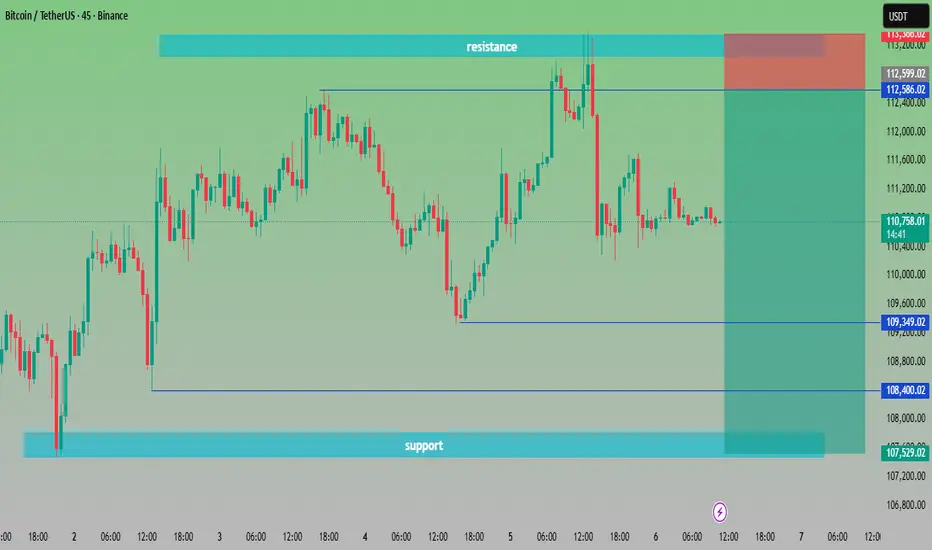
“BTC/USDT at Crossroads Key Levels to Watch🔎 Chart Analysis – BTC/USDT (45m)
Resistance Zone: Around 112,586 – 113,200 USDT. Price has tested this area multiple times but failed to break out, confirming strong selling pressure.
Support Zone: Around 107,529 – 108,400 USDT. Buyers have consistently defended this zone, making it a key demand area.
Current Price: 110,720 USDT, sitting in the middle of support and resistance.
📌 Scenarios:
Bullish Case 🟢🚀 – If BTC breaks above 112,586 USDT, momentum could push toward 113,500+ USDT.
Bearish Case 🔴📉 – If BTC fails to hold 109,349 USDT, price may retest the deeper support around 107,500 USDT.
⚖️ Trading Plan Idea:
Long Entry: Above 112,600 breakout ✅
Short Entry: Below 109,300 breakdown ❌
Target Zones:
Upside 🎯 → 113,500+
Downside 🎯 → 107,500

Bitcoin Daily SMA update- trend line tested and heldThis chart uses the SMA, Simple Moving Average
Red = 50, Blue = 100, Green = 128, Yellow = 200
As expected, PA came down and tested the trend line that has rejected PA since 13 August and has since bounced back up.
We will have to wait and see but this may have created a Higher Low as PA rose and now sits on the 100 as support.
Should PA continue to rise from here, the 50 SMA at 113254 is the line of resistance we Need to cross and test. This would then give is a Higher High.
After that, the next Higher High will be at a price after 119
Should PA get rejected, the 128 SMA is at 108995 and then the previous Low is at 107165
The Daily MACD seems to have Crossed above its signal line
This is "only Just " and so we wait to see where it goes form here but we are certainly looking Bullish in a longer term as Bulls show us they can respond.
The 4 hour BTC PA chart
This chart makes me a little cautious for now, waiting for confirmation of this move higher,
See how that 2nd Green candle after the bounce, came up and got rejected off the 100 SMA and the current candle is having the same problem.
We do seem to have support on the 50 SMA
PA is currently in a tight range above, with the SMA's very tight.
It is easier for PA to Drop from here so today could be a battle.
The 4 hour MACD is also at a point of crossing
The MACD here has NOT yet crossed the signal line and so we wait, watching to see what happens.
The Histogram shows positive momentum.
It should be remembered that we have the USA calling the possibility of Rate cuts this month.
If the FED goes against the grain, this could be damaging and should the FED decide to cut rates, we are off to the races.
This month is Pivotal.
Long term still Bullish, short term undecided..remaining Bullish CAUTIOUS

Bitcoin at Decision Point: Will BTC Break 112K?Bitcoin remains range-bound on the 4-hour chart. The bullish case depends on holding support near 110,920 and eventually reclaiming resistance around 112,170 to open the path higher toward 114,200 and beyond. On the downside, losing 110,920 would shift focus to the 109,800–108,600 area, and a break below there could expose deeper supports near 105,300–104,800.
The main bias is still for more upside, but confidence comes only if resistance is reclaimed and momentum shifts back in favor of the bulls.

BITCOIN PREDICTION: WHY IS NOBODY TALKING ABOUT THIS!!?(warning)Yello Paradisers! In this video, we are again, as professional traders, analyzing the multi-time frame context of the market. On an ultra-high time frame, we are seeing the medium moving average touch. We are also discussing the possible channel retest, plus I'm sharing with you the bearish cross and bearish divergence.
On the high time frame chart, we are having the zigzag finished, probably with the highest probability. The first ultra-high time frame wave is starting, that is the question of this video, which we are answering, and we are seeing the bullish divergence.
On the medium timeframe, we are seeing that as we are touching the resistance, the volume is dropping, which is a bearish sign. We are seeing two bearish divergences on RSI and MACD histogram, and with the highest probability, we are finishing the first wave.
On the low timeframe chart, I'm discussing the ending diagonal with you, and I forgot to tell you about this, but we are also having a bearish cross there.
Paradisers! Keep in mind to trade only with a proper professional trading strategy. Wait for confirmations. Play with tactics. This is the only way you can be long-term profitable.
Remember, don’t trade without confirmations. Wait for them before creating a trade. Be disciplined, patient, and emotionally controlled. Only trade the highest probability setups with the greatest risk to reward ratio. This will ensure that you become a long-term profitable professional trader.
Don't be a gambler. Don't try to get rich quick. Make sure that your trading is professionally based on proper strategies and trade tactics.

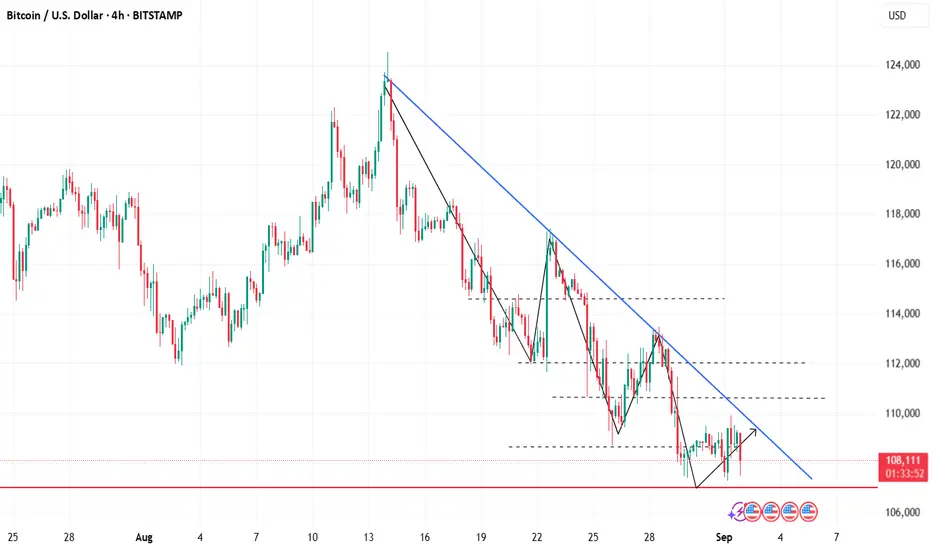
Has Bitcoin's long-short trend reversed?Recently, Bitcoin has demonstrated strong resilience at the key support level of 107,000: this level has undergone multiple downward tests, with no effective breakdown occurring; instead, it has rebounded quickly after each touch, confirming the market recognition of this support zone and the strength of buying interest. As the bottom support is confirmed, the price momentum has gradually strengthened and has now successfully broken through the previous resistance level on the 4-hour timeframe. Technically, a bullish structure of "valid support - broken resistance" has been formed, and the short-term trend has shifted from consolidation to a bullish bias. Based on this market change, our trading strategy needs to be adjusted accordingly: we can take a small-position long trade when the price retraces to the support level.

Btc looks bearish Bitcoin bears were successful in forming a new lower high during this small time frame down trend. If we do not close above 110k bitcoin will remain bearish.
Next support :- 105k and 100k

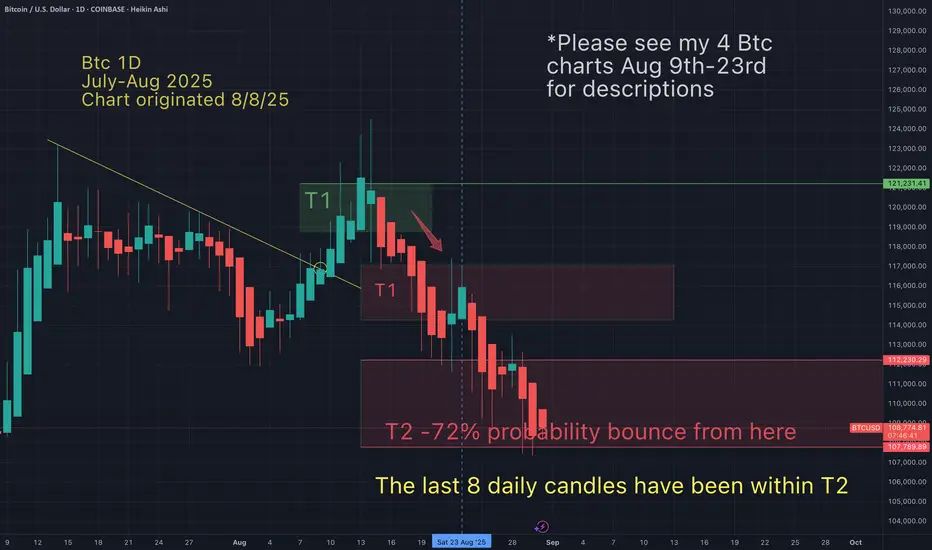
Btc bottoming - See my short term bounce targetI have been anticipating a Btc local bottom as low as 108K since Aug 9th. It was a high probability call, because it's what Btc always does! Follow the patterns...
Now that my T2 has been hit, I anticpate a bounce into my high probability range as seen in the above chart. I will be monitoring price action very closely to see if either of the other 2 higher targets are possible before my anticipated reversal. I will be taking profit at the top of this bounce.
There is a possibility, based on the 3 week down rule, that the reversal (from my targets) may lead to a lower low to my T3 (below current low at 107.5K). This may happen as soon as late Sept- Oct. I hope I'm wrong about that.
May the trends be with you.

BTC/USD Technical AnalysisHello guys!
The price has broken through the last resistance level and is currently forming a Head and Shoulders (H&S) pattern. At this stage, it's unclear whether we’re seeing a reversal H&S or a continuation H&S. Here’s how to play it:
1️⃣ If the neckline breaks upwards, consider going long with a target toward the pink resistance zone. This area is key for shorts, so be prepared to flip your position here!
2️⃣ If the neckline holds as resistance, look for short opportunities targeting:
$106,460
$105,250
💡 My strategy:
Open half your short position now. If price moves toward the pink zone, add more shorts there for a stronger position.
⚠️ Caution: Always keep an eye on the neckline, it will determine whether we go bullish or bearish from here!

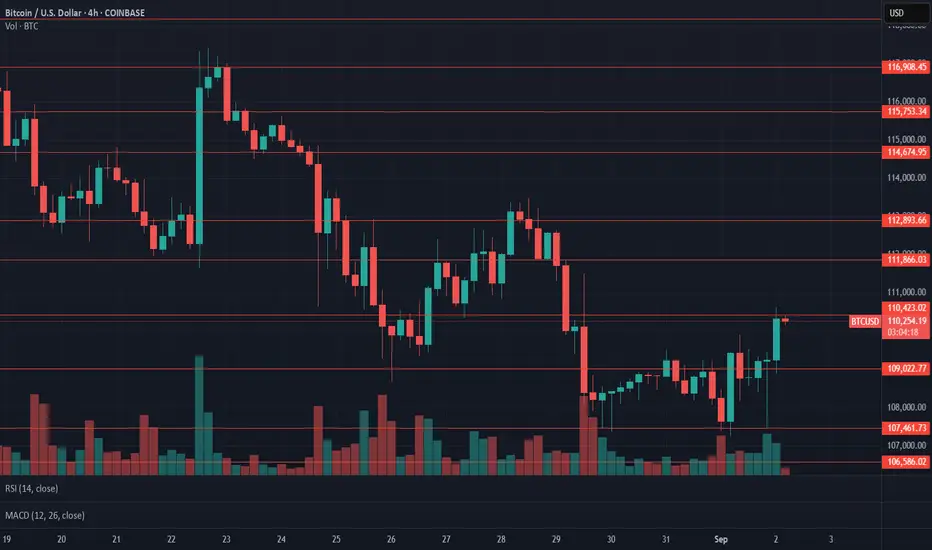
$BTC Daily UpdateCRYPTOCAP:BTC #BTC Very good bullish pin bar on 4h off of $107,461 support, put bullish engulfing following it. $110,423 resistance being tested, $109,022 support in effect and tested, Bullish engulfing on previous daily close too, time to see if it can follow thru. Decline in volume on last 4h close, weakening climb, we gonna be here for a while, support at $107,461 to watch with resistance remaining at $110,423 and key resistance at $115,753.
Lock in profits and go with the trend.As previously analyzed and predicted, Bitcoin has started a pullback as expected after hitting the key resistance level on the 4-hour chart. Looking at the current market, the price has broken below the support of the short-term 5-day moving average, with a MACD death cross signal appearing on the hourly chart. Bearish momentum has initially been released, and the short-term downward trend has become relatively clear.
Friends who entered positions earlier can appropriately reduce some holdings to lock in profits. If the price breaks below 107,000 later, you can continue to enter short positions after a rebound.
In a range-bound market, the main strategy is to short at highs.The recent movement of Bitcoin has once again validated the predictive logic put forward last week. It was previously clearly stated that "after price retests the lower support level, there may be a minor rebound" – and the current market is unfolding exactly as this rhythm suggests: after touching the key support zone, the price has indeed rebounded, but judging from the chart performance, the rebound momentum is noticeably weak.
Regarding the subsequent operation direction, before the rebound can break through the key resistance level on the 4-hour timeframe, the overall trading strategy should still focus on "shorting at highs". Pay attention to the resistance level around 110,000 on the upside, and the recent low around 107,000 on the downside.

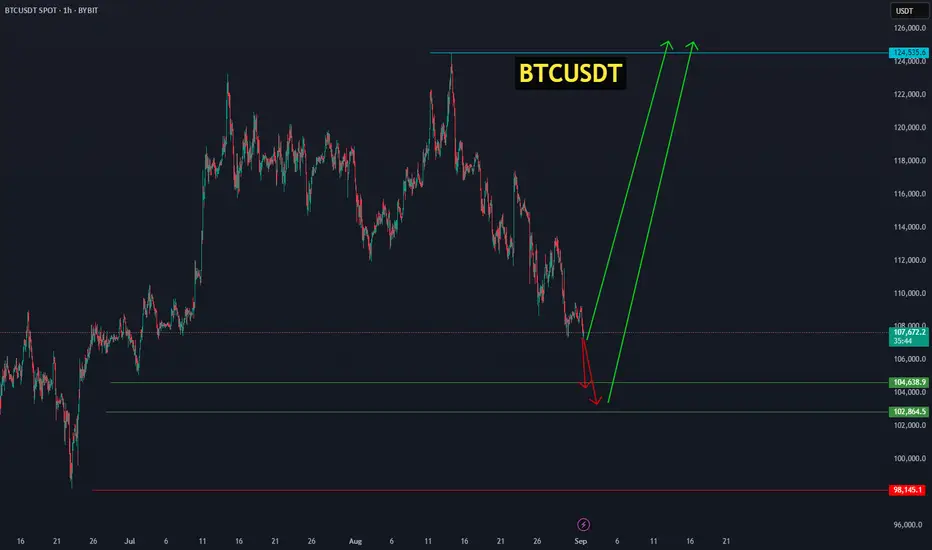
Bitcoin from the 102,864 zone is set to ignite its next bullish Bitcoin will either start its upward move from the current price or from the range of 104,638.9 – 102,864.5, aiming for targets between 118,000 and 124,535. BINANCE:BTCUSDT
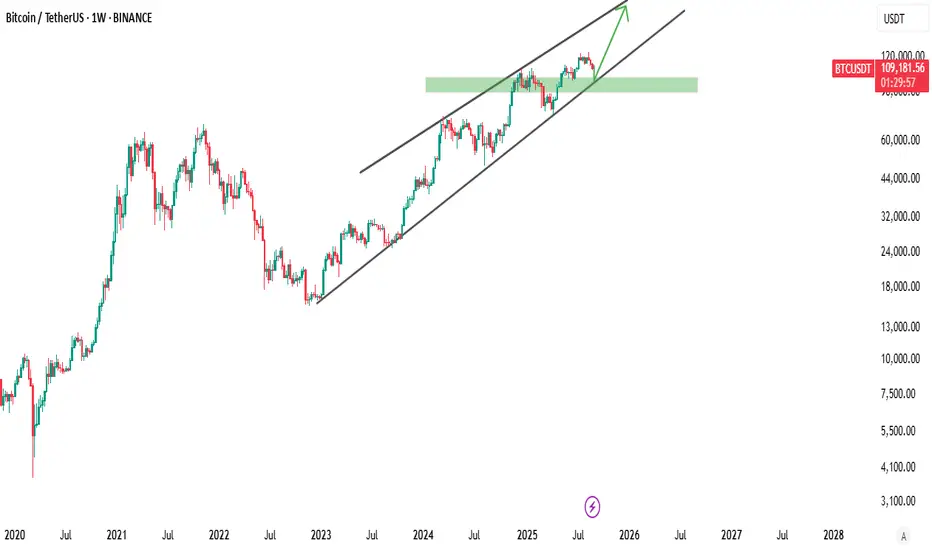
Bitcoin (BTCUSDT) Weekly Outlook – Still in the Uptrend ChannelHello Traders! 👋
Bitcoin is currently trading around $109,200, showing a slight pullback after its strong bullish rally. On the weekly chart, BTC continues to respect the ascending channel, and the green support zone is acting as a key demand area.
🔑 Key Levels & Structure
Support Zone (Buyers’ Area): $105,000 – $110,000
Channel Support: Lower black trendline (dynamic support)
Upside Target: $120,000+ if the channel holds
Invalidation: A weekly close below $105,000 may shift momentum bearish
📊 Market Insight
Bitcoin is consolidating near the middle of the channel after hitting resistance at the upper band.
If buyers defend the green demand zone, BTC could rebound strongly toward the upper channel line, potentially breaking $120K in the coming weeks.
On the other hand, if price breaks below $105K, we could see a correction toward the $95K – $100K area before bulls re-enter.
📈 Strategy Idea
Bullish Bias: Look for long setups if BTC shows bullish reversal candles near $105K – $110K.
Target: $120K – $125K (upper channel).
Risk Management: Keep stops below $105K for safer entries.
🔥 Bitcoin’s long-term uptrend remains intact, but short-term volatility will test trader patience.
💬 What’s your BTC target before the next halving? Do you see $120K soon or a deeper correction first?
Drop your thoughts in the comments ⬇️, and don’t forget to hit 👍 if you found this analysis useful!
Btc price action unfolds exactly as anticipated-Bounce incoming?On Aug 9th I suggested the following:
As of today Btc has been bottoming at my T2 after following the anticipated price action suggested in the above chart. TA works!
May the trends be with you.
BTC price analysis for SeptemberWith ICC we read what price is telling us and we act accordingly.
After the ranging sideways zone, price has given the bearish indication, went up to take the shorts above 122k then pushed back down.
The trend is still bearish, 1h,4h and Daily both MACD and RSI are still bearish.
The support from 105k to 106k has held price before so it could be where BTC reverses and strong buys will step in OR it fails to hold and we head further down. We don't try to predict.

BTC on the beat :))))everything has gone according to analysis. I hope you have enjoyed the sell positions. Make sure to save profit and manage your positions or make them risk free.

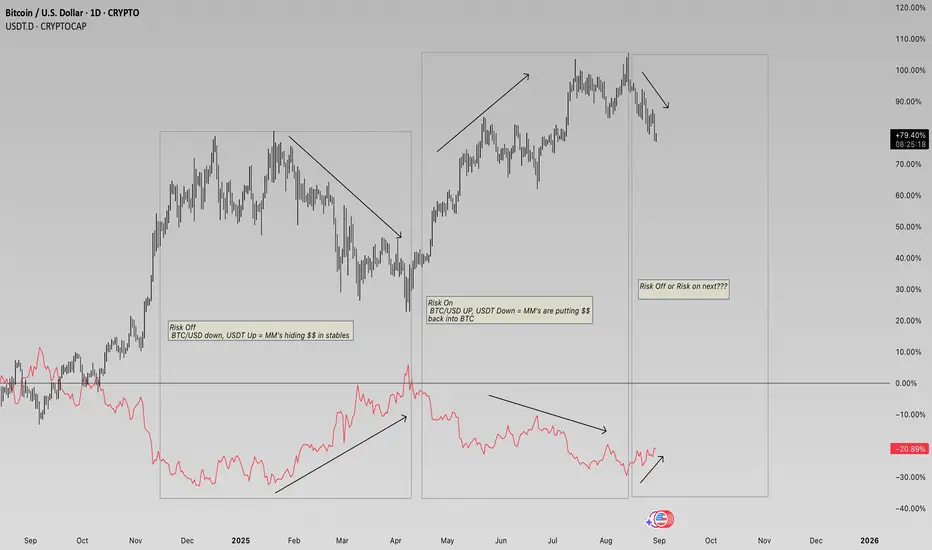
Study Correlation #BitcoinWhen BTC/USD is rising and USDT.D falls, that often signals risk-on behavior, as MM's are moving from stablecoins into Bitcoin.When BTC/USD falls and USDT.D rises, that signals risk-off, as people moving into stablecoins.
BTCUSDT IS JUST ACTING THE WAY IT SHOULD.Most Traders don't understand basic Trading Principles. I have been trading Crypto since 2015- 10 good years but what I have realised is most people get the basics wrong.
I have been asked countless times in the past month that BTC is becoming unpredictable, it's a gamble, it's manipulated.
T he Trendline says it all. Not only for this top, but all the previous tops.
Guys maybe it's time to brush up the basics. I have developed proprietary Algorithms for HFTs, Trading desks that deal with Millions in volume every single day but never have I ever stopped looking at the basics. Price is everything guys.
I am always here for any genuine questions. You can comment or message me.

BTCUSD Short Opportunity, Bears Take Control BTCUSD is currently trading around 116,980, facing strong rejection near the 117,200–117,500 resistance zone. The recent price action suggests that sellers are gaining control as bullish momentum fades. A sustained move below 116,800 could trigger further downside pressure, pushing Bitcoin toward 115,500 and 114,800 in the short term. If the bearish structure remains intact, the next major target lies near the psychological level of 110,000, which aligns with previous demand zones and a key Fibonacci retracement level. Stop-loss should ideally be placed above 117,600 to protect against any false breakouts. Watch for increased volatility during US trading hours and upcoming macroeconomic data releases, as these could accelerate the move. Overall bias remains strongly bearish as long as BTC trades below 117,500.

BITCOIN PREDICTION: CRASH WILL STOP HERE!!!? (nobody watching) Yello Paradisers! In this video, I'm sharing with you the ultra-line time frame perspective. We are analyzing the channel and the Elliott Wave Theory on a high time frame chart. I'm sharing with you how the ABC correction is finished. We are going through the Bitcoin CME futures gap or medium time frame. I'm sharing with you the Fibonacci time zone, the Elliott Wave count, and the confirmations we are waiting for to start in your positions.
Paradisers! Keep in mind to trade only with a proper professional trading strategy. Wait for confirmations. Play with tactics. This is the only way you can be long-term profitable.
Remember, don’t trade without confirmations. Wait for them before creating a trade. Be disciplined, patient, and emotionally controlled. Only trade the highest probability setups with the greatest risk to reward ratio. This will ensure that you become a long-term profitable professional trader.
Don't be a gambler. Don't try to get rich quick. Make sure that your trading is professionally based on proper strategies and trade tactics.
