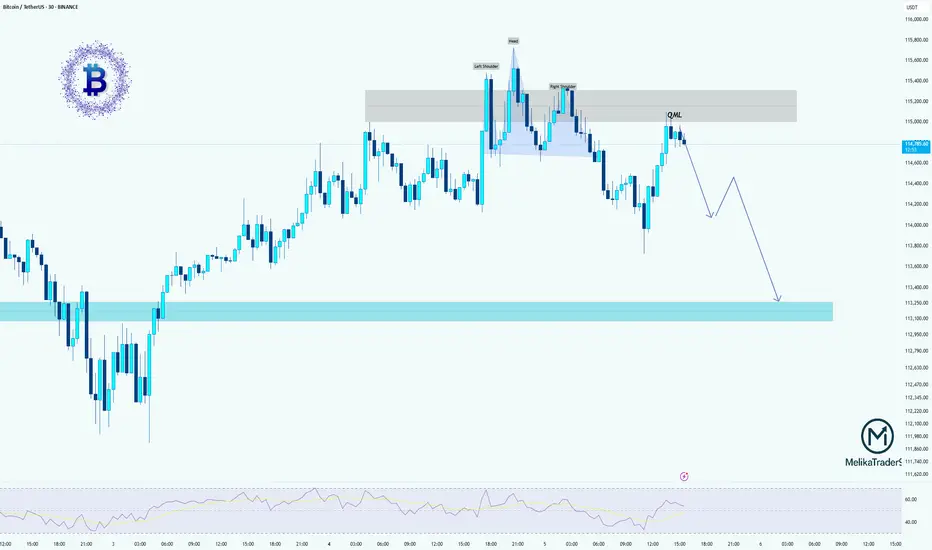
BTCUSDT: Head & Shoulders + QML SetupHello guys!
We have a clean Head & Shoulders pattern forming near a supply zone, with a nice QML (Quasimodo Level) rejection confirming the bearish bias. Price is struggling to break above 115K and has already reacted to the QML zone.
If this structure holds, we could see BTC start a new bearish leg 📉, first targeting 114K, and eventually reaching the demand zone around 112.8K–113.2K.
Watch for further confirmation with lower highs forming.
Btcusdanalysis
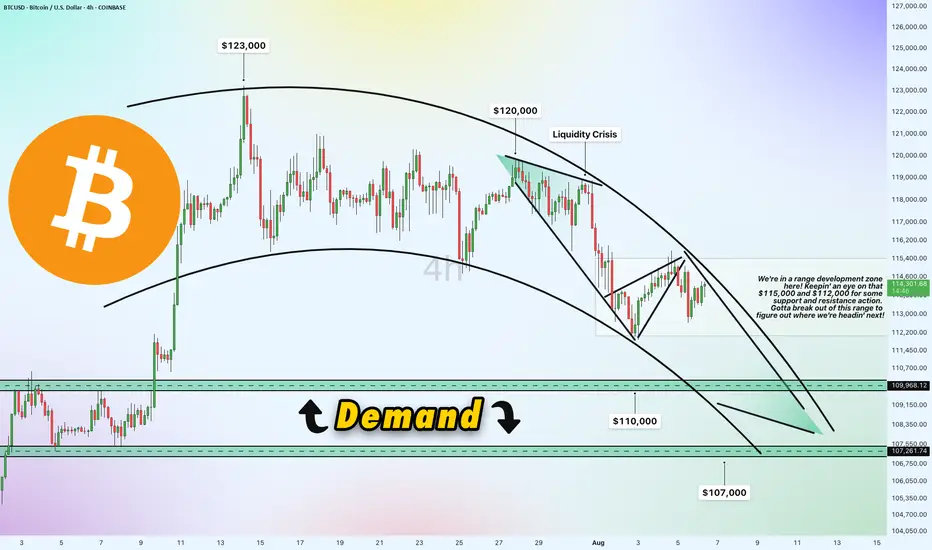
Bitcoin 4h Chart Update [Tight Range / Breakout Opportunities]Breakout Opportunities
We're in a range development zone here! The chart shows Bitcoin (BTC/USD) trading within a tight range, with key levels at $115,000 and $112,000 acting as critical support and resistance zones. The price recently peaked near $123,000 but has since pulled back, forming a liquidity crisis zone around $120,000 where selling pressure kicked in. A breakout above $115,000 could signal a move toward $120,000 or higher, while a drop below $112,000 might push it toward the demand zone. Gotta break out of this range to figure out where we're headin' next!
Demand Zone
$110,000 & $107,000
Price slipped down from $120,000 due to a lack of buying liquidity, potentially it will land into a demand zone between $110,000 and $107,000. This area could act as a strong support level where buyers might step in. If the price holds here, it could bounce back toward the $112,000-$115,000 range. However, a failure to hold this zone might see it test lower support around $107,000 or even $105,000.
Direction and Possible Ranges
Upward Potential: If Bitcoin breaks above $115,000 with strong volume, the next targets could be $120,000 (liquidity crisis zone) and potentially $123,000, aligning with recent highs. A sustained move above $120,000 might open the door to $125,000 or beyond.
Downward Risk: Should the price fail to hold above $112,000 and break below, it could slide into the demand zone ($110,000-$107,000). Further weakness might push it toward $105,000, a psychological and technical support level.
Current Trend: The chart shows a descending trendline from the $123,000 peak, suggesting bearish pressure unless a decisive breakout occurs. The 4-hour timeframe indicates indecision, with the range-bound action hinting at a potential volatile move once direction is confirmed.
Keep an eye on these levels for the next big move!
$BTC bouncing over crucial support!CRYPTOCAP:BTC is currently pulling back from the $123K resistance area, heading toward a major confluence support zone between $107K–$110K, which aligns with:
✅ Previous breakout zone
✅ 0.5–0.618 Fibonacci retracement
✅ Lower bound of the ascending channel
✅ 200 EMA support
This level is expected to attract buyers and act as a strong base for the next bullish leg.
Price dips into the $107K–$110K support
Look for a bullish reversal (reaction candles or bullish divergence)
Target 1: $128K – retest of resistance
Target 2: $132K – upper boundary of the ascending channel
CRYPTOCAP:BTC remains within a healthy bullish structure.
This pullback is constructive, not bearish.
The $108K–$110K zone is a high-probability long setup — wait for bullish confirmation before entering.
A daily close below $106.8K would invalidate the structure and open up downside risk.

BITCOIN PREDICTION: a SECRET PATTERN is FORMING (watch out)!!!Yello paradisers! In this Bitcoin prediction, I'm updating you about the crash we predicted earlier in previous videos. I'm showing you on a high timeframe chart the ABC corrective mode wave; we are now forming the C wave. The C wave subdivides itself into five smaller waves because it's a motive mode wave. We are taking a look at the volume. We understand that bears are still in power, so we are waiting for some nice volume from bulls. We are spectating a bullish divergence on the MACD indicator. On RSI, there is exaggerated bullish divergence, and in stochastic RSI, we are in an oversold area.
Then, we are shifting our focus to a medium timeframe. We are zooming into the fourth wave, where we are making our sub-waves right now. On the medium timeframe, we are also spectating bearish divergence. We are waiting for the second booby that will basically increase the probabilities of absorption.
As we have seen previously, that helped us to predict that Bitcoin will be crashing. We are also taking a look at our head and shoulders target, which is at $109,000.
Then we are shifting our focus to a lower timeframe, where we are seeing the secret pattern, triple three. Right now, we are creating a sub-wave XX, which is forming itself as a possible zigzag. Paradisers, make sure that you are trading professionally, focus on long-term growth, and avoid get-rich-quick schemes. Any shortage in trading usually ends up sooner or later in bankruptcy.
Remember, don’t trade without confirmations. Wait for them before creating a trade. Be disciplined, patient, and emotionally controlled. Only trade the highest probability setups with the greatest risk to reward ratio. This will ensure that you become a long-term profitable professional trader.
Don't be a gambler. Don't try to get rich quick. Make sure that your trading is professionally based on proper strategies and trade tactics.

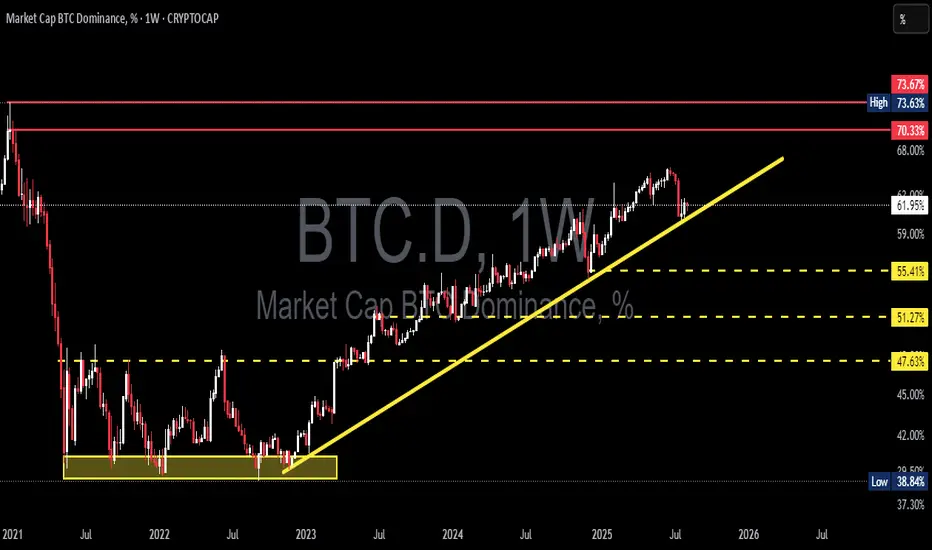
BTC Dominance at a Critical Point – Is Altseason About to Begin?🔍 Technical Breakdown (BTC.D Weekly Chart)
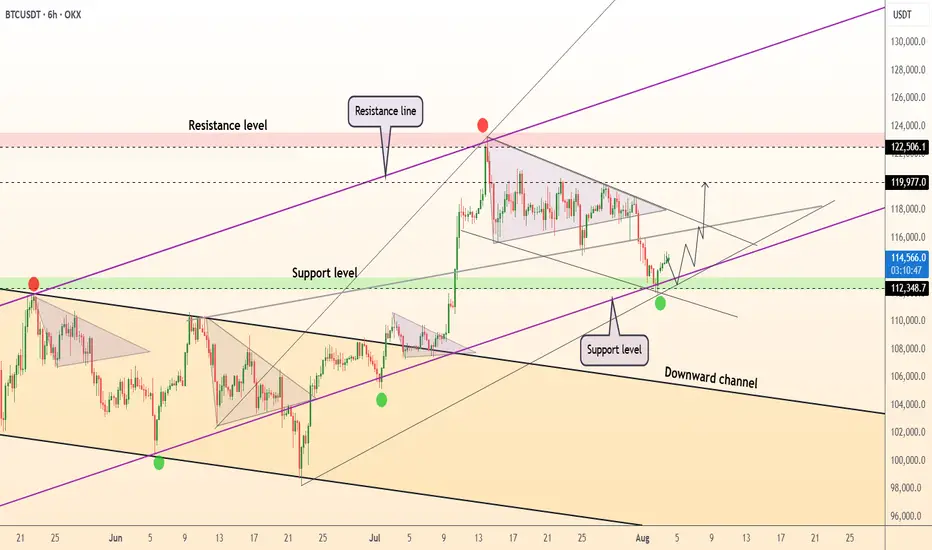
The weekly BTC Dominance chart shows Bitcoin's dominance is now testing a critical ascending trendline, which has supported its bullish momentum since early 2023.
After hitting a major resistance zone between 70.33% – 73.67%, BTC.D faced a sharp rejection — signaling a potential capital rotation from BTC into altcoins, which is often the first clue of an incoming Altseason.
---
🧩 Structure & Pattern Highlights:
✅ Rising Trendline Support:
A strong uptrend structure has been in place since the 2022 bottom (~39%), marked by consistent higher highs and higher lows.
⚠️ Minor Double Top near 70.33% – 73.67%:
This classic reversal pattern at a macro resistance zone hints at possible exhaustion in BTC dominance.
🟡 Historical Accumulation Zones:
Key horizontal levels at 55.41%, 51.27%, and 47.63% have acted as major decision zones in the past and will serve as critical support if the trend breaks.
---
🟢 Bullish Scenario (BTC Dominance Rises):
If BTC.D can:
Successfully hold above the ascending trendline
Print a strong weekly bullish reversal
➡ Then a move back up to retest 70.33% is likely.
A confirmed breakout above 73.67% would suggest BTC dominance could surge further.
📌 What it means? Altcoins would likely underperform, as BTC reclaims market control — usually a risk-off signal for crypto.
---
🔴 Bearish Scenario (BTC Dominance Falls):
If BTC.D:
Breaks below the ascending trendline
Fails to hold the 61.91% support zone
➡ This could signal a significant capital outflow from BTC to altcoins — an early indicator of Altseason.
Bearish targets below:
55.41% – First support area.
51.27% – Key psychological and technical level.
47.63% – A drop to this level would be a strong confirmation that Altseason is in full effect.
📌 In this case, we’d expect strong moves across sectors like AI tokens, DeFi, L1s, and mid/low cap altcoins.
---
📊 Key Confirmations to Watch:
1. Weekly candle reaction to the trendline
2. Volume – strong selling on breakdown confirms trend shift
3. ETH.D and TOTAL2 (Altcoin Market Cap) – if rising while BTC.D falls, it's strong evidence for Altseason
---
🚨 Final Takeaway:
BTC Dominance is now at a make-or-break level that could define the direction of the broader crypto market for the next several months.
A breakdown = risk-on environment, favoring altcoins.
A bounce = BTC continues to dominate while altcoins stall.
Either way, the next big move is coming — this is the moment serious traders and investors have been waiting for.
#BTCdominance #AltseasonAlert #BitcoinVsAltcoins #CryptoRotation #CryptoBreakout #AltcoinSeason #CryptoMarketAnalysis #BTC.D #CryptoTrend #SmartMoneyMoves #CryptoTA #TradingViewAnalysis
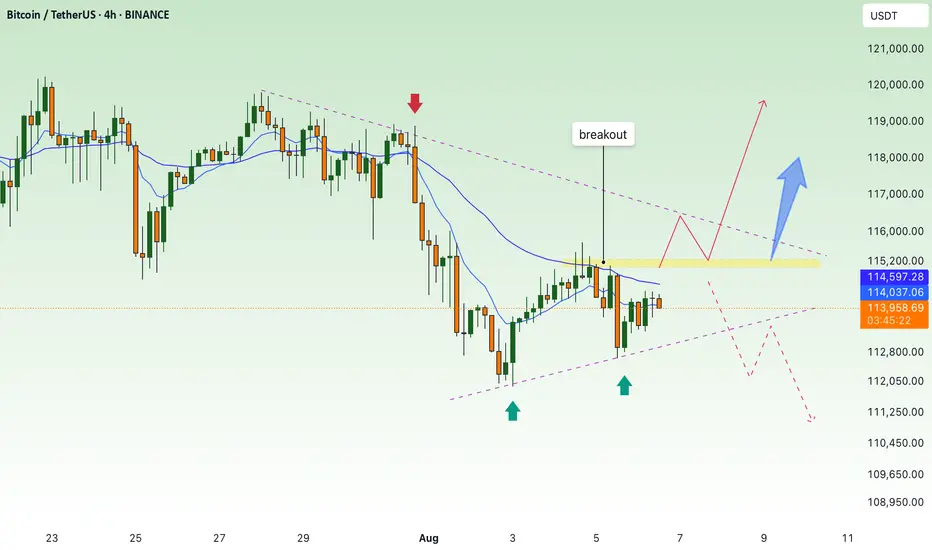
BTC continues to accumulate, waiting for breakout to go up💎 MID-WEEK BTC PLAN UPDATE (06/08)
Brief BTC Analysis – 4H Timeframe:
• Main Trend: Price is consolidating within a descending channel (green diagonal lines).
• Support: The 112,500–113,000 zone has been tested twice and bounced (green arrows).
• Resistance: The 114,800–115,200 zone (purple area) – this is the key level that will determine the next trend.
⸻
Two main scenarios:
🔺 Bullish Scenario (Preferred):
• Price breaks above the 115,200 resistance zone → confirms a breakout from the descending channel.
• Next targets: 116,500 → 119,000.
🔻 Bearish Scenario:
• Price gets rejected at around 115,000 and breaks below the 113,000 support → likely to revisit 110,000.
📌 Key Signals to Watch:
• A clear breakout above 115,200 with volume is a strong buy signal.
• If the price fails to break this zone, consider selling once there is a clear bearish reaction.
BTCUSD manages to hold the lower border of the – Rebound LikelyBTCUSD manages to hold the lower border of the descending channel, ready to rebound.
BTCUSD broke below 116,000.00 support level on August 1 and declined towards 112,000.00 support level. Afterwards, the asset successfully rebounded from it. Although, we noticed 2 false breakouts of the channel, in general the asset tries hold itself within the descending channel, still showing us the strength of this formation.
Here, the rebound towards 118,000.00 level is expected with intermediate consolidation slightly above the 116,000.00. In the long term, the asset still moves within the descending channel, so no new long-term bullish momentum is expected.

$Btc Bounce Signal is Locking in on the $108.5k Golden Pocket Bitcoin recently formed a higher low around the $111,600 level, which is an important structure to watch. This setup is still bearish in nature because if BTC loses this $111.6K support, it will confirm a deeper bearish trend taking hold. Right now, BTC is pulling back after being rejected at $115,000 and heading towards this crucial $111.6K zone.
If this support holds, we might see some relief or a bounce. But if it breaks, the next key area is the Fibonacci Golden Pocket between $107,000 and $108,000 — a critical level where bulls often try to defend. Failure to hold even the Golden Pocket would strengthen the bearish outlook further.
BTC is at a decisive point, and traders should closely watch how price behaves around these levels to understand if a recovery or a deeper drop is on the cards.

BTC-----Sell around 114500, target 113500-113000 areaAugust 5th BTC Contract Technical Analysis:
Today, the daily chart closed with a small bullish candlestick pattern, with prices remaining high. However, the accompanying indicator forms a death cross. While the broader trend remains bearish, the market is still trending downwards. However, yesterday's significant upward trend suggests a range-bound trend in the short term. Without a continuation of the trend, a significant unilateral move is unlikely. On the hourly chart, yesterday's intraday gains continued in the European and American sessions, but prices failed to break above the previous high. The current candlestick pattern shows consecutive bearish candlesticks, with prices trading below the moving average and the accompanying indicator forming a death cross. Therefore, continued support is crucial for the day, with the strength and potential breakouts of the European session also key.
Today's BTC Short-Term Contract Trading Strategy:
Sell on pullbacks to the 114,500 area, with a stop-loss at 115,000, and a target of 113,500-113,000.

BITCOIN PREDICTION: THIS Breaks - and BTC WILL CRASH TO HERE!!!!Yello Paradisers! I’m sharing my Bitcoin prediction with you. We’re using technical analysis on TradingView, specifically Elliott Wave theory.
On the ultra-high time frame, we noticed a Shooting star candlestick pattern. We’re analyzing the channel where the zigzag formation is occurring.
We’re also looking at bearish divergence on the ultra-high time frame chart and the zigzag on the high time frame chart. There’s a bullish divergence visible there. The Fibonacci level at $108,000 is also noteworthy, as is the volume, which shows that bears are still in control on the medium timeframe. We’re also analyzing the head and shoulders target plus bearish divergence on the low time frame. On the low time frame, we’re looking at the impulse of the flat C, which is an expanded flat and is currently creating its fourth wave.
Remember, don’t trade without confirmations. Wait for them before creating a trade. Be disciplined, patient, and emotionally controlled. Only trade the highest probability setups with the greatest risk to reward ratio. This will ensure that you become a long-term profitable professional trader.
Don't be a gambler. Don't try to get rich quick. Make sure that your trading is professionally based on proper strategies and trade tactics.

BITCOIN CRASH PREDICTED! HERE’S WHAT HAPPENS NEXT! (scary)Yello Paradisers, Bitcoin crashed exactly as we predicted in the previous videos that it will happen with the highest probability.
In this video I am explaining to you what's gonna happen next.
Head and shoulders, neckline, is be breaking to the downside, we need a clear confirmation of a reclaim Our channel on high timeframe is getting breakout to the downside and confirmation was that a reclaim was already successful.
In this video I'm sharing with you Elliott Way theory on low timeframe and what needs to be done for confirmation perspective in order for us to continue to go to the downside or have a reversal to the upside.
Don't be a gambler. Don't try to get rich quick. Make sure that your trading is professionally based on proper strategies and trade tactics.

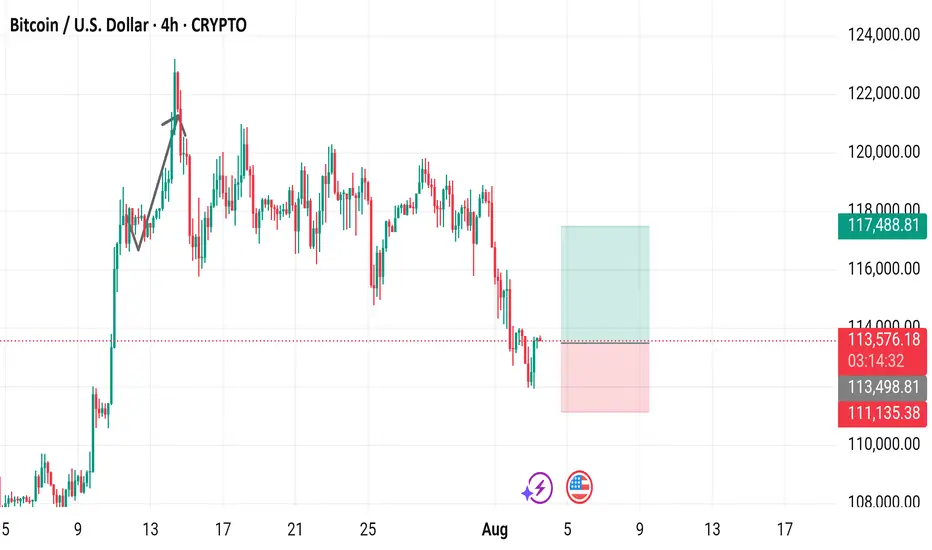
Bitcoin / U.S. Dollar 4-Hour Chart (BTCUSD)4-hour chart displays the price movement of Bitcoin (BTC) against the U.S. Dollar (USD) from late July to August 3, 2025. The current price is $113,570.31, with a 24-hour change of +$1,064.77 (+0.95%). The chart shows a recent upward trend followed by a sharp decline, with key levels marked at $113,570.31 (buy/sell price) and $111,135.38 (support level). The trading volume and price range are highlighted, with a notable drop below the $113,570.31 level as of 03:16:00 on the chart.
longI think the pullback is complete and the beat can grow, but I'm still paying attention to the Dominance Beat. Thank you for your attention.

BTC(20250806) market analysis and operationAugust 6th BTC Contract Technical Analysis:
Today, the large-scale daily chart closed with a small bullish candlestick pattern, with consecutive bullish candlesticks. However, the price remains consolidating at a high level, with no signs of an upward breakout. The accompanying indicator forms a death cross. Therefore, based on the current trend, the price is still within the range, with rising and falling prices unlikely to continue or break out of the range. Therefore, trading should be considered within the range. The short-term hourly chart showed yesterday's intraday gains, followed by pressure and declines in the European session, with the US session continuing its correction. Prices rebounded after finding support in the Asian morning. The current candlestick pattern shows consecutive bullish candlesticks, with the accompanying indicator forming a golden cross. Therefore, an intraday rise is highly likely, but the overall trend is stuck in a range-bound market, so a one-sided trend should not be considered.
Today's BTC Short-Term Contract Trading Strategy:
Buy on a pullback to the 113,700 area, with a stop-loss at 113,200 and a target of 115,000. Sell on a touchdown to the 115,200 area, with a stop-loss at 115,700 and a target of 114,000. Focus on the short-term range.

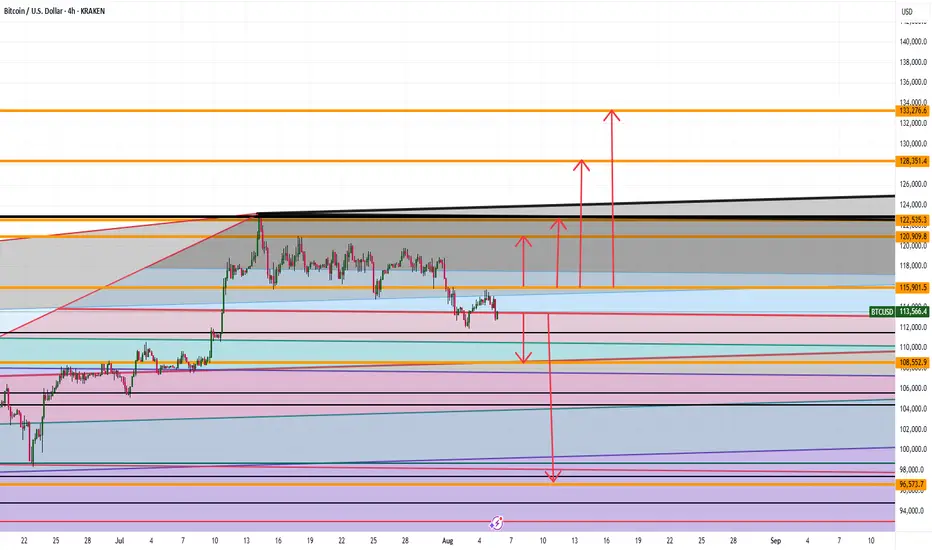
BTC Full Analysis WHERE ARE WE HEADING ???Good afternoon
SO currently with BTC we see the following:
Bullish:
If we can stay and hold above 115,900 then 120K, 122K, 128K and 133K makes sense
BEARISH:
If we close and hold under 113K levels then we can see 108, and 96K levels being hit
What do you think ? Comment Below
Trade Smarter Live Better
Kris
Bitcoin - Structure Holds, Momentum Fades, CME Pull Grows.⊣
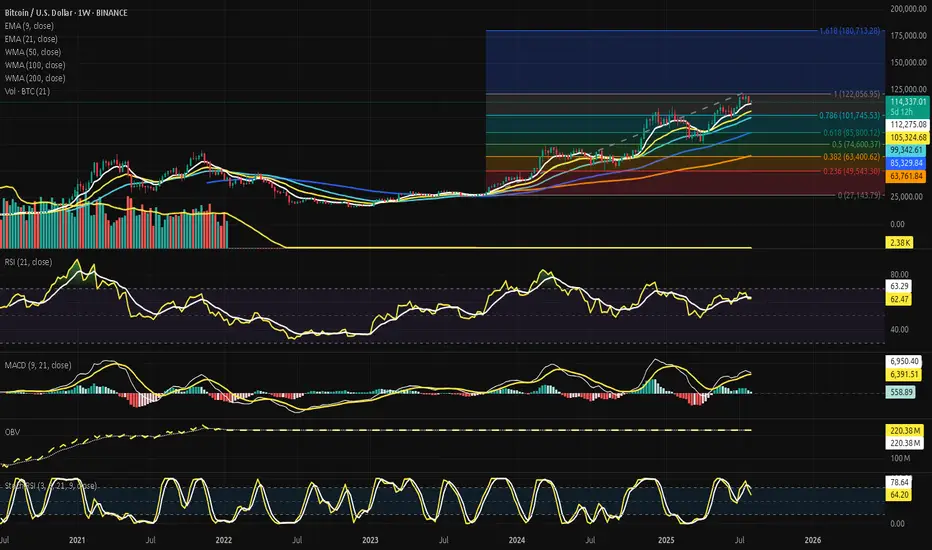
⟁ BTC/USD - BINANCE - (CHART: 1W) - (Aug 05, 2025).
◇ Analysis Price: $114,907.55.
⊣
⨀ I. Temporal Axis - Strategic Interval - (1W):
▦ EMA9 - ($112,389.19):
∴ Price action is currently positioned above the EMA9 on the 1W timeframe, reflecting ongoing bullish strength;
∴ The candle body maintains a healthy gap from the EMA9 line, indicating that short-term trend control remains with the buyers;
∴ This level also coincides closely with the upper bound of the active CME Gap, suggesting strategic confluence support in the $112.3k zone.
✴️ Conclusion: Short-term bullish structure remains intact. EMA9 acts as frontline dynamic support.
⊢
▦ EMA21 - ($105,376.55):
∴ The EMA21 remains far below the current price structure, confirming that mid-term momentum is still securely bullish;
∴ Distance between price and EMA21 reflects a sustained uptrend, but also implies vulnerability to sudden reversion if volume drops;
∴ No signs of flattening or curling - the EMA21 slope is upward, validating continuation bias.
✴️ Conclusion: Mid-range trend remains intact and structurally sound. Acts as deep dynamic support for broader bullish context.
⊢
▦ WMA50 - ($99,364.99):
∴ The WMA50 weighted average is trending upward, reflecting ongoing macro-bullish alignment;
∴ Price remains safely above it, affirming structural support and healthy trend continuation;
∴ No flattening or curve-down detected - the momentum is sustained.
✴️ Conclusion: Primary trend remains unbroken. WMA50 serves as dynamic base.
⊢
▦ WMA100 - ($85,341.14):
∴ Price remains well above the WMA100 weighted average, confirming long-term structural strength;
∴ The slope remains positive, showing no signs of decay or macro exhaustion;
∴ Acts as a foundational support level, unlikely to be challenged unless momentum is broken across multiple time frames.
✴️ Conclusion: Long-term support confirmed. Structure remains in favor of bullish control.
⊢
▦ WMA200 - ($63,767.52):
∴ The WMA200 weighted moving average holds firm as the ultimate line of structural defense in long-term cycles;
∴ Price is elevated nearly 80% above this level, affirming that Bitcoin remains far from macro breakdown territory;
∴ The slope has resumed a slight upward curve, indicating that deep-cycle accumulation zones are now behind.
✴️ Conclusion: Foundational macro support fully intact. Long-term bullish cycle structurally confirmed.
⊢
▦ VOLUME + EMA21 - (347.41 BTC):
∴ Weekly volume shows a steady decline over the past four candles, indicating weakening participation despite elevated price;
∴ The EMA21 sits just below current candle activity, suggesting that momentum is fading but not yet broken;
∴ No volume spike confirms breakout - current structure lacks conviction.
✴️ Conclusion: Volume compression persists. Trend remains, but force is thinning.
⊢
▦ FIBONACCI - (0 = $27,143.79 / 1 = $122,056.95):
⌖ 0.236 - ($49,543.30):
∴ First shallow retracement level, often reached in early corrections;
∴ Remains untouched during this cycle - represents an extreme fallback zone.
✴️ Status: Unreached - deep structural support.
⌖ 0.382 - ($63,400.62):
∴ First zone of major institutional interest;
∴ Closely aligned with the WMA200 - double confirmation as a defense line;
∴ Still far below the current structure.
✴️ Status: Untouched - possible gravity point if collapse.
⌖ 0.500 - ($74,600.37):
∴ Midpoint of the entire bull impulse;
∴ May act as magnet if the current momentum breaks down;
∴ Strongest neutral reversion zone.
✴️ Status: Unreached - mid-cycle equilibrium.
⌖ 0.618 - ($85,800.12):
∴ The golden zone - ideal level for healthy retracements in bullish trends;
∴ Not yet tested, but visible as psychological and strategic area for institutions.
✴️ Status: Unreached - primary retracement target if pullback strengthens.
⌖ 0.786 - ($101,745.53):
∴ Upper-level retracement before full price reentry into macro top territory;
∴ Very close to current price - may act as last resistance zone before all-time high break.
✴️ Status: Approaching - active resistance zone.
⌖ 1.000 - ($122,056.95):
∴ The swing high of the current macro wave;
∴ Current candles are pressing against this level;
∴ A breakout would signal macro continuation - failure could initiate retracement to 0.786 or lower.
✴️ Status: Active - pressure point of decision.
⌖ 1.618 - ($180,713.28):
∴ Full Fibonacci expansion;
∴ Represents speculative future cycle extension;
∴ Only attainable through breakout + sustained volume and ETF inflow.
✴️ Status: Untouched - long-term speculative beacon.
✴️ Conclusion:
∴ Price is now fighting just beneath (1.000 - $122K) - while leaning on (EMA9 - $112K);
∴ The macro structure remains intact, but pressure is rising between the (0.786 / 1.000) band, a known resistance battlefield;
∴ Failure to break (1.000) may activate gravitational pull toward (0.786 or 0.618) - where strength shall be tested.
⊢
▦ RSI (21, 9) - ($62.75):
∴ The Relative Strength Index remains above the 60 threshold, confirming that momentum is still bullish without entering euphoric territory;
∴ The signal line (EMA9 - $63.34), slightly above the RSI value - suggesting mild divergence and loss of acceleration;
∴ No overbought condition present, but a slow downward curve has begun from the local peak.
✴️ Conclusion: Momentum is positive but softening. Watch for confirmation of divergence or RSI breakdown below 60.
⊢
▦ MACD (9, 21, 9) - ($6,403.95):
∴ The MACD line currently sits below the signal line ($7,012.64), confirming a bearish crossover on the weekly scale;
∴ Histogram bars have turned negative, reflecting declining momentum and weakening trend strength;
∴ Despite this, the MACD remains in positive territory, indicating that the macro trend has not yet reversed - only softened.
✴️ Conclusion: Bearish momentum signal confirmed. Short-term weakness within a still intact bullish macro context.
⊢
▦ OBV (9, BB2) - ($220.38M):
∴ The On-Balance Volume indicator maintains a steady upward slope, showing continued net accumulation over time;
∴ No divergence is present between OBV and price - both remain structurally aligned;
∴ The OBV line resides within the upper half of its Bollinger Band (BB2), signaling orderly inflow rather than euphoric volume spikes.
✴️ Conclusion: Accumulation remains healthy and controlled. No warning signs from volume flow.
⊢
▦ StochRSI (3, 3, 21, 9) - (%K: 65.16 / %D: 78.96):
∴ The %K line has begun curving downward after exiting the overbought zone, suggesting momentum exhaustion;
∴ The %D line remains higher, forming a potential crossover to the downside - a classic reversion signal;
∴ Both lines still hover in the upper band, but the slope indicates a softening trend.
✴️ Conclusion: Overbought momentum is decaying. A short-term pullback or consolidation phase is likely.
⊢
🜎 Strategic Insight - Technical Oracle:
∴ EMA9 and EMA21 maintain a healthy bullish spread, preserving the dynamic trend structure without showing signs of decay;
∴ WMA50, WMA100, and WMA200 confirm full macro alignment - the base of the cycle remains strong and upward-facing;
∴ Weekly volume is compressing below its EMA21, indicating that momentum is softening despite price holding high ground;
∴ RSI (21, 9) holds above 60, preserving bullish momentum but showing early signs of curvature loss and possible divergence;
∴ MACD (9, 21, 9) has completed a bearish crossover with a negative histogram, signaling internal weakness under the surface;
∴ OBV (9, BB2) continues its upward trajectory with no volume divergence, confirming that no distribution is currently present;
∴ StochRSI (3, 3, 21, 9) is exiting the overbought zone, with %K descending and %D beginning to curve down - classic signal of momentum exhaustion.
✴️ Conclusion: The weekly structure remains bullish, but all momentum indicators are converging toward a transitional phase; Trend is intact - yet losing energy; A new directional impulse will be required to preserve the current bullish architecture.
⊢
▦ CME GAP - ($111,300 / $112,300):
⌖
∴ This gap was formed between the closing candle of Friday, July 26th and the opening candle of Monday, July 29th, on the BTC Futures contract (CME:BTC1!);
∴ The Friday close occurred near ($111,300), while the Monday open jumped to ($112,300), leaving a 1,000-point dislocation - a vacuum zone where no trades were registered;
∴ As of the current 1W candle, this gap remains completely unfilled - price has not returned to touch or shadow into this void;
∴ The gap is strategically aligned with the (EMA9 - $112,389.19) on the (1W) timeframe, forming a dual-confluence support that amplifies its gravitational potential;
∴ CME gaps of this magnitude, when left open, tend to act as attractors - especially when momentum slows and volume compresses, as currently observed in the MACD and Volume indicators.
✴️ Conclusion: The ($111,300 / $112,300) zone remains an active gravitational target;
If the current weakening of momentum persists, price may be pulled downward to close this imbalance before attempting any further upside expansion; It now acts as a pivot point between bullish continuation and corrective rebalancing.
⊢
𓂀 Stoic-Structural Interpretation:
∴ The structure does not collapse, but it no longer expands - it holds, sustained not by force, but by form;
∴ Indicators speak not of panic, nor of euphoria - they speak of pause, of a market that has climbed far and now waits for intention;
∴ The moving averages form a solid stairway, but the feet have slowed; the MACD has turned, the RSI bends gently, the volume has quieted;
∴ There is no sell-off. No rush to escape. But there is no thrust forward either;
∴ This is not weakness. It is controlled fatigue. The kind that precedes choice - will you break through, or rest and descend?
𓂀 The Stoic mind sees neither threat nor promise - only the present structure, and its silent demand for action.
∴ Hold position : Observe the slope. Momentum must return - or gravity will.
⊢
· Cryptorvm Dominvs · MAGISTER ARCANVM · Vox Primordialis ·
· Dominivm Cardo Gyratio Omnivm ·
⚚ · Silence precedes the next force. Structure is sacred · ⚚
⊢
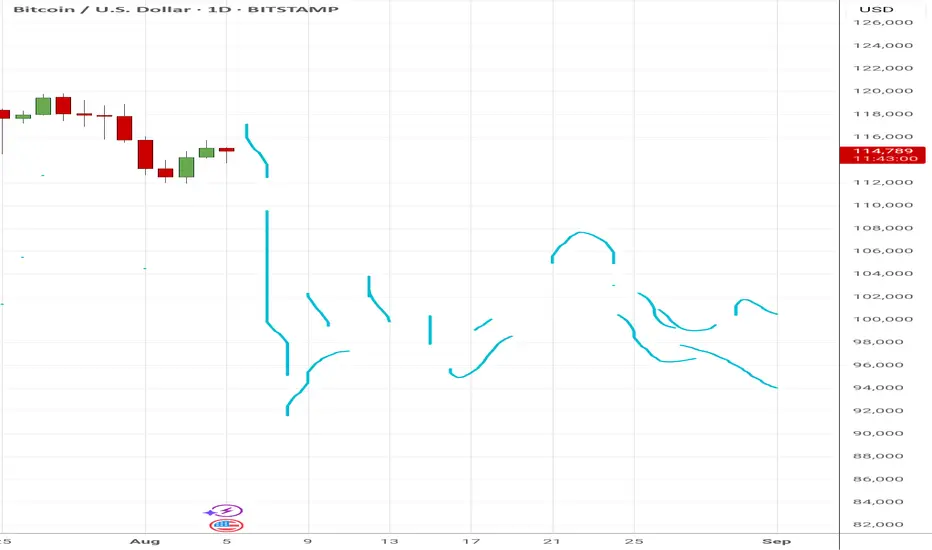
Feeling the charts, bitcoin in august... I am engaged in extrasensory stock charts, that is, feeling the energy of the future chart, this is a meditative technique. In the screenshot of the bitcoin chart, I have drawn my feelings about how bitcoin will move in August 2025. In the week from August 4 to 10, there is a strong downward impulse, in the period from August 18 to 24, there is a slight upward movement with a subsequent correction until the end of the month. The overall impression of August is not positive, I do not expect growth. At the moment, I'm not analyzing the prices, and I'm focusing on the momentum of the price movement. I will consider my forecast to be accurate if the outline of the actual chart matches the outline of the chart I have drawn as a forecast.
BTC sounded the alarm, 115,000 became the key point#BTCUSD
Last week, as global risk sentiment deteriorated, the cryptocurrency market came under pressure, pushing BTC back from its recent highs. This correction was significant, and while BTC has subsequently rebounded, technically, the bearish divergence signaled by the daily MACD indicates weakening short-term rebound momentum. The Bollinger Bands on the 4-hour chart are trending downward, indicating that the market remains in a period of volatile correction.
If BTC cannot effectively break through the upper resistance of 115,000 in the short term, the bears may continue to exert their strength. You can consider shorting with the target at 114,000-113,000.
🚀 SELL 115,000-116,000
🚀 TP 114,000-113,000

What do you think about BTC next Move?May after some days BTC will be crushed. I wish, after some some days you get a good buy position for you. Thanks
BTCUSD: Consolidating at $112K, Watching $120KInstrument: BTCUSD
Timeframe: Daily
Date: August 4, 2025
Analysis:
BTC dropped to $112,000, down 5.1% from $118,000, holding above the $112,000 support. The hawkish FOMC triggered this pullback, but $112K is a key level. I scaled in on the dip as seen in my previous BTC idea and X
Chart Setup:
Support: $112,000, $100,000
Resistance: $115,000, $120,000

Bitcoin Price Flow From Liquidity Grabs to Structural BreakoutsBitcoin Price Action Analysis:
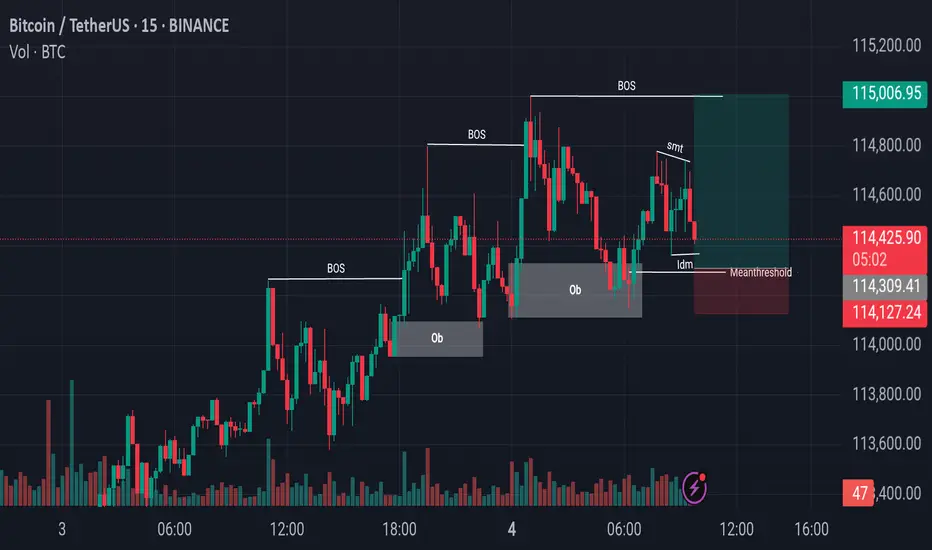
In recent sessions, Bitcoin has been consistently making Breaks of Structure (BoS) to the upside, indicating a strong bullish trend. Most recently, after forming another BoS, the market retraced downward and precisely tapped into a previously established Bullish Order Block (OB). This reaction led to a temporary upward movement; however, during this process, the market also created a zone of internal liquidity.
Currently, Bitcoin is showing signs of a downward move again, potentially aiming to capture Internal Drawdown Market (IDM) liquidity. Just below this level lies another key Order Block, which could serve as a strong support zone. If the price reacts positively from this region, we might see the market initiate another upward leg, potentially forming the next Break of Structure to continue the bullish narrative.
Note: Always perform your own research (DYOR) before making any trading decisions.
DeGRAM | BTCUSD reached the support level📊 Technical Analysis
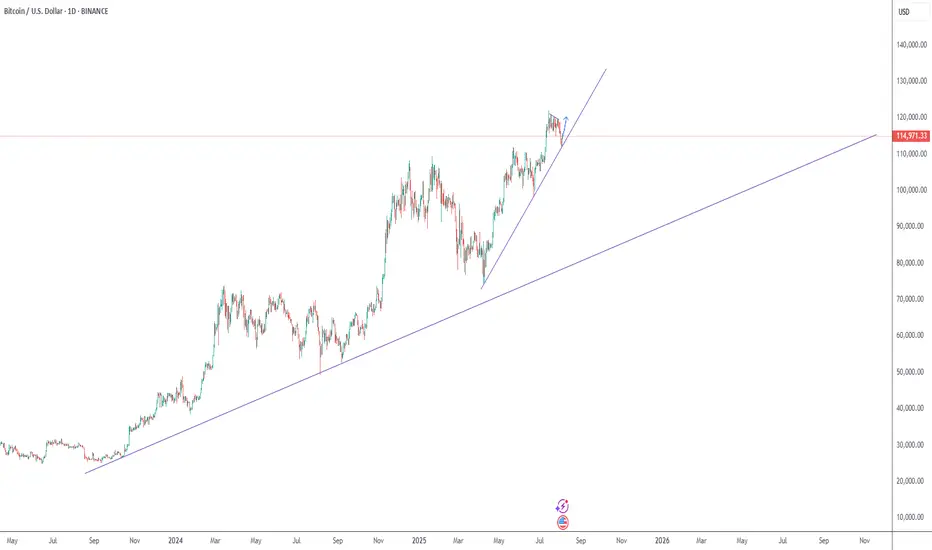
● BTCUSD has bounced from confluence support at 112.3k–114.8k, reclaiming the ascending support line and validating the lower boundary of the rising triangle.
● Price action suggests a bullish continuation setup with targets at 119.9k and extension to the upper resistance near 122.5k–125k.
💡 Fundamental Analysis
● US labor data slowdown and dovish Fed commentary have pulled real yields lower, boosting crypto demand.
● Glassnode reports ongoing whale accumulation and rising stablecoin inflows, signaling positive capital rotation into BTC.
✨ Summary
Long above 114.8k. Targets 119.9k → 122.5k+. Setup invalidated on a break below 112.3k support.
-------------------
Share your opinion in the comments and support the idea with a like. Thanks for your support!
BTCUSD broke below 115,000.00 on week labor dataBTCUSD broke below 115,000.00 on week labor data
On August 1, after worse-than-expected NFP report data came out, bitcoin dropped below important level of 115,000.00 and SMA200 on 4-h chart. Technically, this means the start of a mid-term bearish market in the asset. Bitcoin often follows the same path as high-risk assets, such as tech stocks, particularly during times of economic uncertainty. The July 2025 U.S. jobs report, which showed only 73,000 new jobs added, below the expected 100,000, and a downward revision of June's figure from 147,000 to 14,000, fueled fears of a recession. This caused a broader market sell-off. In just 12 hours, $110 billion was withdrawn from spot crypto markets, with $630 million in liquidations, primarily affecting long positions.
Currently the price is testing the 115,000.00 level. The next decline towards 110,000.00 support level is expected.
