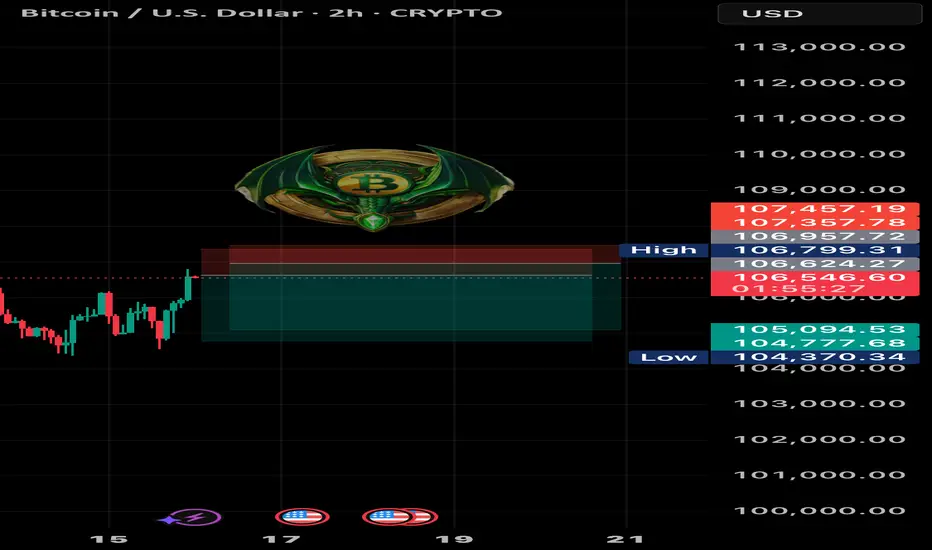
Bitcoin (BTC/USD) 2-Hour Candlestick Chart2-hour candlestick price movement of Bitcoin (BTC) against the U.S. Dollar (USD) as of June 20, 2025. The current price is $106,004.49, reflecting a 2-hour increase of $1,317.33 (+1.26%). The chart highlights a recent upward trend with a support level around $105,082.06 and resistance near $108,009.17. A shaded area indicates a potential price range, with a bullish projection suggested by the overlaid trendline.
Btcusdanalysis

Bitcoin 4-Hour Price AnalysisA 4-hour candlestick chart of Bitcoin (BTC/USD) showing a recent price of $105,562.92 with a 1.17% drop. The chart includes a potential bullish pattern with resistance at $109,003.20 and support at $103,188.43, marked by technical indicators.

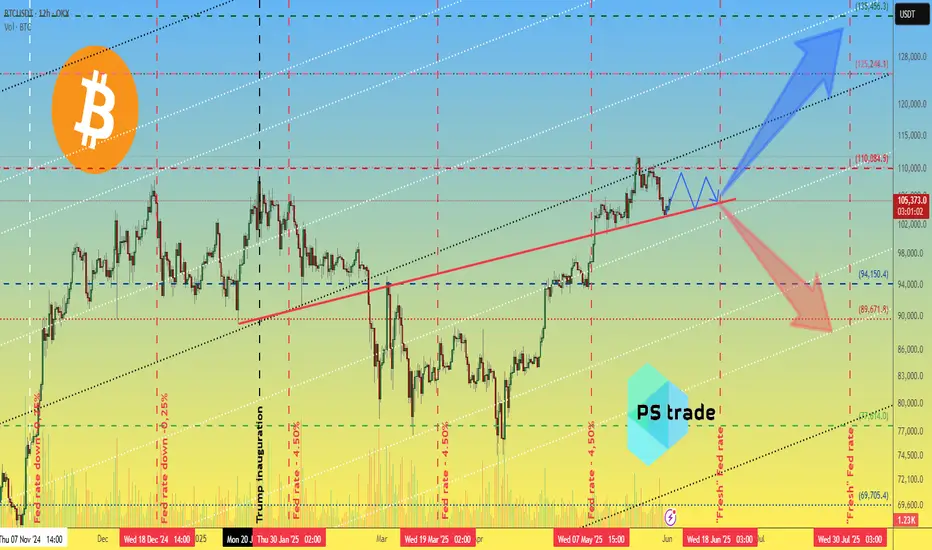
Bitcoin BTC price analysis🍿 At the OKX:BTCUSDT chart, we show one of the scenarios that could play out in the first half of June.
Much will be decided today with the opening of the US market. It is very likely that there will be a downward movement at the opening in response to the new tariffs announced by Trump on Friday after the markets closed.
🕯 Well, then we'll have to “keep our fingers crossed” that market players show their strength and hold on and buy back the drop — like say: we're tired of shaking with every crazy statement from Trump.
💰 If the price of CRYPTOCAP:BTC stays above $103k, there is a chance that it will be “stuck” in the $103-110k consolidation. The market needs to digest and redistribute the results of two months of #BTCUSD price growth from $75k to $112k.
And considering the position of the BTC.D and USDT.D indices, there is a chance that the “little bit” of capital will pass to the altcoins, and they will shoot up a little.
⁉️ Probably, the safest thing to do would be to watch the altcoins and buy only those that have started a significant upward movement with volume.
What do you think?
BTC/USD Bearish Outlook AnalysisBTC/USD Bearish Outlook Analysis 📉🧠
📊 Technical Overview:
The BTC/USD chart is showing signs of a bearish structure formation, suggesting increased downside momentum in the short term.
🔻 Resistance Zone:
Clear resistance is identified near $110,345, marked by multiple price rejections (🔴 red arrows).
Price failed to break above this zone several times, indicating strong selling pressure.
🔸 Support Zone:
Strong support lies near the $100,000 psychological level.
Price has respected this zone multiple times (🟠 orange circles), indicating buyer interest.
📉 Current Price Action:
A descending trendline breakout attempt failed and price is now consolidating just below $105,000.
Price is forming a bearish flag/consolidation structure after recent rejection.
A breakdown from the current box range is likely to push BTC toward the support zone at $100,000.
📉 Bearish Scenario:
If BTC breaks below $104,000, expect continuation towards $100,000.
A daily candle close below support could signal further downside.
📈 Invalidation:
Bullish invalidation occurs if BTC reclaims and closes above $108,000, with volume, retesting resistance at $110,345.
🧭 Summary:
BTC/USD is exhibiting a lower highs structure within a descending channel. Unless it breaks above the resistance zone, the bias remains bearish with a high probability of retesting support.

BTC-----Buy around 104900, target 106000 areaTechnical analysis of BTC contract on June 19:
Today, the large-cycle daily level closed with a small positive line yesterday, the K-line pattern was a single positive line with continuous negative lines, the price was below the moving average, and the attached indicator was dead cross. The general trend of the decline was still relatively obvious, but in trading, we should pay more attention to the rhythm of the price range in the shock, so the operation should be decisive, not greedy, and do a good job of risk control; the short-cycle hourly chart yesterday's intraday support was corrected upward, the European session fell but did not continue to break down, the price support rebounded in the early morning, the current K-line pattern was a single positive line with continuous positive lines, and the attached indicator was golden cross, so it is highly likely to break through yesterday's high of 105500 area within the day.
Today's BTC short-term contract trading strategy:
Buy at the current price of 104900 area, stop loss at 104000 area, and target 106000 area;

Warning: BTC Just Got Rejected HARD — Next Stop $101KBTCUSDT 4H Technical Analysis – Bearish Setup in Motion
The current 4-hour chart of BTCUSDT on Binance paints a clearly bearish picture, driven by strong confluence between the Ichimoku Cloud system, price structure, and descending trend channel. Market sentiment has shifted from indecision to downside control, and unless bulls reclaim critical zones soon, a drop toward $101,900 appears highly likely.
Ichimoku Cloud: Bearish Confirmation on Multiple Levels
The Ichimoku Cloud indicator in this setup plays a dominant role in forming the bearish bias. First, the price action has broken below the Kumo (cloud) and is currently rejecting it from the underside. This behavior alone signals a shift in sentiment, as the cloud now acts as dynamic resistance.
The Tenkan-sen (conversion line), shown in blue, has crossed below the Kijun-sen (baseline) in red—this is a strong bearish crossover. Notably, this crossover occurred below the cloud, which within Ichimoku principles is considered one of the most powerful bearish signals available. It reflects a synchronized decline in both short-term and medium-term momentum.
Furthermore, the future cloud (Senkou Span A and B projection) is flat and shaded in red, signaling weak bullish momentum ahead and strengthening the case for a downward continuation. Flat Kumo tops also indicate a magnet for price, often pulling it back for a re-test before continuation—precisely what is unfolding here.
The Chikou Span (lagging line), which plots the current price 26 periods back, is well below both the price and the Kumo. This further confirms that market sentiment, momentum, and trend direction are all biased to the downside.
Price Structure and Trend Channel
Overlaying the chart is a clearly defined descending parallel channel, capturing the recent series of lower highs and lower lows. Price has respected this channel on multiple occasions, rebounding near its bounds and reacting to its midline as dynamic support and resistance.
Currently, BTCUSDT is moving lower after retesting the mid-range of this descending channel, which aligns with the bottom of the Ichimoku Cloud. This overlap creates a powerful resistance confluence between $104,600 and $105,800—exactly where price was rejected in the most recent candle clusters.
The repeated failure to break back into the cloud shows that supply pressure is overwhelming, and bulls are losing grip of any short-term recovery.
Liquidity Zones and Risk-Reward Mapping
A red shaded area marks the resistance zone, aligning with the upper boundary of the cloud and the mid-channel structure. This region, between $104,600 and $105,900, has repeatedly acted as a rejection area and represents where sellers are currently stepping in with confidence.
Meanwhile, the projected target is highlighted through the green shaded rectangle, roughly between $101,900 and $102,200, representing the next strong demand zone and the lower boundary of the descending channel.
The downward arrow on the chart visually reinforces this bearish idea, indicating a continuation of the current momentum toward those support levels.
Trade Setup Based on Chart
This current structure provides a clean, high-probability trade opportunity for bearish traders looking to capitalize on further downside in BTC:
• Entry Zone: $104,500 – $105,000
• Stop Loss: Above $106,200 (just above cloud resistance and recent rejection wicks)
• Target: $101,900
• Risk-Reward Ratio: Approximately 1:2.3 (depending on entry)
Final Thoughts
The technical case for shorting BTCUSDT here is robust. The Ichimoku system aligns on all fronts—price below the cloud, bearish Tenkan/Kijun crossover under the Kumo, a red future cloud, and a bearish Chikou Span. On top of that, price action is obeying a descending channel and just rejected from its midpoint.
If this setup plays out as expected, BTC is likely to retest the $101,900 region before bulls attempt to regain control. Scalpers may consider dynamic trailing stops below $104,000, but positional shorts can hold with clear invalidation above the red cloud zone.

Final Shakeout Before BTC’s Last Leg Up?BTC Update
Well due update here...
Since my last forecast, price pushed higher without giving the pullback I was anticipating — instead sweeping liquidity above the prior ATH.
After taking that BSL, price stalled and has since been ranging, showing clear signs of bearish momentum creeping in. We're seeing bearish orderflow on the LTF and daily, and volume is thinning out up at these highs — not ideal for bulls.
USDT.D is also pushing higher and showing strength, which typically leans bearish for BTC in the short term. The structure on that chart is bullish and supports the idea of a BTC pullback being likely before any continuation higher.
That said, I'm still pro-trend bullish overall — as I mentioned in April — thanks to the clean bullish shift from the range lows and clear signs of accumulation. We’ve got textbook last points of support (LPS) and unmitigated demand sitting below current price, which are prime candidates for a reversal.
Right now I’m eyeing two key levels:
Upper demand zone / LPS — lining up with the top of the prior accumulation range. This has strong confluence as a breakout-retest zone.
Lower refined weekly/2W demand — valid if we see a deeper flush or capitulation leg, though less likely in the short term.
My focus is on the first level. I’ll be watching for reactions and reversal signals if price taps into it. Same logic applies to USDT.D as it approaches nearby supply zones.
Overall, I see this as a healthy correction — overdue after an extended leg — and expect BTC to push higher and break ATHs once demand is retested and confirmed.
Zooming out: the 4-year cycle is approaching its final stages, with data suggesting a cycle top could form around Q3/Q4 2025 — likely between August and October, if past cycles rhyme. I’ll be monitoring major assets against that timeline and will look to scale out and risk-off when the confluences begin aligning with that macro cycle window.
Just think...
1 last BTC leg up...
Final altseason hype to drag in latecomers...
Then the cycle ends — and the trap shuts as we re-enter bear territory.
Charts:
1D:
3D:
1W:
Extra:
1M:

Bitcoin 4-Year Cycle Structure – Technical BreakdownBitcoin 4-Year Cycle Structure – Technical Breakdown
This chart examines Bitcoin’s historical 4-year cycle behaviour, focusing on the repeating market structure observed across the last three cycles: Bull Market → Bear Market → Accumulation/Recovery → Halving → Expansion.
Key Observations:
🔹 Cycle Timing Consistency
Each of the past three cycles has shown a consistent duration between the halving and the final bull market peak—typically between 500–550 days. Based on that timing, the current cycle suggests we are still ~100 days away from a potential macro top.
🔹 Post-Halving Correction is Expected
Corrections shortly after the halving have historically marked mid-cycle retracements, not macro tops. The current pullback is structurally aligned with the 2017 and 2021 expansions, where Bitcoin consolidated before pushing to final highs.
🔹 Altcoin Market Segments Lagging
TOTAL2 (Total Market Cap excluding BTC)
TOTAL3 (Excluding BTC & ETH)
OTHERS (Altcoins excluding top 10 by market cap)
All remain below their prior cycle all-time highs, which historically occurs before the full market cycle concludes. These segments often accelerate after BTC has established dominance, typically in the later stages of the bull market.
🔹 USDT Dominance Suggests More Upside
USDT.D is still trending down, which historically reflects increasing risk appetite and capital rotation into crypto assets. Prior cycle tops have aligned with much lower dominance levels, indicating further downside risk for USDT.D, and potential upside for crypto markets.
Conclusion:
Despite short-term volatility, the technical structure across Bitcoin and broader market indicators suggests the cycle remains in its expansion phase. Timing models, altcoin lag, and dominance signals all point to further upside potential before a full cycle peak is in.
1W:
1M:

Bitcoin Crash to $93k is Progressing Well! But be Careful Now!I have explained the price action of Bitcoin, shared my insights on what will happen next, and updated my previous idea on $BTC!
Smash the rocket button if you feel the Bitcoin bearish vibe!

₿itcoin: SetbackBitcoin has come under selling pressure in recent hours. We cannot rule out that a deeper dip may precede the next leg higher into the upper blue Target Zone between $117,553 and $130,891. Once green wave B concludes in this range, we anticipate a wave C decline into the lower blue Target Zone between $62,395 and $51,323 to complete the larger orange wave a. From there, a corrective rally in orange wave b is expected, which should set the stage for a final leg lower to finalize blue wave (ii). Meanwhile, we’re still monitoring the alternative scenario (30% probability), in which blue wave alt.(i) is still in progress. In this case, BTC would stage an immediate breakout above resistance at $130,891.
📈 Over 190 precise analyses, clear entry points, and defined Target Zones - that's what we do.

BTC/USD Potential Bullish ReversalBTC/USD Potential Bullish Reversal 🟢📈
🔍 Technical Overview:
The chart shows a potential bullish reversal pattern forming near a key support zone. Price action has consistently bounced from the support range between $100,000 – $103,700, marked by multiple higher lows (🟠 orange circles), suggesting strong buyer interest.
📌 Key Levels:
Support Zone: $100,000 – $103,700 🛡️
Immediate Resistance: $110,384 🔼
Current Price: $105,202 💰
📊 Pattern Observed:
The price structure shows a possible inverted head and shoulders pattern forming, with the right shoulder currently developing. If this structure completes and breaks the $106,000–$107,000 neckline region, we can expect a bullish breakout toward the resistance target of $110,384 or higher.
📈 Bullish Confirmation:
Bullish rejection from support area ✅
Clean structure with repeated higher lows 📈
Potential breakout arrow suggests move toward the top resistance zone
⚠️ Watch For:
Price must hold above $103,700 to maintain bullish bias
Break below this level may invalidate bullish setup and retest the broader support zone near $100,000
📌 Conclusion:
BTC/USD is setting up for a potential upside breakout if the neckline is broken. Traders should monitor for bullish confirmation before entering long positions.
🔔 Strategy Suggestion:
Buy Zone: $103,700 – $104,500 (on bullish confirmation) 🛒
Target Zone: $110,000 – $111,000 🎯
Stop-Loss: Below $103,000 🛑

BTC/USDT in Consolidation: How To Trade the RangeBitcoin (BTC/USDT) is currently in a clear consolidation phase on the 4-hour chart 📊. Price action is trapped within a well-defined range, and for now, no dominant trend has emerged — we’re simply trading sideways between key support and resistance levels 🔁
In the video, we dive into how to tactically approach this kind of environment by trading the lower time frame trend shifts within the range — focusing on lower timeframe moves from range highs to range lows, and vice versa ⬆️⬇️
We also reference the broader macro picture — looking at the NASDAQ (US100) and the Magnificent 7 (MAGS) for potential clues about Bitcoin’s next directional move 🧠💡. Risk-on or risk-off sentiment in these key tech equities often correlates with Bitcoin’s momentum, making them critical confluence factors for BTC traders.
For now, the strategy is to remain range-conscious and reactive, rather than predictive. Until we get a confirmed breakout or breakdown, patience and precision remain key 🎯

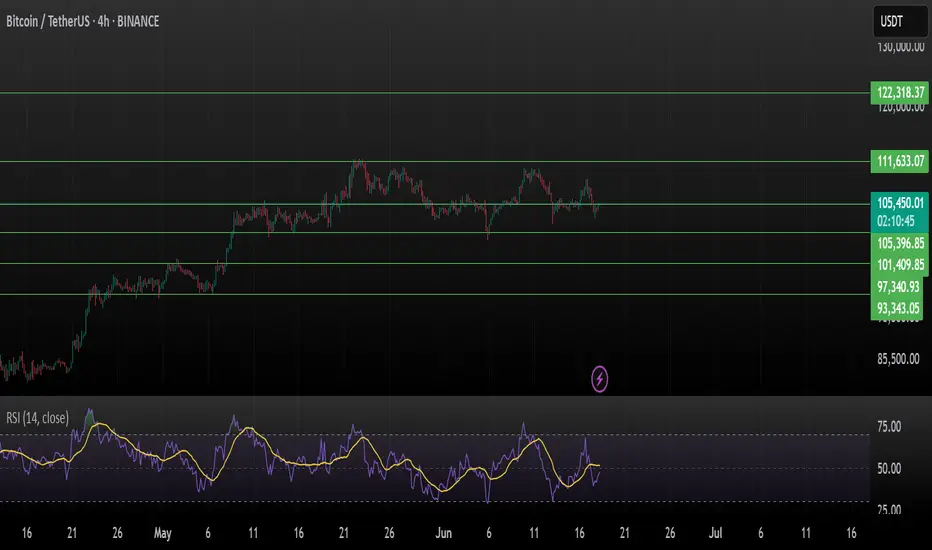
Bitcoin (BTCUSDT) 4H AnalysisBitcoin is currently consolidating around $105,523 after a strong rally and forming a short-term sideways structure. It is still unable to break the immediate resistance of $ 111 K.
Key Technical Observations:
BTC has been ranging between $101,409 and $105,523
RSI at ~51.38 indicates a neutral zone, signaling indecision in momentum
Support holding at $105,396, but price action is flat
Bulls need to reclaim $111,633 to regain momentum
Major Levels to Watch:
Resistance: $111,633 → $122,318
Support: $105,396 → $101,409 → $97,340 → $93,343
A break above $111,633 could trigger bullish continuation, while a fall below $101,409 might open the path to deeper support zones.
Patience is key — wait for breakout confirmation before making moves.
This is not financial advice. Always DYOR and manage risk.
Like, share & comment if you find this analysis helpful!
#Bitcoin #BTC #BTCUSDT
BTC/USDT Long Trade Setup – 1H Chart AnalysisBTC/USDT Long Trade Setup – 1H Chart Analysis
BINANCE:BTCUSDT
Hello traders! Sharing a recent long entry I took on Bitcoin (BTC/USDT) based on price action and liquidity concepts. This trade is taken on the 1-hour timeframe and aligns with my strategy of combining liquidity sweeps, support zones, and market structure shifts.
---
🔍 Trade Overview:
Entry Price: 104,704 USDT
Stop Loss: 103,660 USDT
Take Profit (Target): 108,349 USDT
Risk-to-Reward Ratio (RRR): Approximately 1:3
---
🧠 Trade Idea Behind the Entry:
As you can see on the chart, BTC had been in a downtrend and recently made a strong move into a key liquidity zone. This zone had previously seen multiple touches and rejections, making it an area of interest for both buyers and sellers.
The price swept liquidity below the previous low (labelled as “Liquidity Sweep $$$”), grabbing stop losses of early buyers and triggering limit orders of smart money. This move into the liquidity zone was followed by a strong bullish reaction – a signal that buyers may be stepping in.
Additionally, the "Break of Structure" (BOS) confirms a potential shift in market direction. The reaction from the liquidity zone indicates that this level is holding as new support.
---
🛠️ Why I Took the Trade:
1. Liquidity Sweep: The wick that pierced the liquidity zone signals stop-hunting and accumulation. These moves often precede a strong reversal.
2. Demand Zone Reaction: After the sweep, the candle closed bullish inside the demand box. This shows buyer strength.
3. Risk Management: The stop loss is set just below the liquidity zone to protect from deeper sweeps while keeping the RR healthy.
4. High Probability Target: The target is placed near the next resistance level around 108,349, which also aligns with a clean imbalance that price may want to fill.
---
📊 Technical Confidence:
Confluence Factors:
✅ Liquidity sweep
✅ Demand zone reaction
✅ Market structure shift
✅ High RR
✅ No immediate resistance till target
This type of setup reflects smart money behavior – first pushing price below structure to grab liquidity and then reversing sharply. The bullish momentum after the sweep gave extra confirmation.
---
🧭 What I’m Watching Now:
I will continue monitoring how price reacts around the 105,500–106,000 range. If momentum continues with higher highs and higher lows, I may trail my stop loss to lock in profits.
---
Let me know what you think of this setup! Have you taken a similar trade or are you waiting for confirmation? Drop your thoughts or charts below 👇
Stay disciplined, manage your risk, and trust the process. 🚀
#Bitcoin #BTCUSD #PriceAction #LiquiditySweep #SmartMoney #CryptoTrading #TradingSetup #TechnicalAnalysis #TradeJournal

BTC-----Sell around 105500, target 104000 areaTechnical analysis of BTC contract on June 17:
Today, the large-cycle daily level closed with a small positive line yesterday, and the K-line pattern was a single positive line with continuous negative lines. The price was consolidating at a high level, but the attached indicator was dead cross, and the closing line yesterday was a long upper lead, and the high point was near the 109,000 area. Why is it difficult to continue the rise? The price did not break the previous high point, the continuity was poor, the technical indicators were not obvious, etc., which are all reference data; the short-cycle hourly chart showed that the European session rose yesterday, and the US session continued to break the weekend correction high position. The price fell under pressure, the intraday high was 109,000 area, and the intraday retracement low was 106,000 area. There is no obvious direction at present, so the European and American sessions are the focus, so pay attention to the strength and weakness of the European and American sessions and the breakout situation, and then we will layout according to the real-time trend. The European and American sessions are currently showing a downward trend.
Today's BTC short-term trading contract strategy:
The current price is 105,500 and directly short, stop loss in the 106,000 area; the target is the 104,000 area;

Is the Bitcoin Cash Hype Over? BCH/BTC Ratio Flashes WarningThe Great Divergence: Why the Bitcoin Cash-Bitcoin Ratio Breakdown Signals More Than Just a Price Drop
In the unforgiving arena of the cryptocurrency markets, every chart tells a story. Some whisper of quiet accumulation, others scream of speculative frenzy. But few charts tell a story as profound and historically charged as the Bitcoin Cash to Bitcoin (BCH/BTC) ratio. For years, this ratio has been the ultimate barometer of a digital civil war, a measure of the hopes and failures of a project born from a contentious schism. Recently, that barometer has given its clearest signal in months: a decisive and powerful breakdown from a multi-month triangle pattern.
This technical event is far more than a simple squiggle on a screen for traders. It represents the potential end of a speculative, hype-driven rally and the forceful reassertion of a brutal, long-term trend. It signals that the fundamental chasm between Bitcoin, the undisputed king of digital assets, and Bitcoin Cash, its most famous and ambitious offshoot, may be widening once again. The breakdown suggests that the brief period of optimism for Bitcoin Cash, fueled by its own halving event and a broader market updraft, may be conclusively over. To understand the gravity of this moment, one must dissect not only the technical pattern itself but also the deep-seated historical and fundamental weaknesses that made this breakdown almost inevitable.
The Anatomy of a Technical Collapse: Smashing the Triangle
For much of 2024, the BCH/BTC ratio was trapped in a state of compression. On the chart, this appeared as a classic symmetrical triangle pattern. This pattern is defined by a series of lower highs and higher lows, creating two converging trendlines that form the shape of a triangle. In market terms, it represents a period of intense equilibrium and indecision. Buyers and sellers are locked in a fierce battle, with neither side able to gain a definitive edge. The price coils tighter and tighter, like a compressed spring, building up energy for an explosive move. The only question is which direction it will break.
In the case of the BCH/BTC ratio, that question has been answered with a resounding crash. The price has decisively broken below the lower trendline of the triangle. This is known as a "breakdown," and it is a powerfully bearish signal. It signifies that the sellers have overwhelmed the buyers, the equilibrium has been shattered, and the path of least resistance is now firmly downwards.
Traders often measure the potential target of such a breakdown by taking the height of the triangle at its widest point and projecting that distance downwards from the point of the breakdown. Given the scale of this particular pattern, this technical measurement points to a significant further decline in the ratio, potentially revisiting and even surpassing its all-time lows. This isn't just a minor dip; it's a structural failure on the chart that suggests a new, sustained leg down in Bitcoin Cash's performance relative to Bitcoin. The "hype rally" that saw the ratio climb in the lead-up to the Bitcoin Cash halving has been effectively erased, and the market is signaling that the fundamental gravity of the long-term downtrend is taking hold once more.
A Ghost in the Machine: The Lingering Shadow of the 2017 Fork
This technical breakdown did not occur in a vacuum. It is a single chapter in a long and bitter saga that began in 2017. To grasp its significance, we must revisit the great "Block Size War" that tore the Bitcoin community apart. At its heart was a philosophical disagreement about how to scale Bitcoin to accommodate more users.
One camp, which included many of the earliest adopters and evangelists, argued for a simple solution: increase the block size. By allowing more transactions to fit into each block, the network could process more volume and keep fees low, preserving what they saw as Bitcoin's original vision of a "peer-to-peer electronic cash system."
The other camp, which ultimately retained control of the Bitcoin protocol, argued for a more cautious approach. They feared that large blocks would lead to centralization, making it too expensive for ordinary users to run a full node and validate the blockchain. Their solution was to keep the base layer small and secure, and to build scaling solutions on top of it, such as the Lightning Network.
This ideological impasse led to a "hard fork" in August 2017, creating Bitcoin Cash. For a brief, euphoric period, BCH was seen as a legitimate contender. Fueled by a powerful narrative and influential backers, its price soared, and the BCH/BTC ratio hit an all-time high of over 0.5 in late 2017, sparking serious talk of a "flippening"—the moment BCH would overtake BTC in market capitalization.
That moment never came. Since that peak, the BCH/BTC ratio has been locked in a devastating, multi-year downtrend. The recent triangle pattern was merely a pause, a brief consolidation within this much larger waterfall decline. The breakdown from the triangle is therefore not a new event, but a continuation of a historical trend. It is the market's brutal verdict on the outcome of that civil war.
The Fundamental Chasm: Why Bitcoin Cash Keeps Losing Ground
A chart pattern is ultimately a reflection of underlying fundamentals. The relentless decline of the BCH/BTC ratio is a direct consequence of the widening gap between the two networks across every meaningful metric.
1. Narrative and Brand Identity: Bitcoin has successfully cultivated a simple, powerful, and globally understood narrative: it is digital gold. It is a store of value, a hedge against inflation, and a pristine, unconfiscatable asset. This narrative has attracted institutions, nation-states, and trillions of dollars in potential capital. Bitcoin Cash, meanwhile, has struggled to define itself. Its narrative as "peer-to-peer electronic cash" is less compelling in a world with countless low-fee payment options, including stablecoins and Bitcoin's own Lightning Network. Without a clear and unique value proposition, it has failed to capture the market's imagination.
2. Security and Hash Rate: The most critical measure of a proof-of-work blockchain's health is its hash rate—the total computational power dedicated to securing the network. Here, the difference is staggering. Bitcoin's hash rate is orders of magnitude higher than Bitcoin Cash's. This makes Bitcoin exponentially more secure and resistant to a 51% attack, where a malicious actor could gain control of the network. Bitcoin Cash, with its comparatively minuscule hash rate, remains theoretically vulnerable, a fundamental flaw that deters serious institutional capital.
3. Developer Activity and Innovation: The heart of any technology is its developer community. The most innovative and exciting developments in the Bitcoin ecosystem are happening on the main chain. The activation of Taproot, the explosion of Ordinals and Inscriptions, and the continued growth of the Lightning Network all demonstrate a vibrant and evolving protocol. In contrast, the developer ecosystem for Bitcoin Cash has been far less dynamic. While it has its dedicated builders, it has not produced the kind of groundbreaking innovation needed to attract new users and capital.
3. Adoption and Network Effects: Bitcoin's network effect is its ultimate moat. It has spot ETFs trading on major stock exchanges, granting it unparalleled access to traditional finance. It is held on the balance sheets of public companies and is recognized as legal tender in some countries. Bitcoin Cash has none of these things. Merchant adoption has stalled, and institutional interest is virtually non-existent. In the world of networks, winners tend to take all, and Bitcoin's lead has become seemingly insurmountable.
The Aftermath: What Comes Next for the BCH/BTC Ratio?
With the triangle pattern now shattered, the path forward for the BCH/BTC ratio looks precarious. The most likely scenario is a continuation of the bearish trend that has been in place for over six years. The breakdown has released the coiled energy to the downside, and the ratio will likely seek out lower levels of support, potentially bleeding towards its all-time lows. For investors, this serves as a stark reminder of the risks of holding assets that are fundamentally and technically weaker than the market leader.
Is there any hope for a reversal? A bull case for Bitcoin Cash would require a monumental shift. It would need to carve out a sustainable niche that Bitcoin cannot serve, perhaps in ultra-low-fee microtransactions. It would require a renaissance in developer activity, producing a "killer app" that draws in millions of users. More likely, any significant bounce in the BCH/BTC ratio would probably be a result of a massive, indiscriminate altcoin rally that lifts all boats, rather than a specific vote of confidence in Bitcoin Cash itself. Even then, history suggests such bounces are temporary and ultimately present better opportunities to sell than to buy for the long term.
Conclusion: The Market Has Spoken
The breakdown of the BCH/BTC ratio from its multi-month triangle is a technically significant event with profound fundamental implications. It is the market's latest verdict in the long-running war for the "real Bitcoin" title. The verdict is clear: the hype is over. The dream of a "flippening" is a distant memory, a ghost from 2017.
The story of the BCH/BTC chart is a powerful lesson in market dynamics. It shows that in the brutal competition of open-source protocols, a superior narrative, impenetrable security, and a powerful network effect are the ultimate weapons. Bitcoin Cash began its life as a legitimate contender with a compelling vision. But over time, it has been outmaneuvered, out-developed, and out-adopted. The chart does not lie. It simply reflects this divergent reality, and its latest signal suggests that the great divergence between Bitcoin and its most famous offspring is set to continue.

₿itcoin: Directly or with a Detour?!Under our primary scenario, Bitcoin remains on track to climb into the upper blue Target Zone between $117,553 and $130,891 during green wave B. The key question at this stage: will the crypto giant head straight for the zone – or take a detour below the $100,000 level first? Either path remains structurally consistent with the broader outlook. Once wave B concludes, we expect a pullback to unfold in wave C, with the low of that move – and the bottom of orange wave a – anticipated in the lower blue Target Zone between $62,395 and $51,323. From there, orange wave b should initiate a corrective rally, likely rebounding toward the $100,000 mark. This would set the stage for the final leg down in blue wave (ii). Meanwhile, our alternative scenario remains intact on the 8-hour chart. This 30% likely scenario suggests Bitcoin is still advancing within blue wave alt.(i) , rather than correcting in wave (ii). A confirmed breakout above $130,891 would validate this outcome.
📈 Over 190 precise analyses, clear entry points, and defined Target Zones - that's what we do.

Bitcoin Strategic Compression, ETF Inflows and Powell’s Shadow.⊢
⟁ BTC/USD - Binance - (CHART: 12H) - (June 17, 2025).
⟐ Analysis Price: $105,324.51.
⊢
⨀ I. Temporal Axis – Strategic Interval – (12H):
▦ EMA13 – ($106,094.47):
∴ The arcane speed line was briefly reclaimed but lost again in the latest candle close;
∴ Price has consistently failed to close above EMA13 since June 13th, indicating weakening momentum;
∴ It now acts as primary dynamic resistance in the 12H structure.
✴️ Conclusion: EMA13 has been rejected. Bearish pressure remains in control.
⊢
▦ EMA44 – ($105,907.07):
∴ Price is currently below EMA44, though recent candles show no strong bearish conviction;
∴ This level functions as a neutral battleground - a true trend emerges only with decisive close above or below;
∴ The slope remains positive, preventing immediate breakdown.
✴️ Conclusion: EMA44 is the structural balance line. Below it, weakness persists.
⊢
▦ VWAP (Session) – ($106,117.67):
∴ VWAP sits above current price, reflecting rejection of institutional value;
∴ All recent attempts to reclaim VWAP failed, signaling lack of dominant buy-side volume;
∴ Confluence with EMA13 and Donchian upper band creates a unified technical ceiling.
✴️ Conclusion: Institutional control remains absent. Value zone denied.
⊢
▦ Donchian Channel (20) – ($106,690.95 / $102,854.49):
∴ Bands remain narrow, and price consolidates between mid-channel and the lower range;
∴ Upper band has been precisely respected for multiple sessions;
∴ This signals imminent volatility release from compression.
✴️ Conclusion: Volatility is fully compressed. Expansion is near.
⊢
▦ Volume - (MA20: 154):
∴ Volume remains below the 20-period moving average;
∴ No strong buying or selling pressure confirms indecision;
∴ Market stands in strategic silence.
✴️ Conclusion: Low activity zone. Observation mode prevails.
⊢
▦ Stoch RSI (3,3,14,14) – (21.38 / 27.27):
∴ Oscillator is crossing upward from oversold, but with weak momentum;
∴ Attempt to recover above 40 still incomplete;
∴ Risk of fakeout unless next candle confirms with bullish volume.
✴️ Conclusion: Reversal signal is weak. Watch for trap conditions.
⊢
▦ MFI (14) – (31.86):
∴ Money flow index stays in low liquidity zone - no signs of accumulation from large players;
∴ No clear bullish divergence, yet no panic selloff either;
∴ The flat trajectory since June 10 confirms institutional disengagement.
✴️ Conclusion: Capital remains cautious. No inflow to trigger reversal.
⊢
🜎 Strategic Insight — Technical Oracle:
∴ Indicators show compression, rejection at $106K and lack of institutional momentum;
∴ Price structure is neutral-bearish with volume confirming indecision;
∴ A breakout would only be valid with strong candle body and +180 BTC/12H volume.
✴️ Conclusion: Tactical patience advised. Await true breakout with confirmation.
⊢
∫ III. On-Chain Intelligence – (Source: CryptoQuant):
▦ Exchange Inflow Total – (All Exchanges):
∴ Total BTC inflows remain below 10K/day, well beneath panic thresholds;
∴ No spikes above 50K BTC since early April - aligns with neutral market conditions;
∴ This reflects dormant whale behavior and no visible distribution phase.
✴️ Conclusion: The market is in structural silence. No signs of capitulation.
⊢
▦ Exchange Inflow Mean = (MA7) – (All Exchanges):
∴ The 7-day moving average of inflow size dropped to ~0.4 BTC - a historic low;
∴ Indicates retail-dominant transactions, not whales;
∴ Precedents show this pattern often occurs before breakout events.
✴️ Conclusion: Institutional wallets remain inactive. Momentum awaits external ignition.
⊢
▦ Spot Taker CVD - (Cumulative Volume Delta, 90-day):
∴ Buyers still hold slight dominance, but the curve is flattening;
∴ This signals demand exhaustion and growing equilibrium;
∴ Historically precedes redistribution or longer sideways action.
✴️ Conclusion: Spot market is neutralizing. Demand fades. No clear strength.
⊢
🜎 Strategic Insight - On-Chain Oracle:
∴ All on-chain indicators confirm weak momentum, low inflows, and diminishing spot demand;
∴ There’s no signal of heavy sell pressure - but also no engine for rally;
∴ This is the seal of silence: light flows, thin volume, no imbalance.
✴️ Conclusion: Market waits for external driver. Watch for catalyst.
⊢
⧉ IV. Contextvs Macro–Geopoliticvs – Interflux Economicus:
▦ Middle East Tensions – Israel / Iran:
∴ Dow and S&P futures drop as evacuation alerts from Tehran raise global concern - (InfoMoney);
∴ Crude oil rises up to +2% - markets brace for supply disruption via Hormuz - (CryptoSlate);
∴ Global capital flows to Treasuries and gold, reducing liquidity in risk-on assets like BTC.
✴️ Conclusion: Geopolitical risk increases macro fear. Bitcoin faces risk-off inertia.
⊢
▦ ETF Activity vs Macro Outlook:
∴ Despite $1.7B ETF inflows last week, price failed to hold key resistances - (CryptoSlate);
∴ This divergence reflects growing fear and fragile confidence in crypto exposure amid global tension;
∴ Institutional demand is present, but impact is diluted by macro noise.
✴️ Conclusion: ETF flows bring no clear edge under macro instability.
⊢
▦ Fed Chair Powell (Upcoming):
∴ Jerome Powell will speak on June 19 - expected to comment on rate pause and forward guidance - (Cointelegraph);
∴ Retail data weakens U.S. outlook, but Fed’s stance remains cautious - (FXStreet);
∴ The speech will likely reset volatility across all assets.
✴️ Conclusion: Powell’s message is the next global pivot point. Market waits.
⊢
⚜️ 𝟙⟠ Magister Arcanvm – Vox Primordialis!
⚖️ Wisdom begins in silence. Precision unfolds in strategy.
⊢
⊢
⌘ Codicillus Silentii – Strategic Note:
The current bias is neutral with a bearish weight;
No validated entry present at this time;
Volume must confirm any breakout attempt;
The Seal of Silence remains active - we watch, not react.
⊢


BTC/USDTHello friends, I hope you are doing well. This analysis came to my mind for Bitcoin. On the 4-hour time frame, if Bitcoin crosses the areas I specified, it will move towards its targets. It could be bullish because gold and oil were bearish yesterday. What do you think, friend?

W pattern off the handle. #Bitcoin to 168K.From my most recent post of the Cup & Handle I see a W pattern. Price broke out of the handle to retest to confirm support creating a double bottom.
This is a very good sign to confirm the C&H for this bullish near future.
If we continue upwards and break the psychological resistance zone at 111K, I expect 168K within 3-6 months.
I attached the Cup and Handle analysis to the current.

Bitcoin/USD 2-Hour Price ChartChart showing Bitcoin's 2-hour price movement against USD, currently at $106,647.03 (+0.96%), with a recovery trend from $105,000 and key levels at $109,000.92 and $104,544.34.

BTC SHORT TP:105,000 16-06-2025Back from a quick break and we’re jumping straight into action 😎
Short and sweet setup — we’re looking for a fast move down.
Entry: 106,500 – 107,000
Target: 104,800 – 105,100
RR: 3.0 average
Timeframe: 2H
Duration: 20–24 hours
Context: Quick and clean short after a small vacation break — let’s stack more green.
📌 Use a tight stop or adjust based on your strategy.
If the move doesn’t play out within the time range, the setup is invalid.
We don’t use indicators, we’re not out here drawing lines or cute little shapes — I just give you a clean trade.