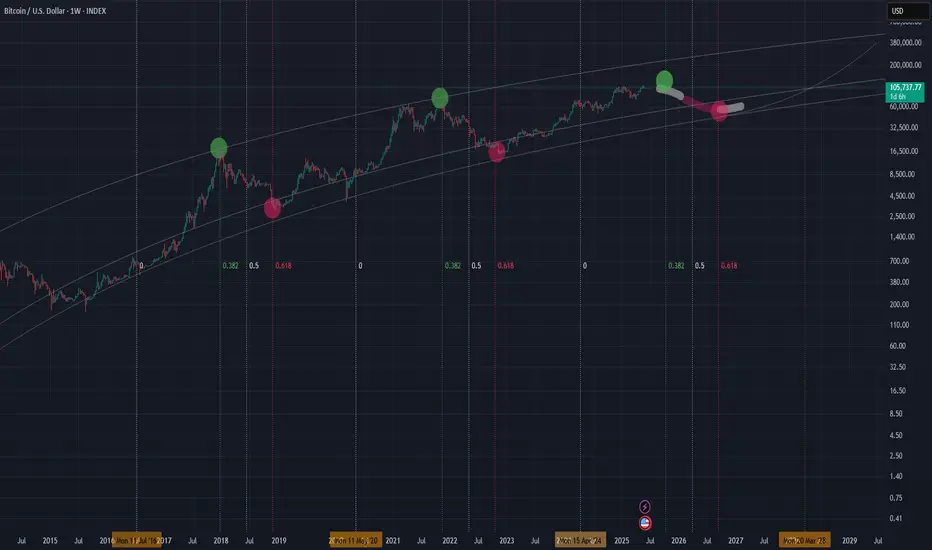
Going parabolic before topping in October?In the last 133 days of the 18 bars or about 548 days from last halving , price has gone parabolic before topping at the 0.382 fib level. Things might get volatile in the coming months.
Btcusdanalysis

Will BTCUSD see $90,000 ever again? Phoenix FX mid term analysisBTCUSD 4-Hour Outlook: The Week Ahead
🔴 Key Resistance Zones
First Resistance
$107 000–$108 500
Recent swing highs where price stalled before the last leg down. Clearing and closing above $105 000 on the 4H would open the door toward this zone.
Final Resistance
$111 000–$113 000 (If broken expect a run to $115,000)
The all-time-high area. Heavy sell-side liquidity lives here and past price action shows repeated FVG fills and wicks into this region.
🔵 Critical Support & Buy Zones
Discount Buy Zone:
$92 000–$89 000 (50% at $89 150)
A deeper weekly FVG and longer-term trend support. The ultimate “buy the dip” area if the premium zone gives way.
Premium Buy Zone:
$100 000 – $99 000 (50% at $99 450)
A 4H Fair Value Gap that aligns with our higher-timeframe trend support. The recent bounce here signals strength—and a possible launchpad back into resistance.
📊 Weekly Price Action Scenarios
Bullish Theory:
If BTC can close cleanly above $105 000 on the 4H, look for a run into $107 000–$108 500 (First Resistance). A follow-through push could then target $111 000–$113 000 (Final Resistance) by week’s end with a potential further move to $115 000 where the 8 year trend will be tested again.
Bearish Theory:
Failure to reclaim $105 000, or a clear rejection in the $107 000–$108 500 zone, could usher in a retest of the Premium Buy Zone (~$100 000). A break below $99 000 would shift focus toward the Discount Buy Zone around $92 000–$89 000.
💡 Trade Ideas for the Week
Potential Long Ideas
Entry: 4H candle close above $105 000
Targets: First take-profit at $108 500; stretch target $112 000–$113 000
Stop-Loss: Below $103 000
Zone Re-Entry Long
Entry: Bullish 4H candle close in $100 000–$99 000
Targets: $107 000 then $112 000
Stop-Loss: Below $97 500
Potential Short Ideas
Entry: Bearish price action (e.g., engulfing candle or wick rejection) in $107 000–$108 500
Targets: $100 000→$92 000
Stop-Loss: Above $109 000
Just a Heads-Up:
This is my take on the charts—not gospel, not financial advice, and definitely not a crystal ball 🔮.
Trading is part skill, part patience, and part “what just happened?” 😅
We all see things a little differently, and that’s the beauty of it.
So if you’ve got a hot take, wild theory, or just want to drop some chart wisdom—hit the comments!
Let’s grow, learn, and laugh through the madness together. 🚀📈
Each one, teach one.
— Phoenix FX Team 🔥🦅

BTCBTC is getting ready for next reaction level 107K and then will see the price action.
Disclosure: We are part of Trade Nation's Influencer program and receive a monthly fee for using their TradingView charts in our analysis.

BTC at Resistance, Correction or Breakout to 109K?Yo traders! 😎 Here's a clean smart money breakdown of BTC/USDT on the 30-min chart. Be ready—this could be the calm before the pump or the trap before the dump 🧠⚡
🧠 Key Observations:
1. BTC is currently at a resistance zone, reacting near 107K, which is the Previous Daily High (PDH) 🧱 → Be cautious here—a rejection could trigger a correction.
2. If price successfully breaks above 107K, the next liquidity magnet is at 109K, right at a Strong High level. That’s where price might get drawn to 🚀
3. In case of rejection or correction, we’re watching the equilibrium zone (EQ) as a high-probability scaling-in area 🎯 → It gives a better risk-reward and aligns with the overall bullish structure.
4. Look how the discount zone aligns beautifully with a liquidity void 🤝 → Smart money loves these confluences. That’s where they often step in.
5. Previous structure shows a Lower Low (LL) followed by a strong displacement upward, indicating a potential Change of Character (ChOCH) ➡️ Bullish Bias 🔄🐂
6. We also got a clean sweep of sell-side liquidity before price pumped. This confirms accumulation by smart money below the EQ area 📉💰
⚡ Summary:
🔺 Above 107K = Breakout Potential → 109K Target
🔻 Rejection at 107K = Watch EQ zone for re-entry
⚠️ Don't rush in at resistance—wait for confirmation (BOS, retest, or signs of strength)
💬 What’s your take? Are you waiting for the breakout or prepping to buy the dip? Let’s chat below 👇
And make sure to follow for more clean, structured BTC updates like this 🔥📊

FUNUSDT Forming Falling WedgeFUNUSDT is currently forming a classic falling wedge pattern, which is widely recognized in technical analysis as a bullish reversal signal. As the price continues to compress within the wedge while holding higher volume on green candles, it suggests growing accumulation by investors. A breakout from this pattern could signal a significant price reversal, with an anticipated gain of 140% to 150%+ based on historical wedge breakout projections. The setup is becoming increasingly favorable for swing traders and mid-term holders.
FUNToken is drawing renewed investor attention due to its integration in blockchain gaming and online entertainment sectors. As demand for decentralized platforms and provably fair gaming continues to grow, FUNToken offers a well-positioned use case. The token has a history of sharp rallies following prolonged consolidation, and the current chart formation indicates that another major move may be imminent. Moreover, sentiment across social and community platforms around FUNToken is turning positive, boosting its speculative momentum.
The technical structure of the chart aligns with increasing trading volume and consistent support holding at key levels, signaling strong underlying demand. The falling wedge is narrowing, suggesting a potential imminent breakout. Once the upper resistance of the wedge is breached with strong volume, price could accelerate rapidly toward upper Fibonacci extension levels, aligning well with the projected 140% to 150% upside potential.
Given these factors, FUNUSDT stands out as a promising opportunity in the altcoin market. Traders and investors watching for strong technical breakouts with real use-case utility will likely find FUN appealing at current levels. Keep an eye on volume spikes and confirmation closes above the wedge for potential entry points.
✅ Show your support by hitting the like button and
✅ Leaving a comment below! (What is You opinion about this Coin)
Your feedback and engagement keep me inspired to share more insightful market analysis with you!

AXLUSDT Forming Descending Wedge bullishAXLUSDT is currently showing strong bullish signals after consolidating at a significant support level, with a notable uptick in trading volume. This renewed volume interest often precedes a breakout move, and the technical structure is shaping up for a potential surge. With momentum building and price action tightening, a projected gain of 60% to 70% is realistically within reach in the short to mid-term. This aligns well with historical price behavior and upcoming support-to-resistance flips.
Axelar (AXL) continues to attract investor interest due to its foundational role in cross-chain communication and interoperability. As more blockchains develop in silos, the need for protocols like Axelar grows. Its ability to facilitate seamless transfers across multiple chains makes it a strong contender in the next wave of infrastructure-focused crypto projects. Market participants are increasingly positioning themselves in utility-driven tokens like AXL that solve real scalability and connectivity problems in DeFi and the broader crypto ecosystem.
From a technical perspective, AXLUSDT is forming a bullish continuation pattern, suggesting that the recent consolidation is simply a pause before another impulsive leg to the upside. The presence of strong support zones, combined with increased volume and investor sentiment, makes this a high-probability setup for breakout traders and swing investors alike. If bullish momentum continues, the upside targets fall well within the 60% to 70% projected gain range.
Traders should keep a close watch on breakout confirmation signals and volume spikes, which could mark the start of a sustained bullish rally. As adoption and attention around cross-chain solutions grow, AXL is likely to see further market traction and price appreciation.
✅ Show your support by hitting the like button and
✅ Leaving a comment below! (What is You opinion about this Coin)
Your feedback and engagement keep me inspired to share more insightful market analysis with you!

$RWAUSDT 1D ChartLSE:RWA 1D chart shows a bullish bounce from the long-term descending trendline.
The price is now targeting the key resistance zone between $0.018175 and $0.021445.
A breakout above this range could trigger a strong rally of over +300%. Momentum looks promising.
Watch this level closely for confirmation.
DYRO, NFA

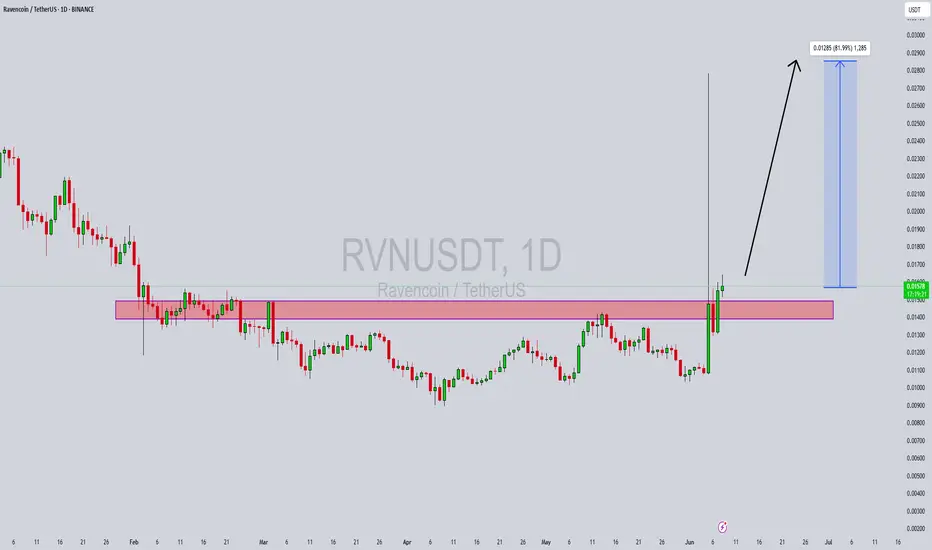
RVNUSDT Forming Bullish ReversalsRVNUSDT is currently showing a promising technical setup after an extended period of consolidation. The price has formed a strong base, supported by steady volume growth, which indicates renewed interest from both retail and institutional traders. This consolidation phase appears to be nearing completion, and a breakout from this level could trigger a powerful bullish rally. Based on the current structure and market momentum, a 70% to 80% gain is anticipated in the upcoming weeks.
Ravencoin (RVN) has maintained relevance in the blockchain space due to its unique focus on asset tokenization. It enables the creation and transfer of real-world assets on the blockchain, which is a growing narrative in the Web3 and DeFi sectors. As more investors seek alternative platforms to tokenize assets and explore decentralized finance, RVN is positioned to benefit from the increased use case demand and adoption.
Technically, RVNUSDT has respected key support zones, and the price action suggests accumulation by long-term holders. A confirmed breakout above recent resistance could catalyze the start of a bullish wave, with price targets aligning around historical resistance levels. The volume uptick further validates the possibility of a breakout, hinting at increased buyer activity and confidence in the project’s future.
Overall, RVNUSDT presents a compelling risk-reward setup for traders and investors watching altcoins with real utility and strong community backing. With the chart structure, fundamentals, and volume all aligning, this crypto pair could be preparing for a significant upward movement.
✅ Show your support by hitting the like button and
✅ Leaving a comment below! (What is You opinion about this Coin)
Your feedback and engagement keep me inspired to share more insightful market analysis with you!
AVAXUSDT Forming Bullish reversalsAVAXUSDT is currently positioned at a major demand zone that has acted as strong support multiple times in the past. This area between $17 and $20 has historically triggered bullish reversals, and recent price action shows a potential bottoming pattern forming within this zone. The market has responded positively with a slight uptick in volume, indicating renewed buying interest from both retail and institutional investors. This setup could be the beginning of a sharp bullish rally, especially if the price holds above the support and breaks the near-term resistance levels.
Avalanche (AVAX) continues to attract investor attention due to its rapidly growing ecosystem and increasing adoption across DeFi, NFTs, and Web3 projects. As blockchain infrastructure becomes more critical, AVAX stands out with its high throughput and low-cost transactions, making it a competitive choice for developers and users. The network has seen consistent upgrades and ecosystem expansion, which boosts long-term investor confidence. From a technical standpoint, the current structure resembles a classic accumulation range with a breakout potential pointing toward a 90% to 100% gain in the coming weeks.
If AVAX can reclaim and hold above the $22–$23 level, it would likely trigger a strong impulsive move toward the $42–$45 target range. The risk-reward ratio remains highly favorable for swing traders and position traders aiming to capitalize on this potential reversal. The expected upside is clearly illustrated on the chart, and with broader market sentiment slowly shifting bullish again, AVAX could be one of the top performers in this cycle.
With confluence from strong technical support, solid fundamentals, and increasing investor interest, AVAXUSDT is setting up for what could be a major bullish leg. Traders should keep a close eye on breakout confirmation and volume expansion for entry signals.
✅ Show your support by hitting the like button and
✅ Leaving a comment below! (What is You opinion about this Coin)
Your feedback and engagement keep me inspired to share more insightful market analysis with you!

BTC Key Rejection or Breakout? Watch These Zones Closely!Hey fam! 👋 Here’s a clean 4H BTC setup with two key scenarios playing out – and both are packed with juicy liquidity zones and price action signals. Let’s break it down 👇
⚪ White Scenario (Bullish Bias):
1. BTC breaks above 107k – a strong breakout structure.
2. Expect a potential continuation move towards 109k, even eyeing the Premium Zone near 110k–111k if momentum holds.
3. Would confirm bullish intent and sweep weak highs.
🟡 Yellow Scenario (Bearish Bias):
1. BTC got rejected around 106k.
2. If it fails to reclaim 107k, expect a potential move back below 100k, especially if we see another CHoCH confirmation.
3. Watch for price to dive into the liquidity void near 98k, possibly deeper into the PMZ (Premium/Discount Equilibrium) zone.
4. Strong confluence at that Sell-side liquidity zone.
🧠 Key Market Structures:
1. Multiple CHoCHs and BOS visible – price is showing indecision.
2. Equal Highs (EQH) & Equal Lows (EQL) hint at liquidity grabs.
3. Liquidity Voids marked are critical for entries or exits.
📍No bias here, just trade the reaction.
Whether bulls or bears win this round, both scenarios offer clear entry/exit zones if you’re patient and follow structure. 📈📉
📢 Drop your thoughts in the comments – are you team breakout or breakdown?
Follow me for more BTC updates & analysis! 🚀🧠

GPSUSDT Forming Bullish Impluse legGPSUSDT has recently shown a bullish continuation setup after forming a strong impulse leg, followed by a textbook falling channel—typically a bullish flag pattern. This price structure is often seen in trending markets as a consolidation phase before the next leg up. With the current breakout attempt supported by rising volume, technical indicators suggest that the market is preparing for a potential surge. A breakout from this falling channel could initiate a powerful bullish wave, targeting gains of 50% to 60% or more.
The growing interest from investors further validates the current technical outlook. GPS is drawing attention in the altcoin space as market participants begin positioning ahead of potential announcements or development milestones. The improving sentiment around mid-cap altcoins is also contributing to a rotation of capital into undervalued projects like GPS, which are now showing early signs of momentum. Price action traders and swing traders should monitor this breakout closely, as the risk-to-reward setup appears highly favorable at these levels.
From a market structure perspective, this breakout may push GPSUSDT toward the $0.036–$0.038 resistance range, which aligns with the height of the previous impulse leg. If buyers sustain pressure and trading volume continues to build, the coin could even outperform the projected move, making this setup one of the more attractive technical plays on the daily chart. This aligns well with broader altcoin market cycles, where coins that consolidate after an initial push often deliver extended rallies once accumulation completes.
With a strong bullish flag formation, solid volume backing, and clear investor interest, GPSUSDT is well-positioned for a sharp upward move. This could present a timely opportunity for both short- and medium-term traders looking to capitalize on a technical breakout in an emerging project.
✅ Show your support by hitting the like button and
✅ Leaving a comment below! (What is You opinion about this Coin)
Your feedback and engagement keep me inspired to share more insightful market analysis with you!

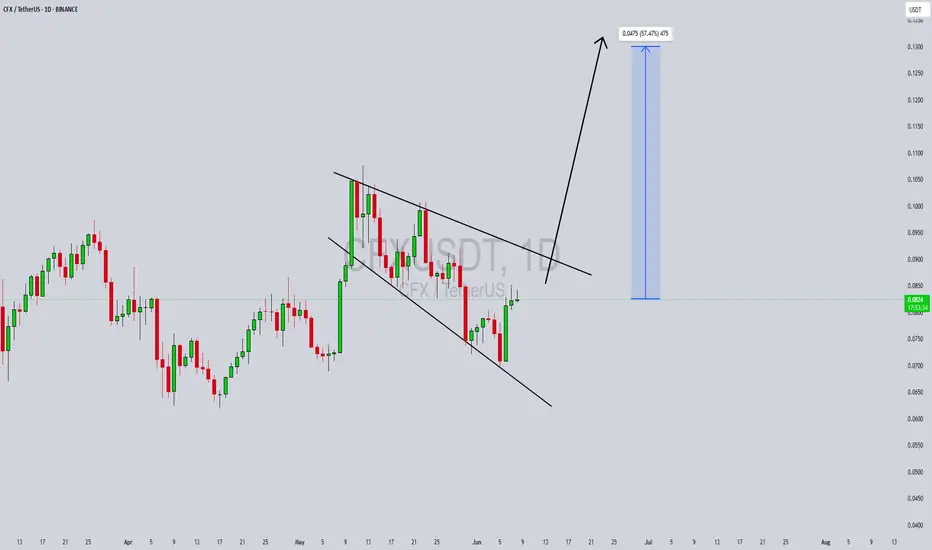
CFXUSDT Forming Falling WedgeCFXUSDT is showing signs of a strong bullish continuation as it emerges from a falling wedge pattern — a setup often considered a reliable reversal signal in technical analysis. As depicted in the chart, the price has been compressing within the wedge, gradually forming higher lows and now attempting a breakout from the resistance trendline. The recent green candles and growing volume suggest bulls are taking control, setting the stage for an upside move. With momentum building, traders could be looking at a potential 40% to 50% surge if the breakout sustains.
Conflux (CFX) has been gaining attention due to its unique position as a high-throughput, scalable blockchain that facilitates cross-border data and value transfer, particularly between China and the global crypto community. As regulatory clarity improves and Conflux continues to expand its ecosystem through partnerships and integrations, market sentiment has shifted in favor of the project. This renewed investor confidence is visible in the technical structure forming on the CFXUSDT chart, as smart money begins to accumulate.
The breakout target aligns with a previous high, indicating that this could be more than just a short-term rally. If volume continues to support the price action, CFX could rally toward the $0.12–$0.13 zone, which marks a critical resistance area. This creates a favorable risk-reward environment for both swing traders and position holders eyeing medium-term gains. Technical traders should watch for confirmation above the wedge and continuation candles backed by volume to validate the move.
Overall, CFXUSDT looks primed for a strong upward movement, supported by bullish technicals and increasing investor interest in the Conflux network. As the project remains fundamentally strong and gains traction in the Web3 space, this may be an opportunity to capitalize on a promising mid-cap altcoin.
✅ Show your support by hitting the like button and
✅ Leaving a comment below! (What is You opinion about this Coin)
Your feedback and engagement keep me inspired to share more insightful market analysis with you!
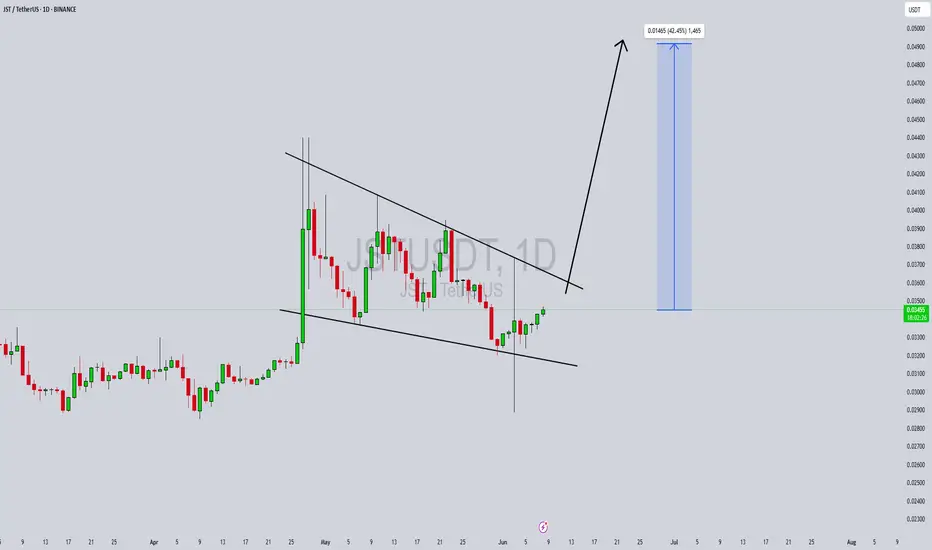
JSTUSDT Forming Bullish WaveJSTUSDT is exhibiting a classic bullish wave pattern, signaling the potential for a trend reversal and a significant upward price movement. Recent price action suggests a solid base has been formed, with higher lows indicating growing buying pressure. As volume picks up, this adds weight to the bullish setup, and momentum indicators are aligning with a possible breakout. Traders and investors are beginning to take interest in JST due to both its technical positioning and the increasing engagement around the Just Network ecosystem.
Just (JST), a DeFi platform built on the TRON network, continues to gain traction for its lending, stablecoin, and yield farming features. This utility, combined with its integration across various TRON-based applications, has helped the project build a consistent user base. As DeFi projects regain attention in the broader crypto market, JST stands out with its established infrastructure and increasing usage metrics. These fundamentals support the potential for a 30% to 40% gain in the near term, especially if market sentiment stays bullish.
Technically, JSTUSDT is moving within a bullish wave formation, suggesting impulsive buying followed by controlled retracements. This pattern typically leads to further upward movement, particularly when supported by increasing trading volume. If price manages to break key resistance levels and hold above them, the next targets could be quickly achieved, offering traders attractive risk-reward opportunities.
In conclusion, JSTUSDT is setting up for a potential rally driven by a combination of bullish technicals and strong project fundamentals. As the DeFi narrative strengthens again, JST could see renewed momentum, especially if broader market conditions remain favorable. Keeping an eye on volume surges and breakout confirmations could offer timely entries for both short-term and mid-term strategies.
✅ Show your support by hitting the like button and
✅ Leaving a comment below! (What is You opinion about this Coin)
Your feedback and engagement keep me inspired to share more insightful market analysis with you!
Pay close attention to LMACD in the weekly!Once we cross LMACD in the weekly it would be dangerous to stay in. Make sure to take some profits once we are getting close to October and before LMACD crosses to the downside

Last 133 days of the bull market!This idea gives more details about the pint in the cycle we are at right now. When measuring the duration between halving and tops we usually see the best in ~500 days after the halving. Following my previous idea about topping in October you can find the same pattern translating in 546 days after last halving. If this proves right , we are about 133 days before top. At this point we should see fireworks till October. In blue is price action in those 133 in 2017 and in yellow 2021, according to the btc nature of diminishing returns we should see peaks bellow those years.Cheers

Trend Base Fib Time suggesting getting out before October 2025!I have been warning you that time is running and a few months left before things start cooling off. This tool is trend base fib time , measured from one halving till the next one. I assumed halving in 2028 at some point in march so this result in a target of October to be the month matching with the 0.382 when peaks use to be found. The 0.618 would be the one for catching the bottoms around Sep 2026. Secure some gains and buy back at next bear market lows close to 40k. Cheers
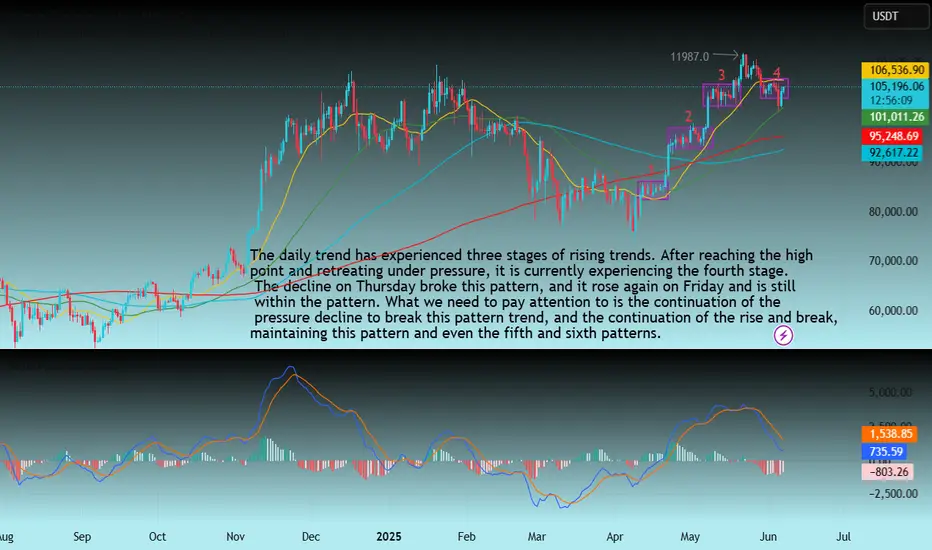
Technical analysis of BTC contracts (outlook for next week)Technical analysis of BTC contract on June 7 (next week outlook):
The weekly trend, after the price hit the high point of 112000 area, it retreated under pressure. The current K-line pattern is negative, but the price is still at a high level, which also exacerbates the overall trend of volatility. The daily price was fluctuating downward before Friday. The impact of yesterday's data caused the price to rise, which seemed to break this trend, and it also became contradictory. The technical indicators of the four-hour chart and the hourly chart changed very quickly, and there was no reference signal for the medium and long term; in general, the current trend will continue the oscillating pattern, with the upper pressure position in the 107000 area and the low point support position in the 100600 area;
The Unraveling of an Empire: How Bitcoin Could Break the DollarFor decades, the U.S. dollar has reigned supreme, an undisputed king in the global financial arena. It is the world's primary reserve currency, the bedrock of international trade, and the safe-haven asset investors flock to in times of turmoil. This dominance has afforded the United States what has been called an "exorbitant privilege," allowing it to borrow cheaply and exert significant influence over the world economy. But the ground beneath this financial empire is beginning to shift. A confluence of mounting debt, shifting geopolitical sands, and the rise of a revolutionary technology is creating the conditions for a challenger to emerge. That challenger is Bitcoin.
Born from the ashes of the 2008 financial crisis, Bitcoin represents a radical departure from the centrally controlled monetary systems that have governed economies for centuries. It is a decentralized, digital currency, free from the whims of governments and central banks. While initially dismissed as a niche interest for tech enthusiasts and a tool for illicit activities, Bitcoin has steadily gained traction, evolving into a trillion-dollar asset class that is now capturing the attention of institutional investors, corporations, and even nation-states. The question is no longer whether Bitcoin is a fleeting fad, but whether it possesses the power to fundamentally disrupt, and perhaps even break, the long-standing hegemony of the U.S. dollar.
A Hedge Against a Failing System
One of the most compelling arguments for Bitcoin's ascendancy lies in its inherent properties as a store of value, particularly in an era of unprecedented monetary expansion and soaring national debt. Unlike the U.S. dollar, which can be printed at will by the Federal Reserve, Bitcoin has a finite supply capped at 21 million coins. This predictable scarcity is a powerful antidote to the inflationary pressures that erode the purchasing power of fiat currencies. As governments around the world, and particularly the United States, continue to accumulate staggering levels of debt, the temptation to devalue their currencies through inflation grows. The U.S. national debt, now standing at tens of trillions of dollars, raises serious questions about the long-term sustainability of the dollar's value. In this environment, Bitcoin's unalterable monetary policy makes it an increasingly attractive safe haven for those seeking to preserve their wealth.
The trend of "de-dollarization" is already underway, with several countries actively seeking to reduce their reliance on the U.S. dollar in international trade and reserves. Geopolitical rivals like China and Russia have been at the forefront of this movement, but even traditional allies are beginning to explore alternatives. The weaponization of the dollar through sanctions has further accelerated this trend, prompting nations to seek financial systems that are not subject to the political whims of a single country. Bitcoin, being a politically neutral and borderless currency, offers a compelling solution. It allows for direct, peer-to-peer transactions across the globe without the need for intermediaries, thereby circumventing the traditional, dollar-dominated financial system.
The Rise of a New Reserve Asset
The ultimate test of a global currency is its acceptance as a reserve asset by central banks. While this may have seemed like a far-fetched idea just a few years ago, it is now a topic of serious discussion in financial circles. A handful of nations have already taken the pioneering step of adding Bitcoin to their reserves, signaling a potential paradigm shift in how countries manage their sovereign wealth. For central banks, the appeal of Bitcoin lies in its potential for diversification. By holding an asset that is not correlated with traditional stocks and bonds, they can better hedge against various economic and geopolitical risks. As more central banks begin to explore this option, even a small allocation to Bitcoin could have a significant impact on its price and legitimacy.
The development of a robust financial ecosystem around Bitcoin is also paving the way for its broader adoption. The emergence of regulated exchanges, custody solutions, and investment products has made it easier for institutions to gain exposure to the asset class. This growing infrastructure is crucial for building the trust and liquidity necessary for Bitcoin to function on a global scale.
The Hurdles on the Path to Dominance
Despite its disruptive potential, Bitcoin faces a number of significant challenges that could hinder its ability to supplant the dollar. The most frequently cited concern is its price volatility. Wild swings in value make it a difficult medium of exchange for everyday transactions and a risky asset for conservative central banks to hold in large quantities. While volatility may decrease as the market matures, it remains a major obstacle to widespread adoption.
Scalability is another critical issue. The Bitcoin network can currently only process a limited number of transactions per second, making it unsuitable for the high volume of payments required of a global currency. While second-layer solutions are being developed to address this, they have yet to be proven at a massive scale.
Furthermore, the regulatory landscape for cryptocurrencies is still in its infancy. Governments around the world are grappling with how to approach this new technology, and the lack of clear and consistent regulations creates uncertainty for investors and businesses. The U.S. government, in particular, is unlikely to cede its monetary authority without a fight, and could impose stringent regulations that stifle Bitcoin's growth.
Finally, no currency in history has achieved global dominance without the backing of a major economic and military power. The U.S. dollar's reign is underpinned by the strength of the American economy and its military might. Bitcoin, by its very nature, is decentralized and lacks the support of any single nation-state. This could be both a strength and a weakness. While it provides neutrality, it also means that there is no central authority to backstop the currency in times of crisis.
A New Financial Order
The notion that Bitcoin could completely break the U.S. dollar and become the sole global reserve currency in the near future remains a speculative one. The dollar's incumbency advantages are formidable, and the challenges facing Bitcoin are substantial. However, to dismiss the potential for a seismic shift in the global financial order would be to ignore the powerful forces at play.
What is more likely than a complete replacement is a gradual transition to a more multipolar currency world, where Bitcoin coexists alongside the dollar, the euro, and other major currencies. In this scenario, Bitcoin could serve as a neutral reserve asset, a check on the inflationary tendencies of fiat currencies, and a parallel financial system for those who are excluded from or wish to opt out of the traditional one.
The rise of Bitcoin is a clear signal that the world is yearning for a more resilient, equitable, and decentralized financial system. Whether it ultimately breaks the dollar or simply forces it to become more disciplined, one thing is certain: the future of money will look very different from its past. The quiet revolution that began with a single whitepaper is now a global movement, and the foundations of the old financial empire are beginning to tremble.

RSI suggesting a bear market comingThis is BTC and it's RSI. Bellow you can see LMACD applied on the RSI indicator to see the trend more clearly. We might be on the stage that we can see higher prices like in 2021, but the bear trend is already printed. Sell some now and buy back at 40k next year. Cheers

FLOKIUSDT Forming Bullish waveFLOKIUSDT is currently showcasing a strong bullish setup, supported by growing volume and technical confirmation. The recent price movement indicates accumulation at key support levels, followed by a tightening range that often precedes a significant breakout. This structure suggests high probability for a powerful upward move, aligning with the projected 80% to 90% gain. With market sentiment turning positive around meme tokens and community-driven coins, FLOKI is positioned for potential explosive growth.
The FLOKI project continues to capture attention across crypto communities due to its expanding ecosystem, including FlokiFi, NFT integrations, and utility within the DeFi space. This has helped build confidence among investors, especially as FLOKI has transitioned from a meme coin narrative to one with real-world use cases. As volume builds around this consolidation, technical traders may interpret this as a bullish continuation pattern, setting the stage for aggressive price expansion.
Technically, FLOKIUSDT is attempting a breakout from a downward channel, with recent candles showing strong rejection of lower prices and momentum starting to shift upward. Once this breakout is confirmed with sustained volume, the rally could accelerate quickly, as price targets move into the 0.000015–0.000016 range. This aligns with the 80–90% gain expectation highlighted on the chart, providing a favorable setup for swing and position traders alike.
Overall, FLOKIUSDT offers a compelling combination of bullish technicals, increasing investor interest, and narrative momentum. It’s a chart worth watching closely for breakout confirmation, especially for those looking to capitalize on mid-cap altcoin volatility during this phase of the market cycle.
✅ Show your support by hitting the like button and
✅ Leaving a comment below! (What is You opinion about this Coin)
Your feedback and engagement keep me inspired to share more insightful market analysis with you!

EDUUSDT Forming Descending TriangleEDUUSDT has recently broken out of a descending triangle pattern on the daily timeframe, which is typically a bullish signal when confirmed with volume. The breakout has occurred with notable strength and solid green candle momentum, indicating a potential trend reversal and the beginning of a strong upward move. With price currently trading near $0.1499, this technical breakout opens the door for a projected gain of 60% to 70%+ in the coming days or weeks.
EDU, the native token of the Open Campus project, is gaining attention as the Web3 education narrative grows stronger. As traditional sectors like education integrate blockchain, EDU stands out as a project with real-world utility and adoption potential. The fundamentals are aligning well with the technical picture, and the increased investor interest is starting to reflect in both volume spikes and social media chatter.
If EDUUSDT maintains support above the breakout trendline, traders could see a continuation toward the $0.25 to $0.27 region — aligning with the chart projection of nearly 80% upside. This setup is further supported by increasing market sentiment, and EDU’s strategic partnerships in the education sector make this move fundamentally sound.
This is a high-potential setup for traders looking to ride breakout momentum in trending altcoins. EDU is not just riding the wave of hype but is backed by utility, strong technical structure, and market interest — making it a standout in the current altcoin rotation.
✅ Show your support by hitting the like button and
✅ Leaving a comment below! (What is You opinion about this Coin)
Your feedback and engagement keep me inspired to share more insightful market analysis with you!

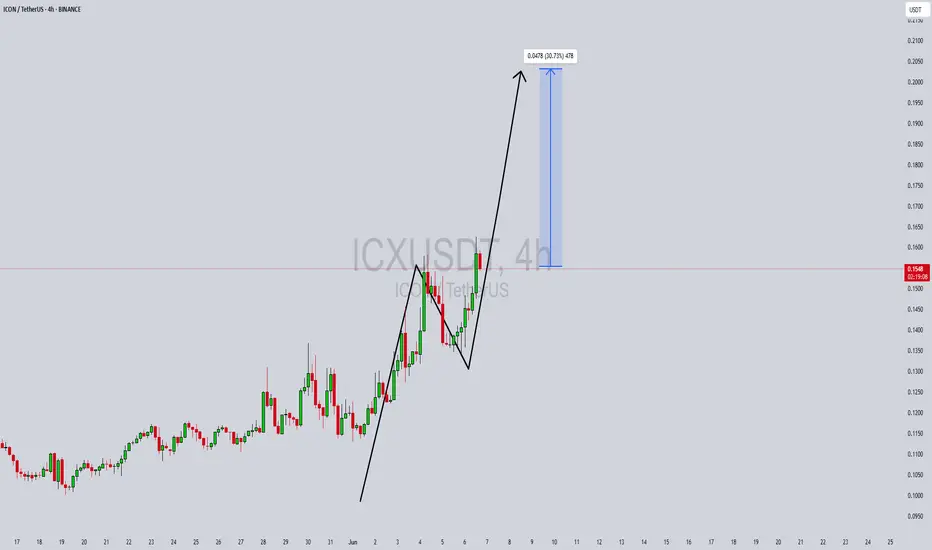
ICXUSDT Forming Bullish impulseICXUSDT has recently shown a strong bullish impulse, followed by a healthy pullback forming a classic bull flag or V-shaped recovery pattern. This setup often signals continuation of the uptrend, especially when supported by solid trading volume, as seen in the recent sessions. The consolidation and subsequent breakout reflect growing investor confidence, making ICX an attractive short-term trading opportunity with an expected gain of 20% to 30%+.
ICON (ICX) is one of the older blockchain projects that has managed to maintain its relevance through consistent updates and ecosystem expansion. As the altcoin market shows signs of revival, mid-cap coins like ICX are starting to attract attention from both retail and institutional traders. The recent price action confirms that ICX is gaining traction, with the breakout targeting a significant resistance zone in the $0.19-$0.21 range.
Traders looking for momentum plays should watch ICXUSDT closely. If the price sustains above the $0.1550 breakout level with increasing volume, it could mark the beginning of a new leg upward. Additionally, the current structure on the 4H chart is providing clean technical entries with tight risk, making this trade setup highly favorable for swing and day traders.
This move is backed by both technical pattern recognition and on-chain interest metrics, which hint at potential accumulation. With sentiment improving and key resistance levels within reach, ICX could deliver a rapid upside move in the coming days.
✅ Show your support by hitting the like button and
✅ Leaving a comment below! (What is You opinion about this Coin)
Your feedback and engagement keep me inspired to share more insightful market analysis with you!
Crypto bull market might be ending pretty soonI am warning you that we might seeing the last days of the bull market. SO FAR histogram is printing the first red candle(we need to verify once June ends). Look what happened with btc once LMACD crossed above 0. Winter is coming.
