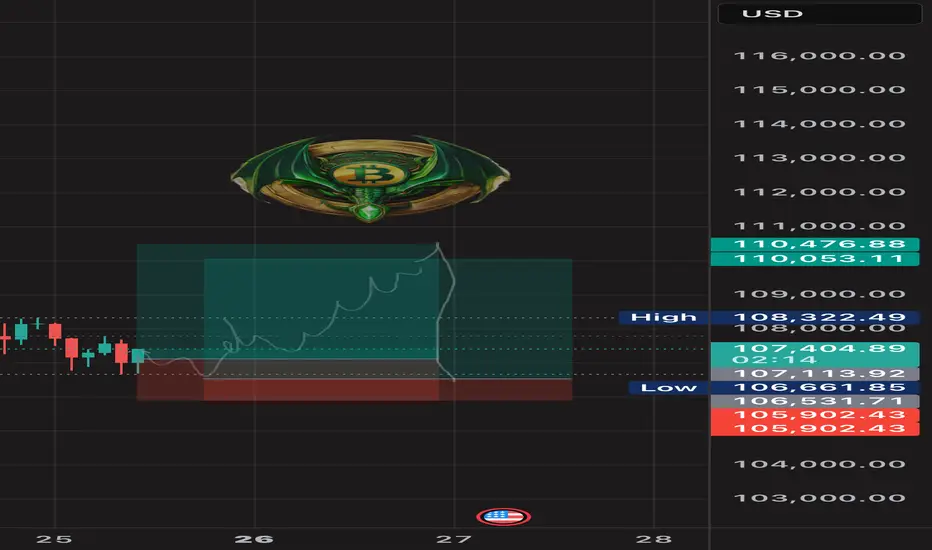
BTC LONG TP:110,000 25-05-2025🚀 LONG setup in play
Looking to enter between 106,500 and 107,000, targeting 109,800–110,300 on the 2H chart.
Estimated duration: 24 hours ⏳
We’re riding a bullish rebound — clean structure, strong reaction.
If the move doesn’t happen within the projected window, the setup is invalid.
We don’t use indicators, we’re not out here drawing lines or cute little shapes — I just give you a clean trade.
#BTC #PriceAction #Reydragon21
Btcusdanalysis
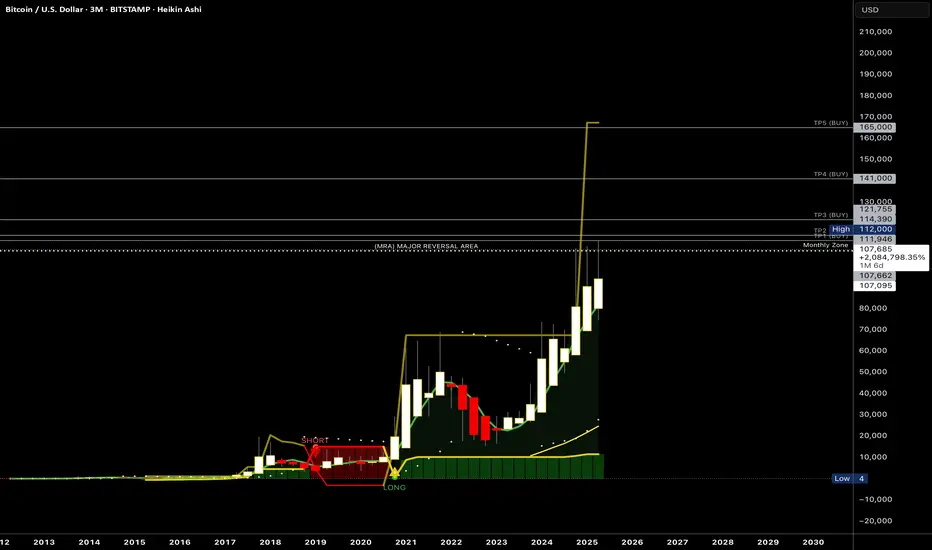
BTC Market Analysis for Q2BTC Market Analysis for Q2 - As we end the month the market tends to rescind. Pay close attention to the monthly and weekly zones. Price needs to break above the monthly zone. Let’s see if the month of June opens up above $107,700 that would indicate a continuation to the upside - possibly to $120-125K…
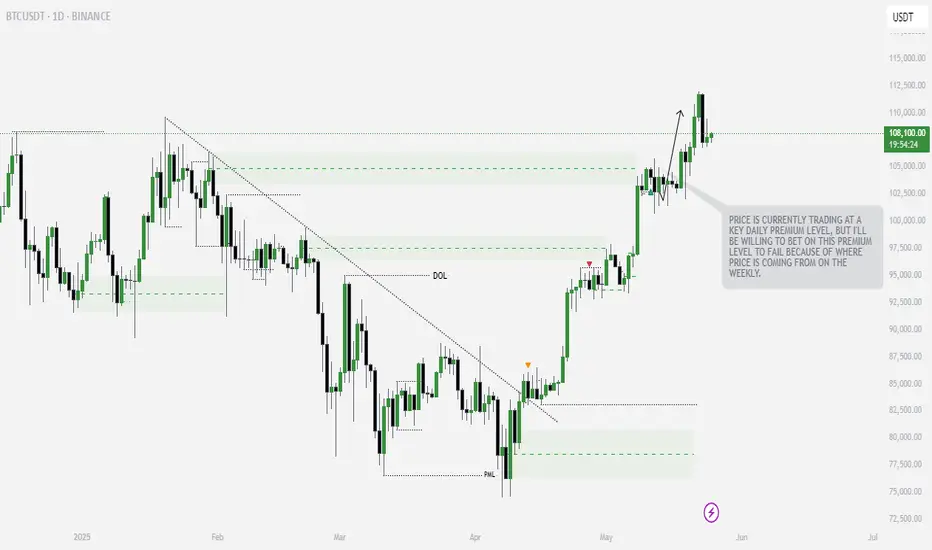
Weekly Analysis for BTC (May 26–30)BTC played out clean last week. Broke above 108k, tapped a new ATH at 110.5k, and pulled back slightly. Structure still bullish — 4H HLs holding strong and 107k retest held nicely into weekend close.
Key level to watch is 110k. If we break that with momentum, price can push to 115k or even 120.7k based on fibs and hype continuation. If we reject again, we might pull back to 107k or 100k — still a buy zone unless 88k breaks.
On the macro side, confluence is heavy:
– ETFs still driving big money inflow
– US debt growing after Trump’s new tax bill
– Moody’s downgrade adds more pressure
– Geopolitical tensions + safe-haven flow also helping BTC hold strength
– Holiday week in the US (Memorial Day), so volume might be low — fakeouts possible if liquidity dries up
Best zones to watch this week:
🔸 110k breakout for continuation
🔸 107k and 100k pullback buys
🔸 110.5k ATH for possible rejection scalps
As long as 88k holds, structure is clean. Bias remains bullish with both TA and macro pointing up.
Will be posting more detial daily anaylsis. follow for more updates. Or check out Streefree_trade IG.

Is the BTC Bull Tired ? A Healthy Pullback May Be on the Horizon🚨 Market Watch Update 🚨
Hey fam while the macro trend is still bullish overall, I'm noticing signs that this current uptrend might be running out of steam. There’s a good chance we’re nearing a breakdown from the rising channel, which could open the door for a healthy correction down toward that ~$90K area.
Last week’s breakout really shook things up a ton of short positions got liquidated, which helped push the price higher in the short term. Classic squeeze move. 👀
But here’s what I’m watching next
🔻 In the near term, I’m leaning slightly bearish. I wouldn’t be surprised if price pulls back into the $102K–$99K zone sometime this week. That range could offer a decent reset before the next major move.
🧠 Remember, when green candles start popping, retail FOMO tends to kick in hard — folks jump in late, thinking the rally will never end.
That’s exactly where market makers step in, taking profits and reloading at better levels. Don’t be the exit liquidity.
Stay patient. Stay sharp. And as always I’ll keep you posted with a deeper dive soon. 🎯

BTCUSD - NEW ATH!MARKET REVIEW
My previous analysis was proven right but i ended up taking 2 losses be the Buys actually happened. This only tells you that analysis isn't all there is to trading, you have to be right also with your Timing & Execution.
BTC/USDT Long Buy TradeBINANCE:BTCUSDT.P
Entry 108100
SL 107200
TGT 113700
BTC forming The Signature W Pattern

Bitcoin (BTC/USD) – Rising Wedge Pattern Signals & BreakdownThis chart illustrates a Rising Wedge Pattern on the weekly timeframe for Bitcoin (BTC/USD), which is generally considered a bearish reversal pattern in technical analysis. The pattern appears after a strong upward move and typically signals that the price is losing momentum and may be preparing for a significant correction.
📐 What is a Rising Wedge Pattern?
A rising wedge is a chart pattern formed when the price consolidates between two upward-sloping trendlines – the support line (bottom) and the resistance line (top) – with the two lines converging toward each other.
As price climbs higher, it forms higher highs and higher lows.
However, the slope of the highs is less steep than the slope of the lows, showing a loss of bullish strength.
Eventually, the price breaks below the support line, often leading to a sharp move downward.
🔍 Key Highlights from the Chart:
📌 1. Major Resistance Zone (~$110K–$120K):
BTC is currently facing heavy resistance in this area.
This zone has historically acted as a supply zone where bulls have struggled to break through.
Multiple rejection wicks indicate strong selling pressure.
📌 2. Pattern Touchpoints:
BTC has now formed multiple touchpoints on both the support and resistance lines of the wedge, confirming the structure.
This gives the pattern higher validity from a technical analysis perspective.
📌 3. SR Interchange Zone (~$65K–$70K):
This is a key horizontal zone where past resistance could act as future support.
A successful breakdown may first test this level before continuation.
📌 4. Retesting After Breakdown:
After breaking the wedge support, a retest of the broken trendline is often seen.
If the retest is rejected, it confirms the breakdown and opens the door to deeper bearish movement.
🎯 Target Projection:
If the wedge breaks down and the bearish scenario plays out, we could see Bitcoin fall to the $22,000–$25,000 region – marked as the final target zone on the chart. This level aligns with:
Previous macro-support zones from 2021
Fibonacci retracement levels
Psychological price levels where buyers may re-enter
⚠️ Bearish Factors to Watch:
Bearish divergence on indicators like RSI or MACD (not shown on chart but worth checking)
Volume decreasing as price rises – a classic wedge behavior
Macroeconomic headwinds or Bitcoin halving-related exhaustion
Rejection from major resistance with strong bearish candles
🕒 Timeframe & Patience:
This is a weekly chart, which means the pattern will play out over weeks or months, not days. Patience is key. A clear break, retest, and rejection would be the most reliable confirmation to expect further downside.
✅ Invalidation Scenario:
If BTC breaks above the wedge resistance line with strong bullish volume and holds above the $120K level, this bearish thesis becomes invalid.
In that case, BTC could enter price discovery mode, making new all-time highs.
💬 Final Thoughts:
This analysis is a technical outlook, not financial advice. Always use stop-loss strategies and manage your risk carefully. Market sentiment, news, and macro factors can quickly shift the scenario. However, from a purely technical standpoint, the rising wedge pattern is a powerful signal that should not be ignored.

Bitcoin - Correction Is Finally Happening!Hello, Skyrexians!
Let's continue trying to guess when BINANCE:BTCUSDT will have a correction. This time it's very likely, but I am not recommend to short this correction because this is the trade against the major trend.
Let's take a look ate 12 hours time frame. Wave 3 is likely to be finished with internal double divergence on Awesome Oscillator. Now it's finally time for the wave 4. 0.38 Fibonacci is the most likely target at $101k. After that wave 5 is expected and it's going to be only higher degree wave 1.
Best regards,
Ivan Skyrexio
___________________________________________________________
Please, boost this article and subscribe our page if you like analysis!

BTCUSDT 4H Analysis BTC ~ 4H Analysis
#BTC Let's start Long/Buy back at this support block with long term target of $120K - $130K - $140K - $150K above this is just bonus for you.

BTC/USD IS A STRATEGIC CORRECTION OR A NEW RALLY AHEAD?BTC/USD 24 MAY – IS A STRATEGIC CORRECTION OR A NEW RALLY AHEAD?
🌐 MACRO & FUNDAMENTAL CONTEXT
Federal Reserve Outlook: Recent statements from Fed officials remain hawkish, signaling that interest rate cuts may not arrive soon. Inflation data remains sticky, adding pressure on risk-on assets like crypto in the short term.
Market Sentiment: Investors are cautious, with capital flowing back into safer assets amid global uncertainty. However, long-term sentiment on BTC remains strong, supported by fundamentals.
On-Chain Metrics: Wallet activity and hash rate growth continue to reflect strong underlying demand. This suggests accumulation despite short-term price pressure.
📉 TECHNICAL STRUCTURE (H1 CHART)
BTC/USD is currently correcting after reaching the 111,947 resistance area. Price bounced from the 106,831 support zone and is now approaching the mid-range levels again.
Chart Formation: A possible "bull trap" pattern is forming. Price may retest the 110,000 – 111,947 supply zone before deciding the next move.
EMA Signals: Short-term EMAs have crossed downward on the H1 timeframe, indicating a weakening bullish momentum.
🎯 TRADE SETUPS FOR TODAY
🔻 SCALP SELL ZONE:
Entry: 111,800 – 111,950
Stop Loss: 112,200
Targets: 110,000 → 108,500 → 106,800 → 102,567
🔺 BUY ZONE (PULLBACK SUPPORT):
Entry: 106,800 – 106,600
Stop Loss: 106,200
Targets: 107,800 → 109,000 → 110,000
🔍 TECHNICAL KEY LEVELS
Resistance Zone: 111,947 – 112,000
Support Zone: 106,831 → 106,600 → 102,567
FIBO Key Levels: 0.5 – 109,393 | 0.382 – 108,763
⚠️ STRATEGY OUTLOOK
If BTC breaks above 112,000 with strong volume, expect a bullish continuation toward 114,000+ levels.
However, if price fails to hold above 110,000 and drops below 106,800, a deeper correction to 102,500 may follow.
📌 CONCLUSION
"BTC is at a decision point, trading between macro hawkish pressure and technical liquidity zones. Stay flexible and wait for confirmation before committing heavily."
Watch the US Jobless Claims data tonight for volatility triggers.
Avoid emotional trades. Use strict risk management.
Follow this profile for more real-time plans and updates.

BTCUSDHello Traders.
This is my analysis for BTCUSD.
I am not a professional and I would be happy if you share your opinion in the comments.

No one is talking about this! Big breakout Incoming! Here'S Why!CRYPTOCAP:USDT dominance is nearing a potential death cross on the daily chart. The last time this happened, we saw nearly 40 days of uninterrupted green across altcoins.
During that period, CRYPTOCAP:BTC rallied from $67,476 to $101,898. Many altcoins surged between 90% and 300%.
We’re now witnessing similar conditions unfold.
If this crossover gets delayed or invalidated (Less likely but entirely possible), altcoins may experience short-term corrections.
But the broader altcoin season remains inevitable.
If this helped you gain perspective, give it a like and repost.
You might want to bookmark it, I’ll update the chart as this plays out.
Don’t let short-term volatility shake you out of generational opportunities.
Be strong there, WAGMI!
#PEACE

DeGRAM | BTCUSD new ATH📊 Technical Analysis
● Daily candle has closed above 108 250 $ – the February swing cap – completing an 8-week ascending triangle inside the rising channel and confirming fresh trend-acceleration.
● Momentum push has opened clear air to the red 112 000 $ supply / channel roof; former breakout line at 105 400 $ now acts as layered support together with the purple guideline.
💡 Fundamental Analysis
● Spot-ETF cohort (IBIT, FBTC, ARKB) logged a three-day net inflow >5 000 BTC while exchange reserves printed a new 3-year low (CryptoQuant), pointing to tightening tradable supply.
● DXY pulled back after FOMC minutes showed no appetite for further hikes, tempering real-yield gains and reviving crypto bid.
✨ Summary
Buy dips 106-108 k; upside window targets 112 k, stretch 115 k. Bull bias void only on a daily close beneath 100.7 k.
-------------------
Share your opinion in the comments and support the idea with a like. Thanks for your support!

Digital gold breaks records: Bitcoin broke through the $111,000 On May 22, 2025, Bitcoin (#BTCUSD) reached a new all-time high, surpassing the $111,000 mark. Notably, this record was set on the day marking the 15th anniversary of Bitcoin Pizza Day - a symbolic date commemorating the first real-world purchase made with #BTCUSD in 2010.
Several major factors have contributed to the recent rise of Bitcoin:
Institutional Investment : The launch of spot Bitcoin ETFs by BlackRock, Fidelity, and others has opened the door for large-scale investors to access #BTCUSD, boosting both liquidity and demand.
Regulatory Clarity : The adoption of clear cryptocurrency regulations in the U.S. and the EU has increased trust in digital assets and attracted more conservative capital.
Banking Integration : Support for #BTCUSD by apps like PayPal, Revolut, and major banks has simplified access for millions of users and expanded its real-world usage.
Macroeconomic Instability : Inflation, geopolitical tensions, and the weakening of fiat currencies have strengthened demand for #BTCUSD as "digital gold" and a means of capital preservation.
Halving and Technological Progress : The reduction in BTC issuance and the ongoing development of the Lightning Network are reinforcing Bitcoin’s scarcity and enhancing its fundamental value.
Surpassing such a significant price level has reinforced #BTCUSD’s position as one of the key assets in today’s financial markets, confirming its status as "digital gold." The rally has sparked a wave of optimism and renewed activity on crypto exchanges, while also drawing increased interest in digital assets from the broader public.
FreshForex analysts share the view that #BTCUSD still holds significant growth potential. In our assessment, the breakout above $111,000 in May signals a continuing upward trend and the possibility of further gains, driven by growing institutional interest.

Bitcoin Remains Bulish once again, almostinner cycle 5 waeces impulse looks completed , but bigger cycle not just yet,
Sell from current levels to 103.000
Buy from 103.000 Targetting 117.000 / 123.000
GG

BTCUSD update May 22nd, 2025I have returned and here is my updated chart. I'm such a perfectionist sometimes when it comes to lines that it takes my hours to get them exactly how I envision. To start off, yes I am bullish on Bitcoin and believe that this cycle hasn't ended yet but I will admit that I think the end of it is closer than the beginning. With that being said, I will not disappear when the bear market starts, I will simply make updates and try to catch the bottom like I did in the past. So far I am going with history and my bottom target is above 66,800 and I expect the floor to fizzle out around 71-73k; if it ends up being higher than that, great! Overall this idea is just an update for my own personal records and my prediction is based on what has happen that last time this pattern was brought to us.
Stay safe out there, happy trading, and as always--Cheers!

BITCOIN : FREE SIGNAL (DON'T MISS)Hello friends
According to the upward trend we had, you can see that the price is stuck in a channel and after the third collision with the channel ceiling, it has managed to break the channel, which indicates the power of buyers and you can buy within the specified support ranges with capital and risk management and move with it to the upcoming goals.
*Trade safely with us*

BTC - Why THIS TIME is DIFFERENT (⊙ˍ⊙)This time IS DIFFERENT. Bitcoin has made a new ATH as I predicted in a few previous posts, but something's off...🤔
If we look at BTC from a macro view, the dates for this run up was quite extended. We do see some similarities in terms of the retracement (highlighted in blue) but from a timeframe analysis, there is no comparing this high to the previous:
stretching from March to October where classical bear market symptoms were show - lower highs and lower lows, with a duration unlike any of the previous cycles.
Interestingly, the previous season we increased not even 7% from the previous peak. And if we were to look at the same fractal, that places us around $116k.
But the ONE thing, that has had me suspicious this entire time (🥁) was ETH. Overlaying the ETH chart, we see that historically, ETH peaked a week or two after the BTC ATH - until this time.
The fact that BTC made such a dramatic ATH and Ethereum didn't? That was a new one. And even up to now, ETH is still 80% away only from it's previous ATH - imagine the altseason we will have IF ETH makes a new ATH... or will this time just be , different ?

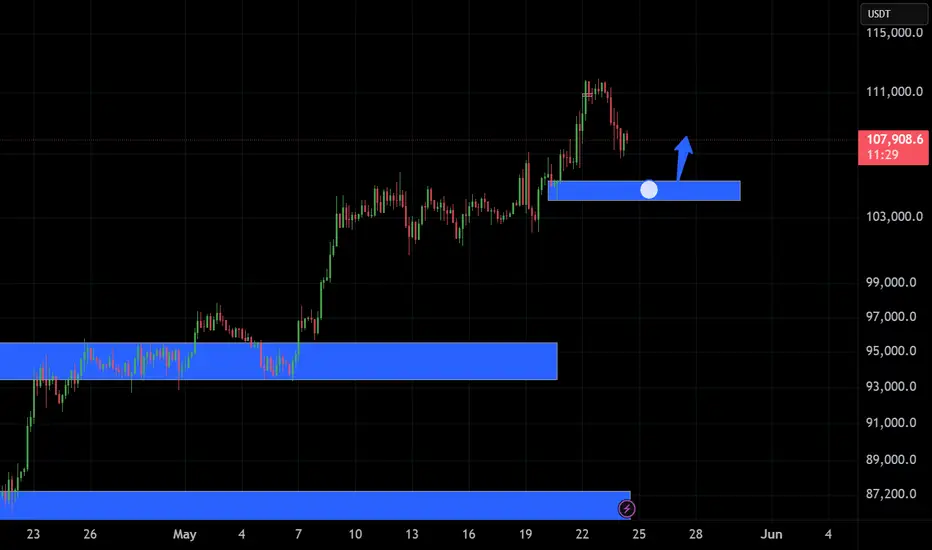
BTC/USD Bullish Setup: Double Bottom Breakout Targeting $110,000 Trade Setup Analysis
1. Support & Resistance Zones
Support Zone (Buy Zone):
Highlighted in purple, between $103,764 and $104,633, with a noted stop loss area near $104,061.
Resistance/Target Zone (Take Profit Area):
Around $109,878 – $110,002 labeled as “EA TARGET POINT”.
2. Double Bottom Pattern (Bullish Signal)
There are two orange circles at the bottom, indicating a double bottom pattern—often a bullish reversal signal.
This is supported by a neckline break near the entry point at $104,534.
3. Moving Averages
Two moving averages are displayed:
Likely a short-term MA (red) and a medium/long-term MA (blue).
The price crossing above both suggests bullish momentum.
4. Trade Plan
Entry Point: Around $104,534
Stop Loss: Below $104,061
Take Profit (Target): $109,878 – $110,002
Risk/Reward Ratio: High, given the tight stop and wide target.
📈 Price Projection
The blue arrowed path suggests:
A minor dip or consolidation near $104,534, followed by a strong upward move toward the target zone.
The movement outlines a classic cup-and-handle or double-bottom breakout pattern.
🧠 Conclusion
This is a bullish trading setup for BTC/USD with a favorable risk-reward ratio. The chart suggests:
Buying near $104,534
Stop loss just below support
Targeting a move to ~$110,000

Bitcoin Overextended? Watch These Key Levels for the Next Move!BTC/USDT 1H – Retrace Before the Next Leg? 🚦
Bitcoin has shown impressive strength recently. On the 1-hour chart the current price action looks overextended 📈. After a strong impulsive move up, we’re seeing signs of exhaustion, with price stalling near the $111,800 region. Liquidity appears thin on the buy side, and there’s a cluster of potential sell stops resting below the current high in the form of sell stop.
I’m anticipating a retrace into the Fibonacci zone, with key levels at the 50% - 61.8% retracement. This area aligns with previous consolidation and could act as a magnet for price, especially as liquidity is swept from late long positions. If we see price rotate and break structure bullishly at my point of interest, I’ll be looking for a long entry opportunity. 🔄
Fundamentals & Macro Backdrop 🌍
On the fundamental side, Bitcoin remains sensitive to macroeconomic and geopolitical developments. Ongoing uncertainty in global politics and central bank policy continues to drive volatility across risk assets. Bitcoin’s correlation with tech stocks and the NASDAQ remains significant—recent data shows that when the NASDAQ pulls back, Bitcoin often follows suit. If we see a correction in tech stocks, be prepared for a retrace in BTC as well. 📉
Institutional interest is still strong, but short-term sentiment is cautious as traders await clarity on inflation, interest rates, and regulatory news. Keep an eye on U.S. economic data releases and any major headlines out of Washington or global hotspots, as these can quickly shift risk appetite.
Fundamentals and macro news remain key drivers—stay nimble!
Let’s see if BTC can reload for another leg up, or if broader market weakness drags it lower. Trade safe! 🚀

Bitcoin Ready for new highAs we see BINANCE:BTCUSD break the previous high and made rounding bottom formation on chart.
So Looks like a bullish trend and if BINANCE:BTCUSD
sustain above 109000 then we can see BINANCE:BTCUSD
Up to around 133000.
Lets see!
This post is just my perception and for study purpose only.
As crypto market has high risk of loosing money. Please invest your hard earned money carefully.
I will not be responsible for any loss in the crypto market.

BTC Creating THIS Pattern Right Now – 108K Next?#BTC is forming a powerful pattern right now! 📊
Are we about to witness the breakout that takes us to **108K**? ⏰
Watch closely – the market's heating up! 🔥
#Bitcoin #Crypto #BullRun #BTC108K
