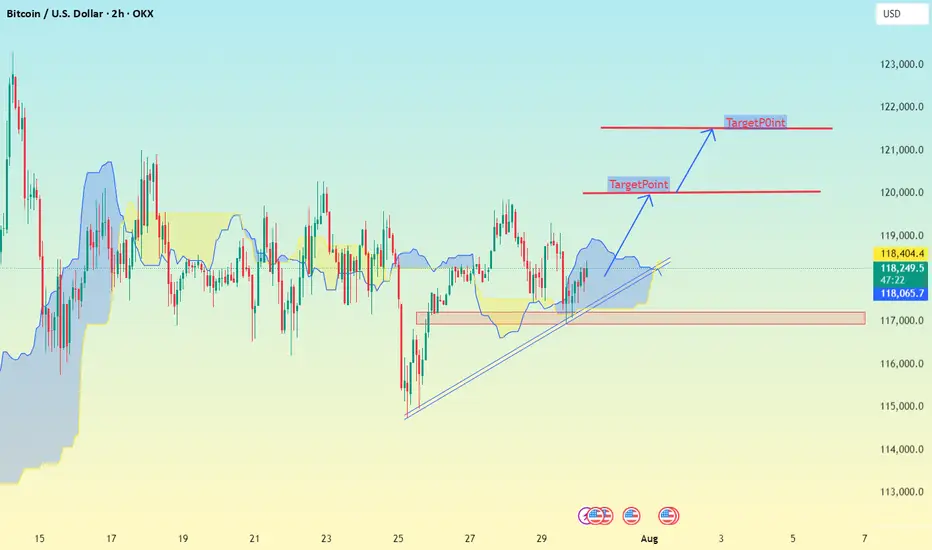
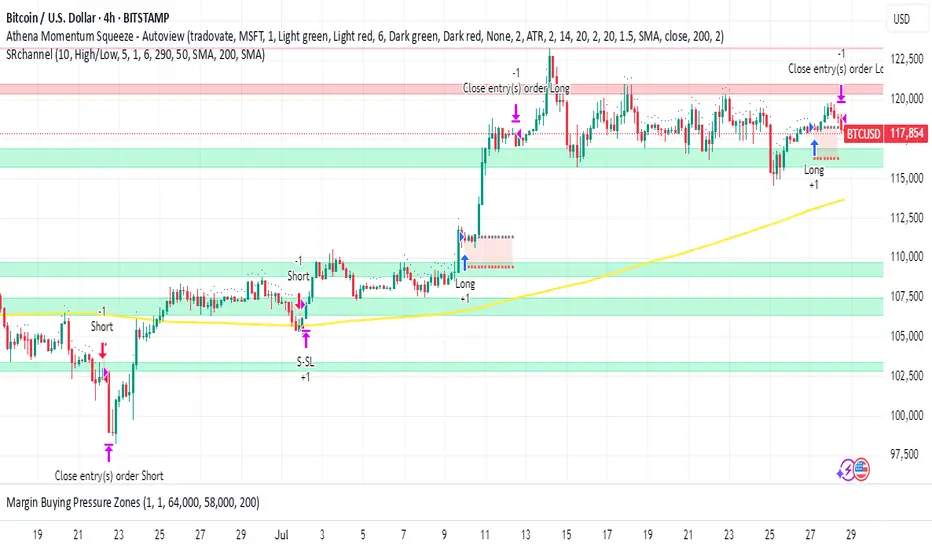
BTC/USDT Buy Setup – VSA & Demand Zone Reaction✅ Entry: Current price action near 117,297
🎯 Target: 119,078 (+1.22%)
🛑 Stop Loss (SL): 116,944 (below demand zone)
📊 Technical Insight (Volume Spread Analysis):
Stopping Volume at Lows:
The recent down move halted with a wide spread down-bar on high volume, followed by an immediate rejection. This indicates potential professional buying absorbing supply.
No Supply Confirmation:
After the stopping volume, several narrow spread candles on low volume formed, suggesting weak selling pressure and a lack of commitment from bears.
Bullish Reaction:
Price rebounded from the demand zone with increasing volume on up-bars, showing early signs of demand dominance.
The current consolidation just above the support is typical of absorption before a markup phase.
Risk-Reward Structure:
The setup offers a favorable 2.2:1 R:R ratio, with the stop placed just below the zone to avoid false breakouts while allowing the trade room to breathe.
📌 Trade Plan:
Bias remains bullish as long as price holds above 116,944.
A breakout above the minor resistance (117,828) with volume expansion would confirm the next leg up toward the 119,078 target.
If volume fails to support the move, reassess before committing additional capital.
Btcusdanalysis

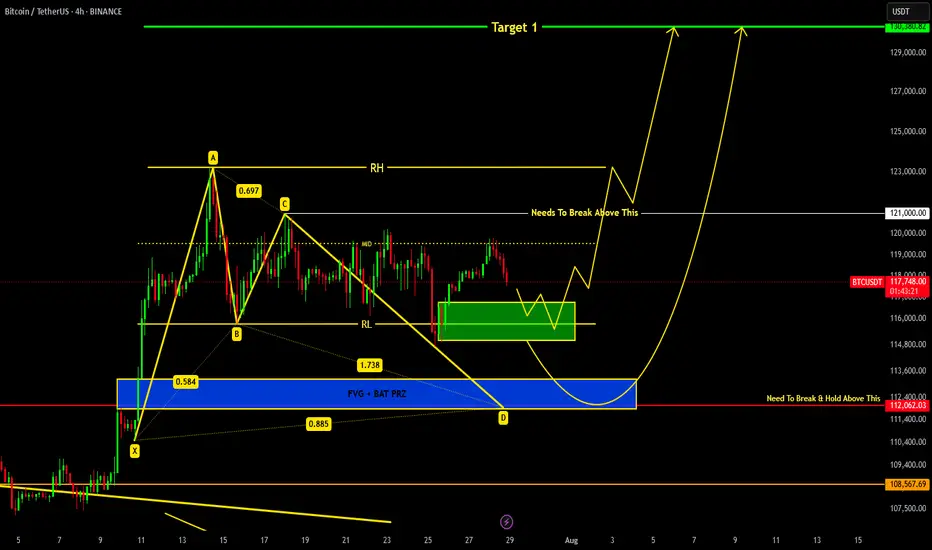
Bitcoin's Natural Correction and the $141K Target Based on Fibonhello dear trader and investors
The cryptocurrency market is always accompanied by strong fluctuations and natural corrections. Bitcoin, as the market leader, requires corrections and liquidity accumulation after each significant rally to pave the way for higher price targets. In this article, we analyze Fibonacci structures and harmonic patterns to demonstrate that Bitcoin's next target could be $141K.
1. Bitcoin Corrections: A Natural Part of an Uptrend
Price corrections in bullish trends are a normal phenomenon that helps shake out weak hands and allows major players to accumulate liquidity. Historically, Bitcoin has experienced 20-30% corrections before resuming its upward trajectory. The current correction is no different and may serve as a base for the next strong move toward higher targets.
2. The $141K Target Based on Fibonacci
Fibonacci levels are among the most reliable tools for predicting price targets. Assuming Bitcoin's recent high was around FWB:73K and the ongoing pullback is a healthy retracement, we can use harmonic AB=CD pattern to project potential upside targets. Based on these levels, Bitcoin could reach $141K in the next bullish phase.
Confirmation Through Harmonic Patterns
Harmonic patterns like Butterfly and Gartley suggest that the current correction is forming a potential reversal structure. If this correction completes within the PRZ (Potential Reversal Zone), Bitcoin could see a strong continuation of its uptrend. The Fibonacci ratios in these harmonic structures indicate that the final price target for this bullish wave could be around $141K.
Volume and Liquidity: Key Drivers for the Rally
Bitcoin needs increased volume and liquidity inflows to reach higher levels. On-chain data shows that trading volumes are rising and large investors (whales) are accumulating rather than selling. This behavior typically precedes a strong bullish move.
Bitcoin's current correction is entirely natural, and technical structures suggest that it could be laying the foundation for a new bullish wave. Based on Fibonacci and harmonic pattern analysis, Bitcoin's next major target is around $141K. Traders and investors should consider these levels in their analysis and avoid emotional decisions during market corrections
good luck
mehdi

Bitcoin Are We Heading to 140K or 80K ??? Here is the Analysis Based on what is happening here is what we currently see with Bitcoin
Idea 1: If we can break 119K then here are the following levels Bitcoin can go to :
122K
126K
135K
140K
Idea 2: If we continue and break further bearish here are the levels BTC can go to
115,600
114,500
112,800
If we go below this level then a larger correction thesis would point us with a deeper bearish level
Happy Trading
Trade Smarter Live Better
Mindbloome Exchange
Kris
BTC FOMCOnce Again Ive the same view on BTC
There is a chance that it will go down now towards 113.500 straight so the internal buy towards 122.600 should be taken with low risk
if that level is reached the sell to 113.500 is prettyu much asured and also on 113.500 the buy to all time highs 127.500 and 133.000
GG
BTC AI Prediction Dashboard - 6h Price Path (30.07.25)
Prediction made using Crypticorn AI Prediction Dashboard
Link in bio
BTCUSDT Forecast:
Crypticorn AI Prediction Dashboard Projects 6h Price Path (Forward-Only)
Forecast timestamp: ~10:45 UTC
Timeframe: 15m
Prediction horizon: 6 hours
Model output:
Central estimate (blue line): -118,306
Represents the AI’s best estimate of BTC’s near-term price direction.
80% confidence band (light blue): 118,086 – 118,670
The light blue zone marks the 80% confidence range — the most likely area for price to close
40% confidence band (dark blue): 117,520 – 119,603
The dark blue zone shows the narrower 40% confidence range, where price is expected to stay with higher concentration
Volume on signal bar: 80.50
This chart shows a short-term Bitcoin price forecast using AI-generated confidence zones.
Candlesticks reflect actual BTC/USDT price action in 15-minute intervals.
This helps visualize expected volatility and potential price zones in the short term.

BTC USDT Forming Head and shoulder in 5 MinChart Breakdown
🟢 Pattern:
Left Shoulder: 118,450
Head: ~118,600
Right Shoulder: ~118,400
Neckline: Sloping slightly upward, around 118,050
📌 Bearish Breakdown Scenario
If BTC breaks below the neckline (~118,000) with volume, the expected drop (measured move) is:
Height of pattern:
Head (118,600) – Neckline (118,000) = 600 pts
Target on breakdown:
118,000 – 600 = ~117,400
🔻 Target: 117,400–117,300
🔒 Invalidation: Price closes above 118,300 with strong volume.
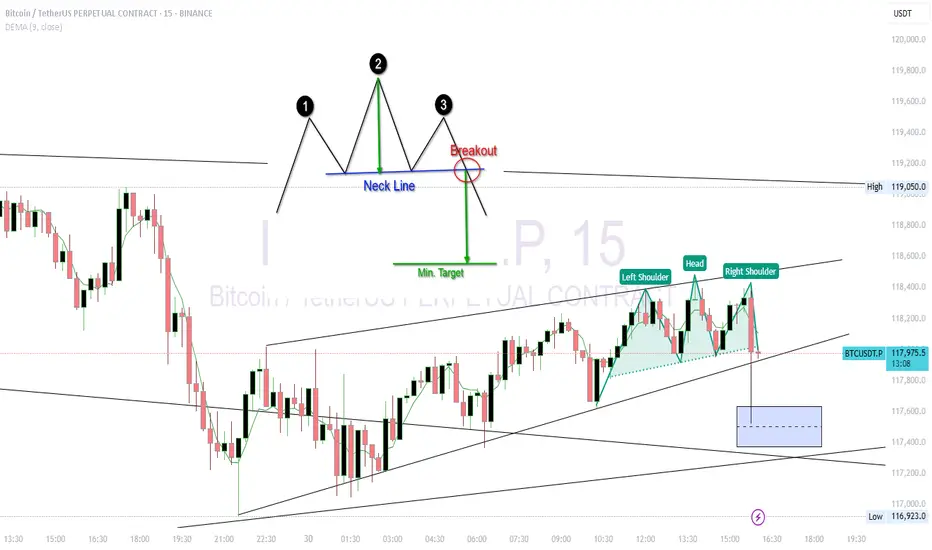
Chart Analysis (2h Timeframe)✅ Chart Analysis (2h Timeframe)
MY using Ichimoku Cloud, support/resistance zones, and trend lines.
Price is currently around 118,319 USD.
It has broken out of the Ichimoku cloud and is respecting the trendline support, indicating bullish momentum.
---
🎯 Upside Target Levels
🔵 Target 1:
Level: ~120,000 USD
Reason: Horizontal resistance (clearly marked)
Action: Minor profit-taking or partial exit
🔵 Target 2 (Main):
Level: ~122,000 USD
Reason: Second resistance zone & projected move from breakout
Action: Ideal full target zone
---
🔻 Support & Invalidations
🟡 Immediate Support Zone:
Levels:
118,404
118,296
118,065
These are dynamic Ichimoku & short-term support levels
BTCUSDT.PThe best area to buy MARKETSCOM:BITCOIN is $119,000 and wait for the pullback to be complete.
But for selling and shorting, be sure to wait for $115,000 to break down.
⚠️Please control risk managements.

DXY FOMC FORECASTCristal Clear structure to me, dolar down today before FOMC and then up wild
Levels highlighted
Najors Gold and Cryptos will follow the same behavior
GG
Bitcoin - The cycle is just starting!⚔️Bitcoin ( CRYPTO:BTCUSD ) just created new highs:
🔎Analysis summary:
Bitcoin is currently - especially with the new all time high breakout - just perfectly following previous cycle behavior. Since there is no real resistance above current price, apart from psychological levels, I do expect a substantial rally back to the upper channel resistance trendline.
📝Levels to watch:
$300.000
🙏🏻#LONGTERMVISION
Philip - Swing Trader

$USDT Dominance Breakdown Soon?Here’s a quick take on the CRYPTOCAP:USDT.D 1H chart: USDT dominance is bumping into a key trendline around 4.28%, right below strong resistance at 4.30%.
If it gets rejected here, we could see a drop toward 4.18%, which would be a healthy sign for altcoins.
But if dominance breaks above 4.30% with a strong candle close, that bearish setup gets invalidated.
Keep an eye on this zone, it’s a make-or-break moment.
DYOR, NFA

BTCUSD IdeaWe are waiting for our asset to reach our action zone, and based on the reaction, we’ll decide on our next moves.ALWAYS WAIT FOR A CONFIRMATION TO SEE IF THE PRICE VALIDATES THE ZONE.and you what is your vision of the EURUSD its interests me! i wait you in the commentary

BITCOIN PREDICTION - MASSIVE CANDLE INCOMING!!! (WARNING) Watch this Bitcoin Prediction video now, you will love it!
Yello, Paradisers! Big warning sign: #Bitcoin is about to liquidate more traders soon if we get these confirmations that I'm sharing with you in this video. Loads of people will get wrecked again. Be careful not to get trapped into fakeouts.
In this video, I'm describing exactly what I'm seeing on Bitcoin, what patterns I'm waiting to form, and what confirmations I want to see before being able to say with 100% accuracy guaranteed that MARKETSCOM:BITCOIN is moving in that direction.
I'm sharing with you all the important targets and also how professional trading works: how risk-reward proper ratio trading works, and how high-probability trading depends a lot on how you choose to create your trades.
Watch this Bitcoin prediction to understand what I'm seeing right now on the chart and how I'm acting and making my decisions.

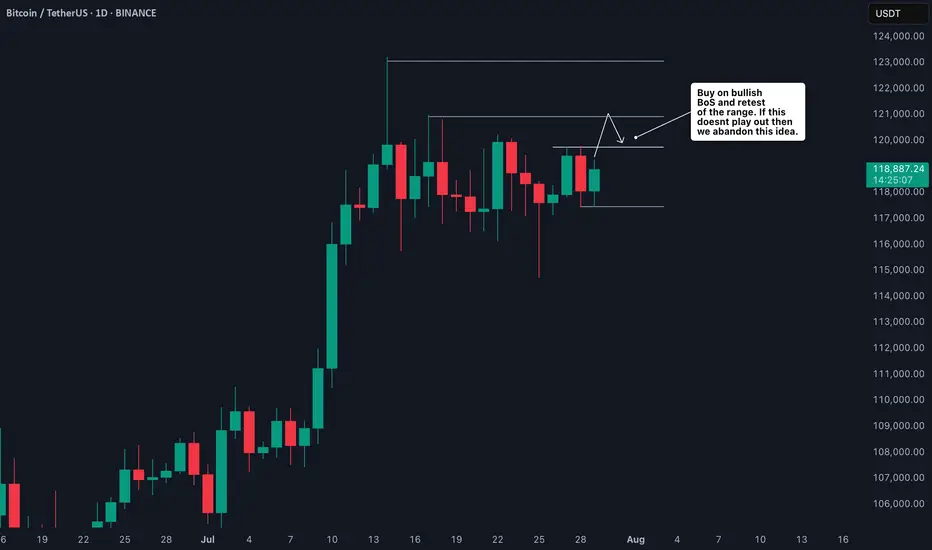
BTC Trade Plan: Watching for Break and Retest Above Daily Range🟠 Bitcoin (BTC) is currently trading range-bound on the daily timeframe ⏳📉📈. I’m monitoring price action for a bullish break and retest 🔓🔁 of the current range to confirm a potential long entry 🎯.
📍 Key levels are already marked on the chart 🗺️—
🛑 Stop-loss would sit just below the previous swing low,
🎯 Target aligns with the higher price zone marked out to the left of the chart 🔼👈.
This is a classic range breakout setup—patience and precision are key.
🧠 As always, this is not financial advice.
BTC- Following the TrendLine since YEARS, ExactlyYear on Year , each cycle BTC is adhering to this trend line, and also hit the 2 FIB EXACTLY for now - rejected there. It must cross this to test higher levels, but that may need a few weeks more of sideways moves. Keep a watch cause another rejection at this trend line will probably indicate we are not going higher.

BULL FLAG - Aug 1st Price prediction $121,300 In the interim, the bull flag pattern can be delineated as follows based on the uploaded chart: The flagpole is represented by the upward surge from approximately $113,332 (near the green label at the chart’s lower left) to around $121,351 (inferred from the upper candlestick highs and the red label near 121,351.18). The flag portion consists of a downward-sloping channel, with the upper trendline connecting the recent highs at roughly $120,500 to $118,000, and the lower trendline linking the pullback lows from about $118,500 to $116,700. A breakout above the upper trendline ($118,500–$119,000) would project an upward extension equivalent to the flagpole’s length (approximately $8,000), targeting $126,000–$128,000 in the near term, assuming confirmation through increased volume and sustained support above $116,700.
Regarding the daily price forecast from July 28, 2025 (Monday), through August 1, 2025 (Friday), the projections are derived from the bull flag continuation pattern, cross-referenced with aggregated analyses from recent market data, technical indicators (such as RSI and MACD showing neutral-to-bullish momentum), on-chain metrics (indicating accumulation at $115,000–$117,000), and a distribution of expert predictions. These include short-term consolidation with a potential dip for liquidity clearance, followed by a breakout, aligning with historical post-halving cycles and institutional inflows. Note that cryptocurrency prices are inherently volatile and influenced by factors such as Federal Open Market Committee outcomes, ETF flows, and macroeconomic events; these forecasts are speculative and not financial advice.
• July 28, 2025 (Monday): Anticipated consolidation within the flag channel amid low weekend volume. Expected range: $116,800–$118,500. Key targets: Support at $116,700 (lower flag boundary, potential entry for accumulation); resistance at $118,500 (upper flag line, breakout watch level). Average closing prediction: $117,800, reflecting neutral sentiment with minor downside risk if global markets weaken.   
• July 29, 2025 (Tuesday): Possible test of lower support amid early-week volatility, potentially sweeping liquidity before rebounding. Expected range: $116,000–$119,000. Key targets: Downside at $116,000 (critical on-chain accumulation zone); upside at $119,000 (initial breakout threshold). Average closing prediction: $117,500, with a 40% probability of a brief dip followed by stabilization.   
• July 30, 2025 (Wednesday): Breakout attempt likely if support holds, driven by mid-week momentum and potential dovish policy signals. Expected range: $117,500–$120,500. Key targets: Support at $117,000 (mid-channel level); resistance at $120,000 (psychological barrier and prior high). Average closing prediction: $118,900, assuming bullish confirmation above $118,500.   
• July 31, 2025 (Thursday): Extension of upward movement post-breakout, with volume potentially increasing. Expected range: $118,500–$122,000. Key targets: Support at $118,000 (retest of breakout level); resistance at $121,000 (flagpole projection start). Average closing prediction: $120,200, supported by technical alignment and ETF inflow trends.   
• August 1, 2025 (Friday): Momentum continuation toward weekly close, with risk of profit-taking. Expected range: $119,500–$123,500. Key targets: Support at $119,000 (new floor post-breakout); resistance at $123,000 (extended target based on pattern measurement). Average closing prediction: $121,800, aligning with broader bullish forecasts for early August.   

Navigating BTC Tremors on the Path to a Million Dollar New Bitcoin Paradigm: Navigating Short-Term Tremors on the Deliberate Path to a Million-Dollar Valuation
The Bitcoin market is currently a paradox, a theater of conflicting signals where short-term jitters coexist with audacious, long-term prophecies. On one hand, the price experiences sharp, gut-wrenching drops, with a recent dip to $118,000 attributed to institutional selling, sending waves of anxiety through the retail sector. On the other, the world’s most formidable financial institutions are issuing forecasts that seem to border on the fantastical, with one Wall Street banking giant boldly predicting a $200,000 Bitcoin by the end of December. This schizophrenic market sentiment is the new normal for an asset in the midst of a profound transformation. Bitcoin is no longer the fringe digital curiosity of a decade ago; it is a maturing global asset class being integrated into the very heart of the traditional financial system. This integration brings with it immense capital, but also new complexities and a different rhythm of growth. The story of Bitcoin today is one of navigating immediate volatility, fueled by market maker games and institutional repositioning, while keeping an eye on a future where corporate adoption, macroeconomic shifts, and a new, more deliberate growth pattern could methodically pave the way to a once-unthinkable $1,000,000 valuation.
The current landscape is a confluence of powerful, often opposing, forces. While institutional capital is the primary engine of this bull cycle, it is also a source of calculated selling pressure. At the same time, a steady drumbeat of corporate adoption continues, with companies like the UK-based The Smarter Web Company quietly adding hundreds of Bitcoin to their balance sheets. This is happening against a backdrop of favorable macroeconomic tailwinds, including what some are calling the "biggest trade deal ever" sealed by the United States, an event that subtly reinforces Bitcoin's role as a neutral, global store of value. And just when the narrative seems set, a new player like the mysterious "WeWake" enters the stage with a "big launch" that stuns investors, hinting at a new frontier of consumer-level adoption that could dwarf previous catalysts. This intricate dance between short-term technicals and long-term fundamentals defines Bitcoin's current journey—a journey that is less about the parabolic explosions of the past and more about a calculated, powerful ascent.
The Immediate Battleground: Volatility, Support, and the $123,000 Squeeze
To understand Bitcoin's path to six figures and beyond, one must first dissect the trench warfare happening at current price levels. The recent plunge to $118,000 served as a stark reminder that the road up is paved with volatility. While alarming, this dip was not seen as a catastrophic failure by seasoned analysts, but rather as a textbook example of institutional mechanics at play. Unlike retail investors who may hold with unwavering conviction, institutional desks are constantly managing risk, rebalancing portfolios, and taking profits to meet quarterly targets. The selling that triggered the drop was likely not a sign of lost faith, but a strategic repositioning, shaking out over-leveraged positions and creating liquidity for larger players to re-enter at more favorable prices.
This is precisely where the concept of the "ideal long zone" comes into play. For bullish traders and institutions, these orchestrated dips are not a crisis but an opportunity. An "ideal long zone" is a price range where multiple technical support indicators converge, creating a high-probability area for a price reversal. This zone might be defined by a combination of a key moving average (like the 50-day or 200-day), a significant Fibonacci retracement level drawn from a previous major low to a high, and a historical price range where the asset has previously found strong buying support. The fact that bulls were able to gain traction in this zone following the $118,000 dip indicates that this calculated selling was met with equally calculated buying. The market is currently engaged in a reversal campaign with an initial, modest target of reclaiming the $121,000 level, a crucial psychological pivot point.
However, a far more explosive scenario is brewing just beneath the surface: the potential for a massive short squeeze. Market makers, the large entities that provide liquidity to exchanges, are reportedly setting a "trap" for traders betting against Bitcoin. A short squeeze is a powerful market phenomenon that occurs when a heavily shorted asset begins to rise in price. The initial price increase forces short sellers to buy back the asset to close their positions and cut their losses. This wave of forced buying creates a feedback loop, driving the price even higher and forcing more short sellers to capitulate. It's a cascade of liquidations that can lead to rapid, vertical price movements.
Analysts believe that market makers are intentionally allowing short positions to build up around the current range, creating a pool of rocket fuel. The target for igniting this fuel appears to be a decisive break above $123,000. If Bitcoin can push past this level, it could trigger a chain reaction of short liquidations, propelling the price upwards with violent speed. This is not organic buying pressure but a technical event driven by market structure.
Looking at the week ahead, two primary scenarios emerge from this tense setup. The bullish scenario involves Bitcoin successfully bouncing from the current support zone, holding its ground, and making a concerted push towards $123,000. A break of this level would likely trigger the short squeeze, leading to a rapid retest of recent highs and potentially pushing into the $125,000-$130,000 range. The bearish scenario, conversely, would see Bitcoin fail to hold this "ideal long zone." A break below the recent lows around $118,000 would invalidate the immediate bullish thesis, suggesting that the institutional selling pressure is more significant than anticipated. This could lead to a deeper correction, potentially testing support levels closer to $100,000-$110,000. The outcome of this short-term battle is critical, as it sets the stage for the remainder of the year and will determine whether the more ambitious price targets remain in play. Adding to the tension, the market is heading into August, a month that analysts have flagged as being filled with potential volatility catalysts, from central bank policy announcements to major options expiry dates, ensuring that the current state of high alert will persist.
The Wall Street Endorsement: The Race to Six Figures by Year-End
While traders battle over short-term levels, Wall Street has its eyes fixed on a much grander prize. The narrative of this bull run has been fundamentally defined by the legitimization of Bitcoin as an institutional asset, and the price targets now emanating from the heart of traditional finance reflect this new reality. In a stunning vote of confidence, a major, unnamed banking giant has put forth a research note predicting that Bitcoin could reach an astonishing $200,000 by December of this year.
This is not a casual prediction from a rogue analyst; it represents a calculated forecast from an institution with immense resources and influence. Such a bold call from a pillar of Wall Street signifies a deep conviction in the asset's trajectory, likely based on proprietary models of capital inflows from ETFs, corporate treasuries, and high-net-worth individuals. It serves as a powerful signal to the rest of the financial world, effectively giving institutional clients the green light to allocate significant capital to Bitcoin. This prediction, along with a growing consensus that Bitcoin is expected to exceed $150,000 by the end of the year, creates a powerful psychological anchor. When institutions of this caliber set such high targets, they can become self-fulfilling, as asset managers and funds feel compelled to gain exposure, lest they miss out on the anticipated rally.
These bullish forecasts are not based on sentiment alone; they are supported by increasingly sophisticated on-chain analysis. One of the most-watched metrics in this cycle is the MVRV (Market Value to Realized Value) ratio. In simple terms, the MVRV ratio compares Bitcoin's current market price to the average price at which all coins in circulation were last moved. When the ratio is high, it suggests the market is overheated and holders are in significant profit, increasing the likelihood of selling. When it's low, it suggests the asset is undervalued.
Analysts have taken this a step further by creating MVRV Pricing Bands. These bands represent standard deviation levels above and below the "realized price," creating a data-driven framework for identifying potential market tops and bottoms. Currently, these pricing bands are hinting at a cycle peak valuation of around $130,000. This provides a more conservative, data-grounded target that aligns with the lower end of the Wall Street predictions. However, this on-chain model comes with a critical caveat: it is only valid if Bitcoin's price holds its current macro support level. This elegantly connects the long-term on-chain outlook with the immediate price battle discussed earlier. A failure to hold the line in the short term could invalidate the assumptions underpinning these models, forcing a recalibration of year-end targets. The path to $130,000, $150,000, or even $200,000 is contingent on winning the present fight.
The New Adoption Paradigm: Corporate Strategy, Macro Shifts, and the "WeWake" Wildcard
The fuel for Wall Street's bullish fire is coming from tangible, real-world adoption. The trend of corporations adding Bitcoin to their balance sheets, pioneered by MicroStrategy, is quietly but powerfully continuing. A recent example is The Smarter Web Company, a UK-based firm that recently announced the addition of 225 BTC to its holdings. While not on the scale of a multi-billion dollar purchase, this move is incredibly significant. It demonstrates that the corporate treasury thesis is expanding beyond a few high-profile early adopters and is becoming a global phenomenon, embraced by small and medium-sized enterprises who view Bitcoin as a superior long-term store of value and a hedge against currency debasement. Each of these purchases, while small individually, collectively contributes to a persistent supply shock, as more coins are moved from the open market into corporate treasuries for long-term holding.
This steady corporate accumulation is occurring against a highly favorable macroeconomic backdrop. News that the United States has successfully sealed what some insiders are calling the "biggest trade deal ever" is being interpreted as a significant long-term tailwind for Bitcoin. Large-scale international trade agreements often involve complex currency fluctuations and settlements. In a world of increasing geopolitical friction and competitive currency devaluations, Bitcoin's properties as a neutral, apolitical, and globally accessible settlement asset become increasingly attractive. Such trade deals can increase global liquidity and put pressure on national currencies, subtly reinforcing the value proposition of a decentralized, non-sovereign store of value.
Just as the market was beginning to digest this new landscape of institutional flows and macro support, a wildcard has entered the fray. A company named "WeWake" has reportedly stunned investors with a "big launch," creating a new, unexpected catalyst. While details remain scarce, the market chatter suggests WeWake is not another financial firm or institutional player, but a major consumer-facing technology company. The speculation centers on a groundbreaking integration of Bitcoin's Lightning Network for micropayments within a massively popular application or service.
If true, this would represent a paradigm shift in adoption. To date, the primary use case driving this cycle has been Bitcoin as "digital gold"—a store of value for institutions and corporations. The WeWake launch hints at the reawakening of Bitcoin's other primary narrative: a peer-to-peer electronic cash system. A successful, large-scale consumer integration would prove that Bitcoin can function not only as a reserve asset but also as a transactional currency for everyday use, opening up an entirely new dimension of demand. The shock and excitement from this launch stem from its potential to onboard millions of new users to the network, not as investors, but as active participants in a new digital economy. This move from passive investment to active utility could be the key to unlocking the next major phase of exponential growth.
The Long Road to a Million: A Mature Asset's "Pump and Consolidate" Journey
With year-end targets of $200,000 now part of the mainstream conversation, the once-fringe prediction of a $1,000,000 Bitcoin is being re-evaluated with newfound seriousness. However, a key analyst has offered a crucial insight that reframes this journey: "The days of parabolic Bitcoin bull runs are over." This statement may sound bearish, but it is, in fact, a sign of Bitcoin's profound maturation as an asset class. The wild, untamed, 100x rallies of the early cycles, driven by retail mania and a lack of liquidity, are being replaced by a more structured and powerful, albeit less explosive, pattern of growth.
The new path to $1,000,000, according to this expert view, will be a "slow and steady" process defined by a "pump and consolidate" pattern. This model envisions a market that behaves less like a volatile penny stock and more like a blue-chip technology giant. The "pumps" will be powerful, rapid upward movements, but they will be driven by specific, fundamental catalysts—the approval of a new wave of ETFs, a landmark corporate adoption by a Fortune 100 company, a major nation-state adding Bitcoin to its reserves, or a successful consumer integration like the one hinted at by WeWake.
Following each of these catalyst-driven pumps, the market will enter a prolonged "consolidate" phase. Instead of a dramatic crash, Bitcoin will establish a new, higher plateau of price discovery. During these consolidation periods, which could last for months, the market will build liquidity, institutional players will accumulate and distribute positions, and the new price level will be normalized and accepted as a baseline. This creates a far more stable foundation for the next leg up. This methodical, stair-step ascent is the hallmark of a mature market with deep, two-sided liquidity provided by institutional players who both buy and sell, preventing the extreme parabolic blow-off tops and subsequent 80-90% crashes of the past.
This "pump and consolidate" model makes the journey to $1,000,000 seem not only more plausible but almost inevitable, assuming the underlying drivers of adoption continue. It is a path built on structural strength rather than pure speculation. Each consolidation phase absorbs selling pressure and builds a stronger floor, making the entire structure more resilient to shocks.
In conclusion, Bitcoin stands at a fascinating and pivotal juncture. It is weathering the short-term storms of institutional profit-taking and the intricate games of market makers, fighting to establish a firm footing above the critical $120,000 level. At the same time, its long-term trajectory is being underwritten by the full faith and credit of Wall Street, with audacious year-end targets of $150,000 to $200,000 now serving as the institutional base case. This optimism is fueled by a relentless wave of corporate adoption and favorable macroeconomic winds, and has been supercharged by surprising new catalysts that hint at a future of mass consumer utility.
The ultimate destination may be the long-fabled million-dollar mark, but the journey will look different this time. The wild, parabolic arcs of youth are giving way to the measured, powerful, and deliberate steps of a mature global asset. The "pump and consolidate" rhythm is the new heartbeat of a market driven by institutional capital and fundamental adoption. While the path will undoubtedly be fraught with volatility, corrections, and periods of agonizing consolidation, the underlying narrative has never been stronger. Bitcoin is navigating the tremors of the present as it builds the foundations for a truly monumental future.
While we see markets fall, lets remember - FED on 30th
When you look on 1 hour or 4 hour charts, our hearts miss a beat...
"Bitcoin is Crashing"
But as you can see on a weekly chart, it really is nothing more than a little hiccup...not even that !
We can drop to 110K before you need t really watch
This cycle has seen so many similar instances.
But we do need to be alert to make sure this fall does on continue for what ever reason
But when we remember that on Wednesday, the FED gives us the rate decision for the USa, it all becomes clear, because this happens almost everytime before a rate decision is announced.
The chart above is the daily smapshot of a weekly chart I have been posting since 2021, about Rate Announcements by the FED.
You can see the red candles before each occasion, the Red vertical lines being approx the day the FED announced the decision. ( Approx as it is a weekly chart normaly and I do not "Zoomin" to get the day count perfectly as it becomes lost when I came back out to a week chart)
But you get the idea
do not panic
This is the weekly chart of that FED RATE effects in Bitcoin PA....over all..NO EFFECT
The effect has always been on the companies that can provide bitcoin
So, Keep your Cool. anf HOLD BITCOIN

BITCOIN Current Update !!!we are heading towards support region around 116.8k-115k from where we can expect a reversal.
If price breaks down 115k level then a bat harmonic pattern is also forming which indicates it's PRZ at 113-112k region...
Remember 121k is key level which needs to be broken in order to remain bullish !!!
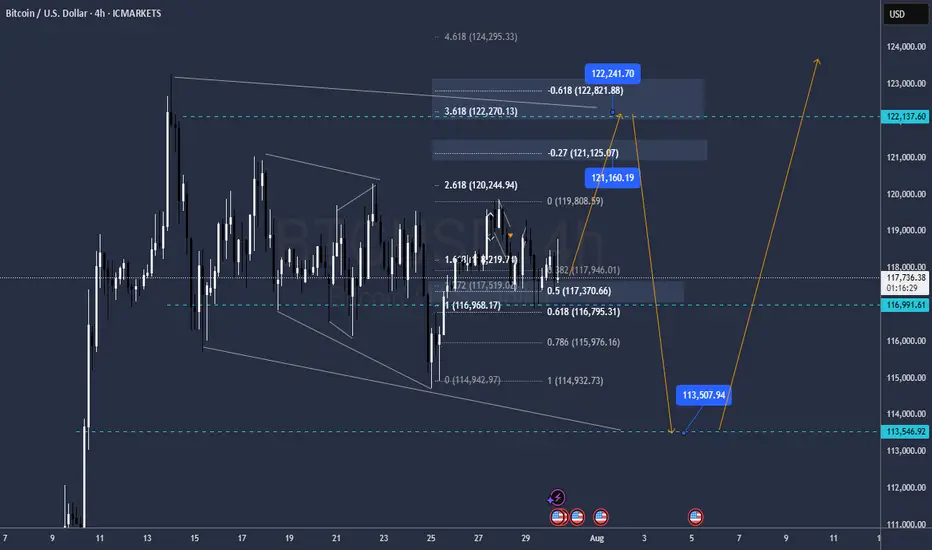
BTC new meassuresokay impulse is pretty much clear
buy level 117.250 Targtting 121.100 / 122.200 / 122.800
Sell level 122.200 targetting 113.500
Re buy level 113.500 targetting 127.500 / 133.000
GG
BTC Roadmap Ahead: Ideal Entry, TP Zones & What to AvoidAs long as Bitcoin stays above the ~$98,200 zone on the daily timeframe, I believe the bullish trend remains intact.
No need to panic — what we need now is rational decision-making, not emotional reactions.
Since price has reached a key area around $118K–$120K, I’ve already taken partial profits at this level.
If no major fundamental changes occur and conditions remain stable, I see the maximum target for this leg somewhere between $134K and $140K, where I plan to secure additional profits.
Right now, my main objective is to increase my Bitcoin holdings.
The first buy zone I’m watching is around $110K, clearly marked with a red circle on the chart.
When price reaches this zone, I won’t enter immediately — I’ll wait for consolidation and confirmation, as a deeper correction is still possible.
There’s no need to rush — patience is power.
📌 All I’m trying to do is accumulate as much Bitcoin and sats as I can — because I know one day, I’ll be proud of it.
🔁 This analysis will be updated whenever necessary.
Disclaimer: This is not financial advice. Just my personal opinion.

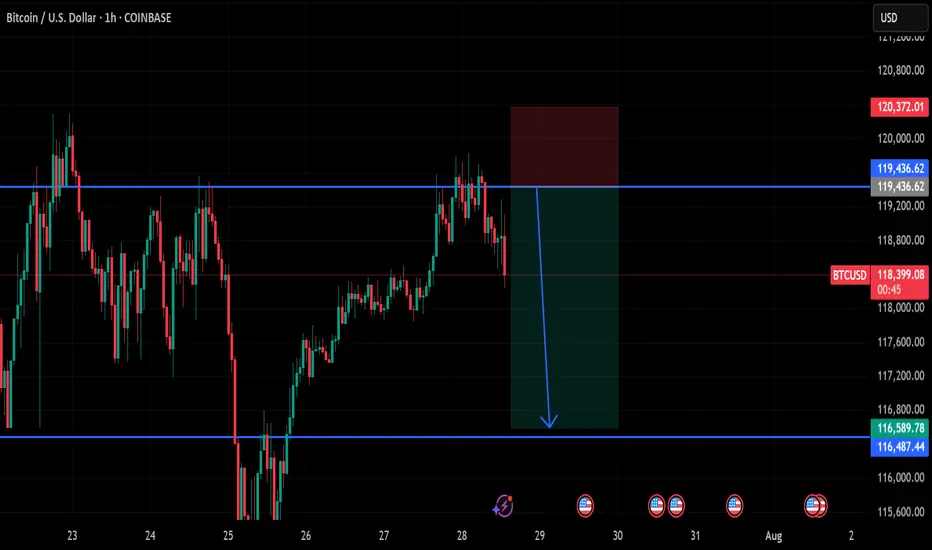
btc on selling#BTCUSD on multiple price rejection at 119k,now we await final touch before a fall below 116487-110k.
Sell at 119436, target 116487-110k, stop loss 120372.
Bullish range isn't strong