BTCUSDT NEXT Impulse !Hi fellow traders, BTCUSD will be ready to make a move higher from the blue box after it completes the expanding flat pattern in a WXY formation. Target will be 113604.87 USD. Good luck and trade safe!
Btcusdanalysis

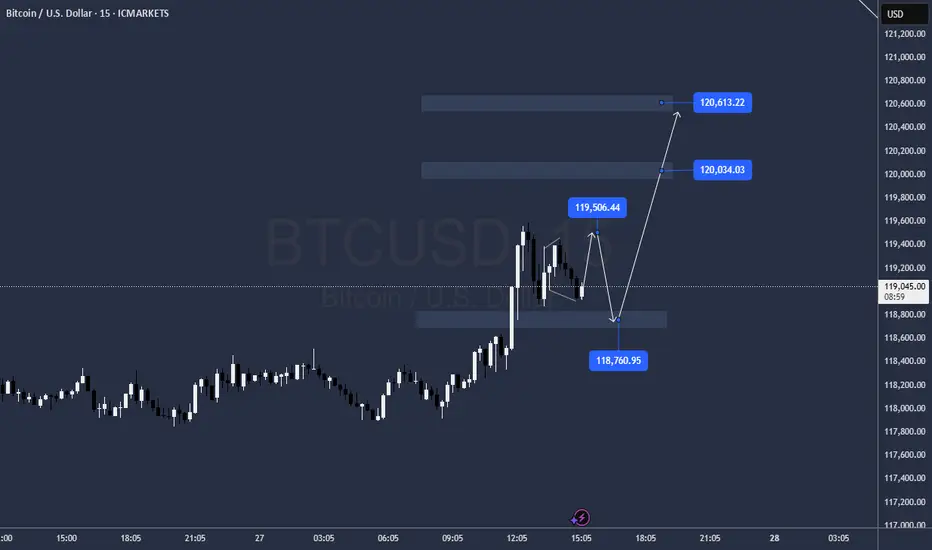
BTC-----Buy around 119000, target 120000-1205000 areaTechnical analysis of BTC contract on July 28:
Today, the daily level of the large cycle closed with a small positive line yesterday, the K-line pattern continued to rise, the price was above the moving average, and the attached indicator was dead cross. The general trend of rising is still very obvious, but from the trend law, it is not a very strong trend at present. The trend of oscillating upward and range is highly likely. In this case, we must find a good rhythm for trading, keep short-term, and don’t be greedy, otherwise it is easy to have profit-taking problems; the short-term cycle hourly chart yesterday’s US market rose and then fell under pressure to correct the low position near the 118700 area. The current K-line pattern is continuous, and the price is at a high level. The attached indicator is golden cross and shrinking. In general, the trend is still strong and the retracement is relatively small. If we look at the continuation of the rise today, it is still the old rule. The retracement cannot be large and cannot break the intraday low.
Today’s BTC short-term contract trading strategy:
Trade in the 119000 area when retreating, stop loss in the 118500 area, target 120000 and break to the 120500 area;

BTC on 4H
"Hello, focusing on BTC on the 4-hour chart, the price is currently in a bullish momentum on higher time frames. However, it is showing signals indicating a potential completion of its pullback to the $110,000 zone. In my opinion, the $122,000 zone could be a good area to consider a sell position, with confirmation on the 15-minute chart. I plan to wait for this zone and then decide on initiating a sell position. If you have any updates or alternative perspectives on this analysis, please feel free to share."
If you need further clarification or have more details to discuss, please let me know!

Double Bullish Flag on Bitcoin — Next Rally to $135K?📊 BTCUSDT (12H) In-Depth Analysis: Major Momentum Brewing
Bitcoin (BTC) is currently exhibiting a very promising technical structure — a Double Bullish Flag, a rare yet powerful continuation formation that often precedes strong upside momentum.
This dual-pattern structure reflects market strength and smart accumulation, with bulls maintaining control while allowing for healthy pauses before potential expansion to higher levels.
---
🔍 Technical Breakdown: Double Bullish Flag Structure
🔸 1. Primary Bullish Flag:
Formed after a sharp rally from around $95,000 to $113,000 (flagpole).
Price then consolidated within a clear descending channel, forming a classic Bullish Flag pattern.
Breakout from this pattern occurred in early July, confirming bullish continuation.
🔸 2. Secondary Bullish Flag (Mini Flag):
After the breakout from the main flag, BTC formed a second smaller flag pattern — a narrow descending channel from ~$123K to ~$119K.
This is known as bullish flag stacking — a pattern of "flag on top of flag", signaling trend strength and smart consolidation.
This mini-flag now acts as a launchpad for the next potential breakout.
---
🚀 Bullish Scenario: Preparing for a Breakout
If BTC breaks above the upper resistance of the mini flag (~$123,200), it will signal a fresh bullish continuation.
🎯 Potential Upside Targets:
Conservative target: $126,000 – $128,000
Full measured move target (from flagpole): $132,000 – $135,000
✅ Confirmation criteria:
Strong candle close above $123.2K
Accompanied by rising volume and upward RSI momentum (but not overbought)
---
🧨 Bearish Scenario: Breakdown and Retest
If BTC fails to break above the flag and instead drops below the flag support (~$119,400), we may see a short-term correction.
🔻 Key Support Levels:
$117,000 – minor horizontal support
$113,000 – $115,000 – strong demand zone and previous breakout area
⚠️ As long as price holds above $113K, the broader bullish trend remains intact. A pullback to this zone could offer a prime retest-buying opportunity.
---
📌 Key Price Levels to Watch:
Level Role
$123,200 Mini-flag resistance (breakout trigger)
$121,600 Mid-range resistance
$119,400 Flag support
$117,000 Horizontal retest zone
$113,000 Major support (trend invalidation if lost)
$132K – $135K Projected breakout target
---
💡 Conclusion: BTC in Critical Zone Before Potential Expansion
This Double Bullish Flag formation is one of the most technically constructive setups BTC has shown in weeks. It reflects a strong, patient market — with bulls preparing for another leg higher.
If the breakout from the second flag confirms, Bitcoin could rally toward $135,000, backed by momentum, volume, and clean structure. However, a breakdown would only signal a short-term cooldown unless support at $113K is lost.
🧭 Stay focused on breakout confirmation, volume spikes, and market sentiment. This could be the calm before a bullish storm.
#BTCUSDT #BitcoinBreakout #BullishFlag #TechnicalAnalysis #DoubleBullFlag #BTCMomentum #BitcoinRally #CryptoOutlook #BitcoinTo135K

#Bitcoin – What’s Really Happening? Daily Structure + Macro#Bitcoin – What’s Really Happening?
Daily Structure + Macro Setup = Big Move Loading
🔸 1D Chart: CRYPTOCAP:BTC Range-Bound Between $125K–$110K
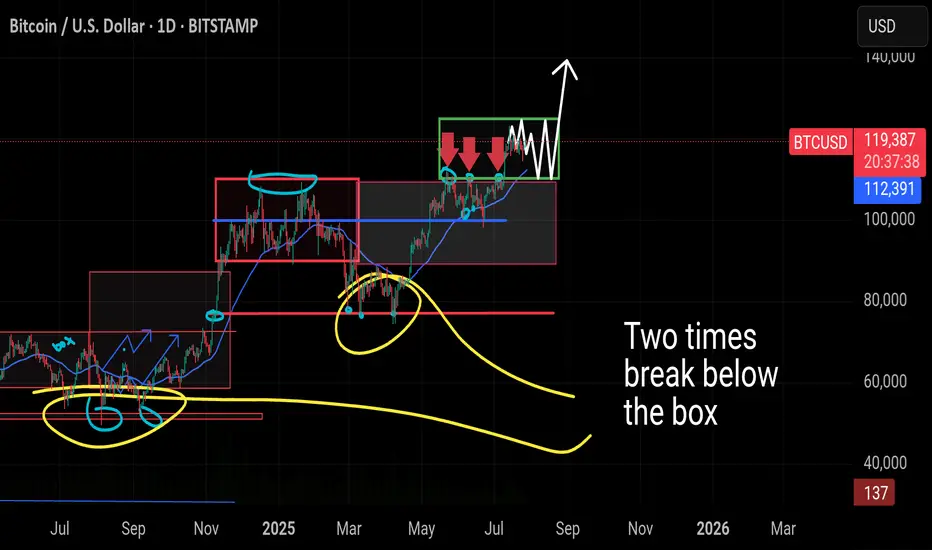
Bitcoin is currently trading inside a tight sideways range, marked by resistance near $125,000 and support around $110,000. This is now the third time we've seen price consolidate in this green zone.
🔸 In the previous two attempts, BTC briefly dipped below support before quickly reclaiming the level — classic fakeouts, not real breakdowns. The current price behavior mirrors that same structure.
🔸 What If CRYPTOCAP:BTC Drops Again?
A dip below $110K or even toward $100K should not trigger panic. Historically, these wicks below the range are liquidity grabs — not signs of weakness. As long as the 200 MA holds and price doesn’t sustain under $100K, the macro trend remains bullish.
🔸 Key Zones:
– Immediate support: $112,398
– Major support: $100K psychological level
– Structure invalidation: Sustained loss below $100K (not expected)
🔸 Macro Outlook: Still Bullish
While BTC chops sideways, the broader environment is heating up:
🔸 Trump-EU Mega Trade Deal
Markets just got a major catalyst — a massive U.S.–EU agreement that includes:
– $750B in U.S. energy exports
– $600B in EU investment
– $150B in energy purchases from U.S.
This clears out tariff fears and opens the door for stocks and crypto to run. Risk appetite is returning fast.
🔸 Whale Activity Panic = Noise
Galaxy Digital wallet movement spooked the market temporarily, pushing BTC to $114,500. But zoom out:
– ETF inflows still dominate daily sell volume
– BlackRock continues absorbing supply
– Long-term whales haven’t sold — they’re holding
This was not a breakdown. It was a shakeout. Accumulation is still happening.
🔸 The Real Fuel: M2 Money Supply
Here’s where things really align for the bulls:
– In 2020, a 25% rise in M2 → BTC 800% rally
– In 2025 so far: +2.3% increase, and we’re still in “tightening”
– Largest M2 spike: +0.63% in June
Given BTC typically lags M2 by 60–90 days, the June print is setting up for a 15–17.5% upside over the coming weeks. That puts us on a clear path toward $130,000+
🔸 Bitcoin is sideways, not weak. Range-bound price action is accumulation, not distribution. Macro signals are aligning, M2 is expanding, and whale panic was short-lived.
We’re not just holding a range — we’re coiling for the breakout.
You’re early. Stay ready.
#bitcoin
Bitcoin Weekly Seal at the Threshold 122K - No Gaps, No Retreat.⊣
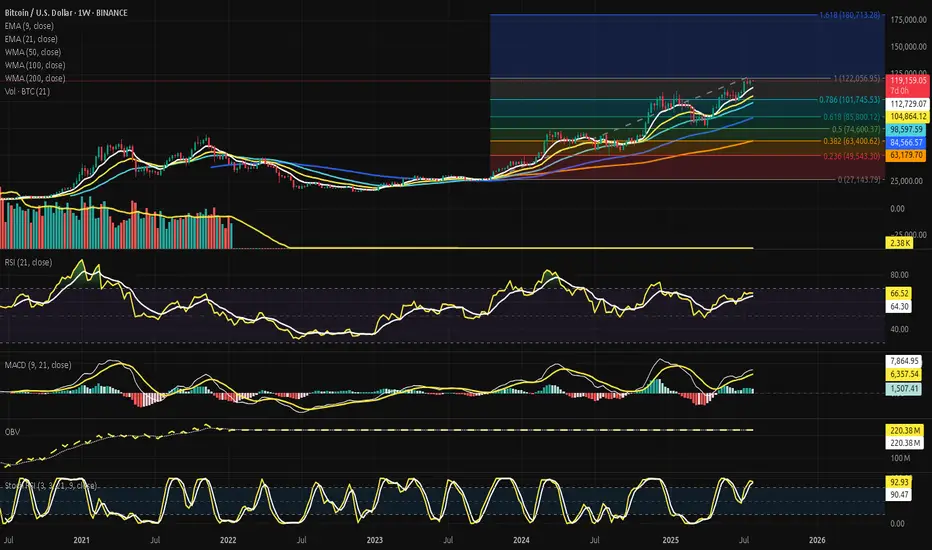
⟁ BTC/USD - BINANCE - (CHART: 1W) - (Jul 27, 2025).
◇ Analysis Price: $119.374,00.
⊣
⨀ I. Temporal Axis - Strategic Interval - (1W):
▦ EMA9 - ($112.771,21):
∴ The weekly close remains above the EMA9, preserving short-term bullish structure;
∴ The EMA9 continues rising at a consistent slope, reflecting sustained upward momentum;
∴ A retracement to this level would represent the first defensive support on a tactical pullback.
✴️ Conclusion: EMA9 acts as a dynamic short-range support and trend continuation marker.
⊢
▦ EMA21 - ($104.883,22):
∴ Price remains notably above the EMA21, confirming structural strength in medium-term trend;
∴ The EMA21 was previously retested during consolidation in Q2 2025;
∴ A weekly close below it would indicate a structural loss of momentum.
✴️ Conclusion: EMA21 confirms medium-term bullish bias as long as preserved.
⊢
▦ WMA50 - ($98.605,81):
∴ WMA50 serves as a major cyclical support and remains untouched since early 2024;
∴ The gap between price and WMA50 indicates strong extension, yet risk of mean reversion rises;
∴ This level aligns with a prior demand zone around ($95K–$100K).
✴️ Conclusion: WMA50 is a latent demand zone - strategic if market reverts from exhaustion.
⊢
▦ WMA100 - ($84.570,72):
∴ This weighted average aligns with the 0.382 Fibonacci level;
∴ A long-term correction toward this band would reflect the depth of macro pullbacks in previous cycles;
∴ Currently distant from price action, but structurally significant if macro volatility increases.
✴️ Conclusion: WMA100 anchors mid-cycle recalibrations and aligns with retracement symmetry.
⊢
▦ WMA200 - ($63.181,79):
∴ The 200-week WMA remains far below price and untouched since early 2023;
∴ This is the ultimate structural support in secular bull cycles;
∴ If revisited, it signals macro-level capitulation or black swan scenario.
✴️ Conclusion: WMA200 holds the foundational line of long-term structural integrity.
⊢
▦ Fibonacci Retracement - (Range from 0 = $27.143,79 to 1 = $122.056,95):
∴ 0.000 = $27.143,79 - Genesis base from Apr 2025 cycle;
∴ 0.236 = $49.543,30 - Psychological line of control in late 2023;
∴ 0.382 = $63.400,62 - Aligned with long-term moving averages;
∴ 0.500 = $74.600,37 - Symmetry pivot of current macro-leg;
∴ 0.618 = $85.800,12 - Golden pocket lower bound;
∴ 0.786 = $101.745,53 - Golden pocket upper edge and structural resistance pre-breakout;
∴ 1.000 = $122.056,95 - Current cycle high (resistance zone);
∴ 1.618 = $180.713,28 - Projected extension target for parabolic continuation.
✴️ Conclusion: Key retracement zones for tactical reactions lie at (0.786 - $101.7K) and (0.618 - $85.8K); upside breakout target confirmed at (1.618 - $180K).
⊢
▦ Volume + EMA21 - (Last: 2.38K BTC):
∴ Volume is stable and slightly rising compared to prior weekly sessions;
∴ No high-volume sell candles indicate panic or exit;
∴ EMA21 on volume shows baseline liquidity remains active.
✴️ Conclusion: Healthy volume confirms orderly continuation rather than climax or exhaustion.
⊢
⨀ II. Momentum & Pressure Indicators:
▦ RSI (21) + EMA9 - (66.71 / 64.34):
∴ RSI approaches the 70-level but remains below overbought territory;
∴ EMA of RSI confirms rising internal strength;
∴ No divergence is observed - internal price energy remains aligned with upward momentum.
✴️ Conclusion: RSI signals strong but not overheated momentum - bulls still in control.
⊢
▦ MACD (9, 21) - (MACD: 7,887.99 | Signal: 6,362.06 | Histogram: +1,525.93):
∴ MACD histogram remains green, showing continuation of bullish trend;
∴ The spread between MACD and Signal is positive and expanding again;
∴ No bearish crossover threat imminent at current slope.
✴️ Conclusion: MACD structure reinforces bullish pressure - trend still intact.
⊢
▦ OBV + EMA9 - (OBV: 220.38M):
∴ OBV remains in an uptrend, supporting price action;
∴ EMA overlay shows no divergence or flattening;
∴ Volume accumulation remains healthy, confirming underlying conviction.
✴️ Conclusion: OBV supports continuation - no signs of distribution.
⊢
▦ Stochastic RSI (3,3,21,9) - (%K: 93.68 / %D: 90.72):
∴ Both %K and %D lines are in the overbought zone (>90);
∴ Crossovers are still bullish but nearing potential exhaustion zone;
∴ Caution warranted for short-term momentum correction.
✴️ Conclusion: Overbought levels reached - watch for tactical slowing, though no reversal confirmed.
⊢
🜎 Strategic Insight - Technical Oracle:
∴ The weekly chart exhibits a structurally intact bull trend, confirmed by the alignment and spacing of EMA's and WMA's across all horizons (short, mid, long);
∴ Fibonacci retracement levels delineate critical reaction zones, with (0.786 - $101.745,53) and (0.618 - $85.800,12) serving as dominant retrace supports in the event of a tactical correction;
∴ The presence of a projected (1.618 extension at $180.713,28) offers a sacred path forward should price breach and sustain above the current high of $122K.
∴ Momentum oscillators (RSI and MACD) continue their upward thrust without divergence, but the Stochastic RSI warns of temporal exhaustion - a typical hallmark before consolidation or rotation;
∴ Volume structure is stable and non-climactic, suggesting continuation rather than blow-off;
∴ No sign of distribution via OBV - accumulation remains intact.
✴️ Conclusion: The market remains within the upper chamber of the Fibonacci spiral. Tactical cooling is possible due to overextension in the momentum field, but no structural damage is observed. A controlled retrace into the golden pocket would be both acceptable and ritualistically symmetrical. The path to $180K remains open, but guarded.
⊣
⟁ BTC/USD - CME Futures BTC1! - (CHART: 1D) - (Jul 27, 2025):
◇ Current Price: $120.785.
◇ Chart Link:
⊣
▦ CME Futures GAP - Observation & Ritual Closure:
∴ The current chart shows a clustered consolidation near $120K–$121K with no immediate upper gap visible;
∴ The last prominent CME Gap was filled during the late June run-up and early July vertical move;
∴ No new gap formed during the weekend-to-weekday open for the last 3 sessions - continuity is intact.
✴️ Conclusion: There is no unfilled CME Gap between the current price and previous sessions. All recent discontinuities appear ritually sealed. Attention now turns to potential downside gaps from rapid bullish impulse moves around ($104K–$108K), which could remain structurally unfilled - unless tactically challenged during correction.
⊢
🜎 Strategic Insight - CME Oracle:
∴ The lack of open CME Gaps suggests a clean technical field - no magnet effect pulling price backward in the short term;
∴ The compression near $121K may precede either an explosive breakout toward the Fibonacci extension ($122K / $130K+), or serve as a false plateau before a tactical flush;
∴ Absence of gaps also removes "gap fill" traders from immediate relevance, allowing price to move freely based on liquidity and macro flows.
✴️ Conclusion: The CME chart confirms no active gravitational pull downward - the battlefield is neutral and favorably clean for bullish continuation, pending macro and liquidity alignment.
⊢
∫ III. On-Chain Intelligence - (Source: CryptoQuant):
▦ Exchange Inflow Total + 9EMA - (All Exchanges):
∴ Exchange inflows remain significantly suppressed, with no spikes above 75K BTC since Q4 2023, despite the price nearing $120K;
∴ The 9EMA of inflows is stable and near local lows, showing no abnormal movement toward exchanges;
∴ Historically, spikes in inflow coincide with distribution, fear, or profit-taking, none of which are currently present on a structural level.
✴️ Conclusion: The on-chain exchange inflow behavior confirms low distribution pressure at current highs. The lack of elevated Bitcoin deposits into exchanges indicates conviction among holders and the absence of a mass selloff attempt, even near critical Fibonacci resistance.
⊢
🜎 Strategic Insight – On-Chain Oracle:
∴ While price consolidates near its cyclical high, exchange inflows remain muted, echoing behavior observed during earlier phases of strong market conviction (e.g., late 2020);
∴ This suggests the market is not preparing for heavy liquidation;
∴ The silence of inflows reinforces the tactical hypothesis that current price action is organic and not panic-driven, preserving the ritual path toward ($122K/$180K).
⊢
⧉ IV. Contextvs Macro-Geopoliticvs - Interflux Economicvs:
▦ US-EU Trade Accord: 1(5% Unified Tariff Across All Sectors):
∴ The United States and the European Union have reached a comprehensive trade agreement, averting escalation: a 15% unified tariff will apply across most EU exports to the US, down from a threatened 30%;
∴ Exceptionally high 50% tariffs remain on steel and aluminum, while some industries such as automotive, semiconductors, and pharmaceuticals will be capped at 15%;
∴ Zero-tariff exemptions have been granted to strategic sectors, including aerospace, select chemicals, semiconductor equipment, agricultural products, and critical raw materials;
∴ In return, the EU has committed to invest $600 billion in US infrastructure and tech, and to purchase $750 billion worth of US energy and defense products over three years.
✴️ Conclusion: The trade pact imposes moderate cost adjustments for key industries but restores transatlantic stability. Although friction remains in sensitive sectors, the agreement prevents global trade disorder and enhances strategic economic visibility.
⊢
🜎 Strategic Insight - Macro Oracle:
∴ The accord mitigates systemic trade risk and clears geopolitical uncertainty, which would otherwise impair market confidence in risk-on assets;
∴ Predictable tariffs (15%/50%) reduce abrupt inflationary shocks, enhancing macroeconomic forecasting and central bank policy latitude;
∴ Massive EU commitments in energy and defense inject transatlantic liquidity and strengthen demand for US dollar-based assets;
∴ While European manufacturers face pressure, the global system benefits from lower volatility and restored economic symmetry;
∴ This opens room for speculative and structural capital to flow more confidently into high-volatility instruments, including crypto assets.
✴️ Conclusion: The macro backdrop reinforces the sacred bullish path - a re-alignment of order in the West, combined with non-disruptive trade stabilization, lays the groundwork for continuation of liquidity-driven risk flows. Bitcoin stands to benefit as a speculative vessel in a structurally stable yet monetarily dynamic environment.
⊢
𓂀 Stoic-Structural Interpretation:
▦ Structurally Bullish - Tactically Watchful:
∴ Price remains above all critical EMA's and WMA's on the 1W chart;
∴ Fibonacci structure is intact, with the $122K high acting as ritual resistance and the (0.786 / 0.618 zone ($101K / $85K) as sacred fallback;
∴ Momentum indicators (MACD, RSI) sustain positive bias with no divergences;
∴ CME Futures show no unfilled gaps - the field is clean, allowing strategic extension.
✴️ Conclusion: The macrostructure supports continuation higher into the sacred extension zone ($130K–$180K), with short-term vigilance warranted due to overbought Stoch RSI and reduced volume velocity.
⊢
▦ Tactical Range Caution:
∴ Upper Limit: $122.056 - Cycle high and Fibonacci 1.0;
∴ Mid Guard: $112.770 - EMA9;
∴ Structural Support: ($101,745 - 0.786) Fib retrace;
∴ Golden Anchor: ($85.800 - 0.618) Fib retrace.
✴️ Conclusion: As long as price remains above $101K, the bullish code remains sealed. Breach of $85K would unlock deeper structural reassessment.
⊢
◩ Codicillus Silentii - Strategic Note:
∴ The week closes at the threshold of the Fibonacci (1.0 mark - $122.056), beneath a ceiling forged by time and belief;
∴ All technical layers are aligned, yet the silence in the inflow, the clean CME field, and macro equilibrium whisper a rarer truth - no storm is seen, but no wind is promised;
∴ This is the zone of the Watcher - where action becomes hesitation, and hesitation becomes discipline.
✴️ Strategic Note & Final Seal: Do not confuse absence of danger with presence of opportunity. A vertical structure with no threat below can still falter from within. This is a time not to act, but to remain unshaken.
⊢
⧉
· Cryptorvm Dominvs · MAGISTER ARCANVM · Vox Primordialis ·
⚜️ ⌬ - Silence precedes the next force. Structure is sacred - ⌬ ⚜️
⧉
⊢
Boom / Usdt GATEIO:BOOMUSDT
BOOM coin — understandable, let’s see what happens next! 🔥👀
Momentum is building, so keep it on your radar. 🚀
⚠️ Disclaimer: Not financial advice. Watch and trade responsibly.

BTC mid term uptdateI will be carefull at 122.000 secure positions and taking profits as one more fall is very possiblo to 113.500 before new all time highs
Levels Highlighted
GG

AI Generated Bitcoin Prediction: No ATH This Week! 📉 AI Generated Bitcoin Prediction: No ATH This Week! 🚫📈
Euphorisme is what traps people... watch out.
📌 Overview
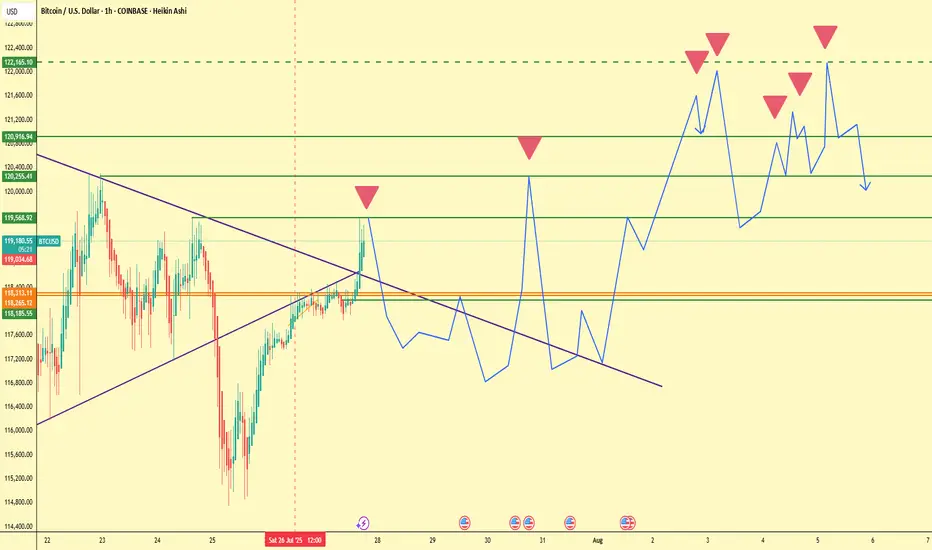
In this 1H Heikin Ashi chart for BTC/USD, a clear AI-generated prediction outlines a volatile week ahead, but with no signs of a new all-time high (ATH). While price action recently broke above key resistance levels around $119,300–$119,570, the projected trajectory is more cautious than bullish.
The blue line overlay sketches a speculative wave structure — an AI-based forecast — suggesting multiple failed attempts to break above $122,165, a level that coincides with previous rejection zones.
🔍 Key Technical Levels
Level Significance
$122,165 Major rejection level
$120,916.94 Resistance + liquidity zone
$119,568.92 Immediate rejection area
$118,313.11 EMA & SMA cluster support
$118,185.55 Short-term support
$117,893.78–$118,037.81 Bull trap range
⚠️ Why You Should Be Cautious
The AI-predicted price action shows a pattern of rising highs followed by sharp reversals.
Multiple red inverted triangles suggest lower high formations, a sign of weakening bullish momentum.
Current levels around $119,300 are still within a macro supply zone, with price likely to consolidate or retrace.
🧠 Psychological Trap: Euphoric Longing
Markets often punish emotional entries — and euphoric breakouts like we saw at $119,500 tend to trigger FOMO longs. This is where smart money exits, not enters.
“If it feels like you're late to the move, you probably are.”
🔄 Mid-Term Scenario
If the AI prediction holds:
Expect volatility with fake breakouts.
Watch for distribution near $122K.
A potential drop toward $118K–$117.8K may offer a better re-entry.
📆 Macro Context
The week is filled with economic events (marked below the chart), and the AI model seems to expect choppy reactions, not a clear breakout. These red calendar icons often correlate with increased volume and traps.
🧩 Strategy Suggestion
Avoid chasing pumps into resistance zones.
Wait for confirmation or deviation from the projected path.
Consider setting alerts near $122K and $118K to monitor key reactions.
🧠 Final Thought:
ATH is a process, not an event. If the AI is right, we’re not there yet.
“Let the herd long the top, and let you short the trap.” – Smart Money
💬 Share your thoughts below. Do you agree with the AI's prediction?
🔔 Follow for more predictive insights & logic-backed analysis.
#Bitcoin #BTCUSD #CryptoTrading #NoATH #SmartMoney #TradingPsychology #EuphoricTrap #HeikinAshi #BTCAnalysis
BTC/USD) bullish trend analysis Read The captionSMC Trading point update
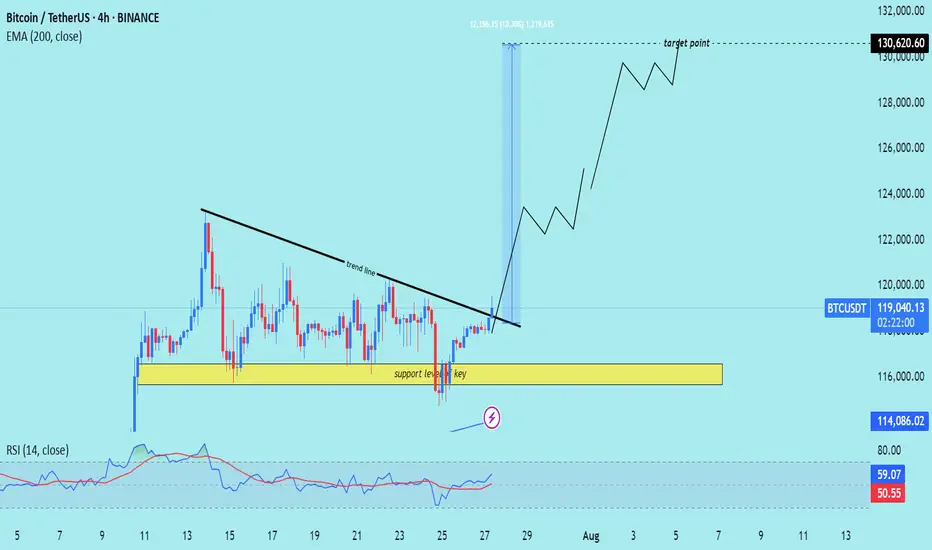
Technical analysis of Bitcoin (BTC/USDT) on the 4-hour timeframe, indicating a potential rally toward the $130,620.60 target zone. Here's the detailed breakdown:
---
Technical Analysis – BTC/USDT (4H)
1. Key Support Level Holding
The yellow zone highlights a strong support zone around $116,000, which has been tested multiple times without breaking.
Marked as “key support level,” it has acted as the foundation for a bullish reversal.
2. Trendline Breakout
A descending trendline was broken decisively with strong bullish candles, signaling a trend reversal.
The breakout was followed by increased momentum and volume, supporting the move higher.
3. Target Projection
The chart shows a projected move up to $130,620.60, labeled as the target point.
This target aligns with a measured move or prior resistance, suggesting a potential swing high objective.
4. 200 EMA Support
Price is well above the 200 EMA (at $114,088.52), confirming the uptrend and acting as dynamic support.
5. RSI Confirmation
RSI is at 60.62, reflecting bullish strength with more room before reaching overbought levels.
Momentum supports the continuation of the uptrend.
Mr SMC Trading point
---
Summary
Bias: Strong Bullish
Current Price: $119,291.13
Support Zone: $116,000 (key area)
Trendline: Broken with bullish confirmation
EMA 200: Acting as solid dynamic support ($114,088.52)
Target Zone: $130,620.60
RSI: 60.62 – bullish with upside potential
---
Please support boost 🚀 this analysis)
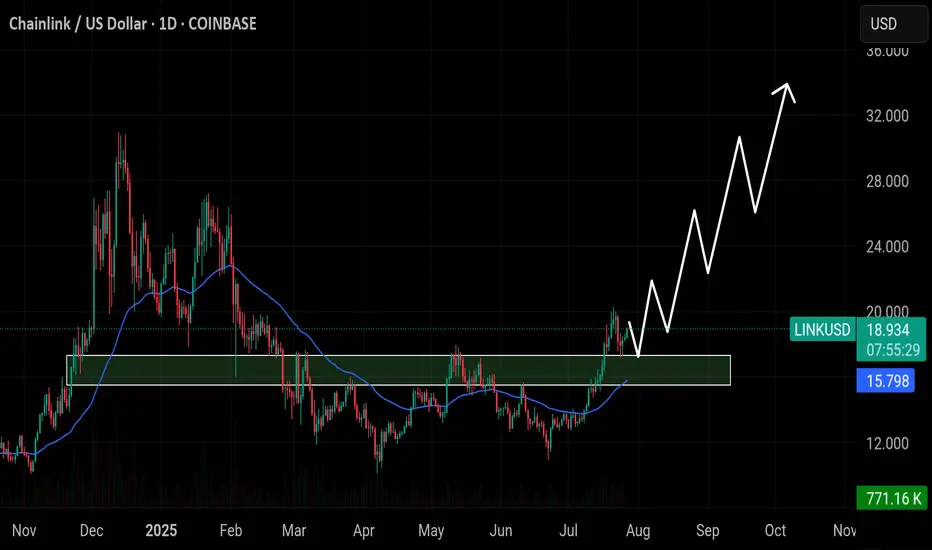
Chainlink ($LINK) has flipped the $15.80 zone into strong supporChainlink ( CRYPTOCAP:LINK ) has flipped the $15.80 zone into strong support — as long as it holds, bullish momentum could push toward $24, $28, and possibly $32 in the coming weeks.
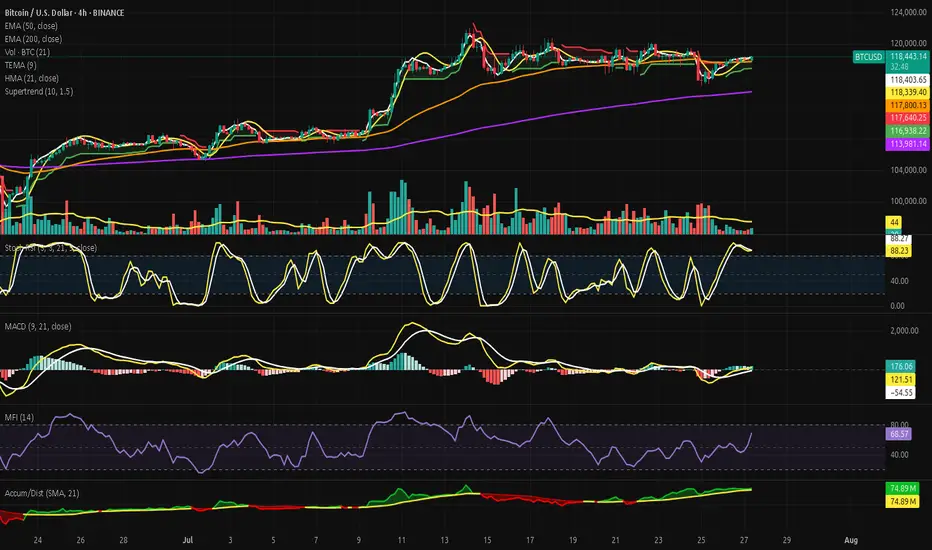
Bitcoin - Strategic Coil Within the Arcane Band.⊢
⟁ BTC/USD - BINANCE - (CHART: 4H) - (July 27, 2025).
◇ Analysis Price: $118.309,59.
⊣
⨀ I. Temporal Axis - Strategic Interval - (4H):
▦ TEMA9 - ($118.338,48):
∴ Price is currently below TEMA9, indicating near-term resistance;
∴ Curve is upward-sloping but flattening, suggesting fading acceleration;
∴ Acts as reactive signal line; minor rejection occurred on contact.
✴️ Conclusion: Momentum fading as price struggles to hold above dynamic resistance.
⊢
▦ HMA21 - ($118.324,83):
∴ Smooth curvature maintaining upward bias;
∴ Close proximity to TEMA9 shows compressed volatility regime;
∴ Price interacting with HMA without definitive breakout.
✴️ Conclusion: Tactical direction remains constructive, but confirmation is lacking.
⊢
▦ EMA50 - ($117.794,89):
∴ Strong medium-term support; price remains above it with clear respect;
∴ Acts as lower bound of the current compression channel;
∴ No bearish cross detected with TEMA or HMA.
✴️ Conclusion: Mid-term bullish support structure intact.
⊢
▦ EMA200 - ($113.979,81):
∴ Structure well below active price; rising and stable;
∴ Indicates long-term bullish posture is unbroken;
∴ No signs of major breakdown or transition to bear structure.
✴️ Conclusion: Structural uptrend remains unthreatened.
⊢
▦ SuperTrend Arcanvm - (ATR 10, 1.5 - $117.640,25):
∴ Price trades above the SuperTrend line, indicating continuation zone;
∴ Support zone lifted slightly, confirming minor trend maintenance;
∴ No signal reversal or close below since last shift.
✴️ Conclusion: Tactical upward bias protected by volatility-based support.
⊢
⨀ II. Momentum & Pressure Indicators:
▦ Stochastic RSI (3,3,21,9) - (%K: 88.23 / %D: 88.27):
∴ Deep into overbought zone; potential reversal region;
∴ Minor negative crossover forming (%K < %D);
∴ Pattern shows repeated false breaks from high zone.
✴️ Conclusion: Overextended with local fatigue building.
⊢
▦ MACD (9,21,9)- (Line: 164.40 / Signal: 106.94 / Histogram: +57.47):
∴ Bullish crossover confirmed and holding; histogram positive;
∴ Increasing MACD separation suggests underlying momentum;
∴ No divergence yet; consistent short-term upside energy.
✴️ Conclusion: Momentum favors bulls but remains immature.
⊢
▦ MFI (14) - (68.20):
∴ Trending toward overbought zone without breach;
∴ Steady increase reflects sustained volume-backed inflows;
∴ Not yet extreme; still has energy potential to fuel move.
✴️ Conclusion: Volume pressure supports bullish case with room left.
⊢
▦ Accumulation/Distribution + HMA21 - (74.89M):
∴ Line remains stable above short-term base; no outflow signals;
∴ Slight incline observed, confirming ongoing accumulation;
∴ No divergence with price; consistent flow.
✴️ Conclusion: Capital positioning remains supportive of continuation.
⊢
🜎 Strategic Insight - Technical Oracle:
∴ The current 4H structure on BTC/USD exhibits a compressed upward bias where dynamic resistance (TEMA + HMA) is being tested persistently but without explosive breakout;
∴ Momentum indicators (MACD, MFI) confirm early-stage bullish pressure, while structural supports (EMA50, SuperTrend) remain intact and responsive;
∴ However, Stoch RSI is saturated, suggesting that any continuation would likely require a cooling cycle or shallow retracement before sustainable thrust;
∴ This configuration aligns with a “Pre-Break Range Staging” - a technical limbo where buyers are present but cautious, and sellers are absorbed without significant follow-through.
✴️ Strategic Focus: Watch for confirmation above ($118.600) with volume expansion and MACD histogram follow-through, or a soft retest toward ($117.640/117.800) as reloading zone.
∴ Logic sealed. Tactical silence until resolution.
⊢
𓂀 Stoic-Structural Interpretation:
▦ Structurally Bullish - (Tactically Fragile Continuation):
∴ The long-term structure (EMA 200 rising, unbroken) confirms a preserved bullish frame;
∴ Mid-term support (EMA 50 + SuperTrend) is active and functioning as a technical base;
∴ However, price struggles to sustain above dynamic resistance (TEMA/HMA), and Stoch RSI signals short-term exhaustion.
✴️ Conclusion: The structure is upward, but the current tactical zone is sensitive. Any bullish continuation demands confirmation and discipline - no chasing.
⊢
▦ Tactical Range Caution:
∴ Support Zone - (Defensive): $117,640 / $117,800;
∴ Resistance Ceiling - (Breakout Trigger): $118,600;
∴ Tactical Neutral Band: $118,000 / $118,300.
✴️ Conclusion: No trade zone expands if compression persists. Breakout or breakdown must be decisive and accompanied by volume/momentum synchrony.
⊢
◩ Codicillus Silentii - Strategic Note:
∴ In moments of compressed structure near resistance, the market does not reveal itself through price - but through how it refuses to move. Silence becomes signal;
∴ What is observed here is not a lack of momentum - but deliberate withholding of directional intent;
∴ The system is balanced between emergent buy pressure (MACD, MFI, Accum/Dist) and short-term saturation (Stoch RSI), forming a strategic standoff:
No major actors are retreating, but none are charging forward either.
The candle bodies shrink while oscillators extend - a classic sign of non-confirmed bullish bias.
Emotional traders will chase; initiated ones will wait for the candle that breaks the silence, not the one that whispers hope.
✴️ Final Seal: The stoic operator does not react to pressure - he reacts to structure.
Tactical inaction is a move; Watching is positioning; Discipline is participation.
⊢
⧉
· Cryptorvm Dominvs · MAGISTER ARCANVM · Vox Primordialis ·
⚜️ ⌬ - Silence precedes the next force. Structure is sacred - ⌬ ⚜️
⧉
⊢
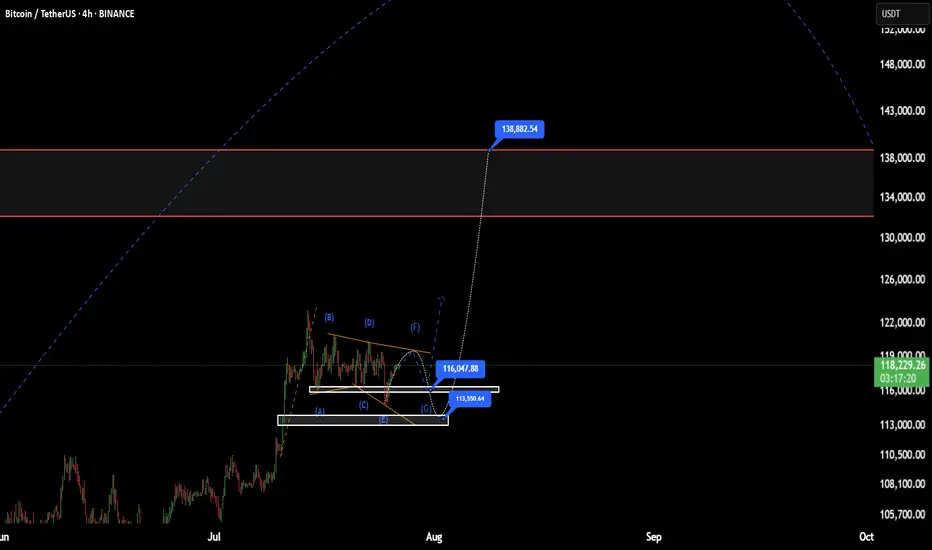
BTC(based on NEo wave)This range price is shown as a bow-tie diametrical.
I think G wave will end at one of those prices, 113 or 116
after this it will start a good bullish wave.
stop loss is 110K and the first target is 138K.
BITCOIN Wait For Breakout!
HI,Traders !
#BITCOIN has formed a Bullish Wedge pattern
While trading in an uptrend As
we mentioned in a previous analysis
So we are bullish biased and
IF we see a bullish breakout
We will be expecting a
Further bullish move up !
Comment and subscribe to help us grow !

Bitcoin Flag pattern aim towards 100k
Second scenario BTC aim for 100k
In first scenario we see that RSI divergence and last time 70% retracement
but last time it's not flag pattern
So what you think, trade with SL and proper risk management.

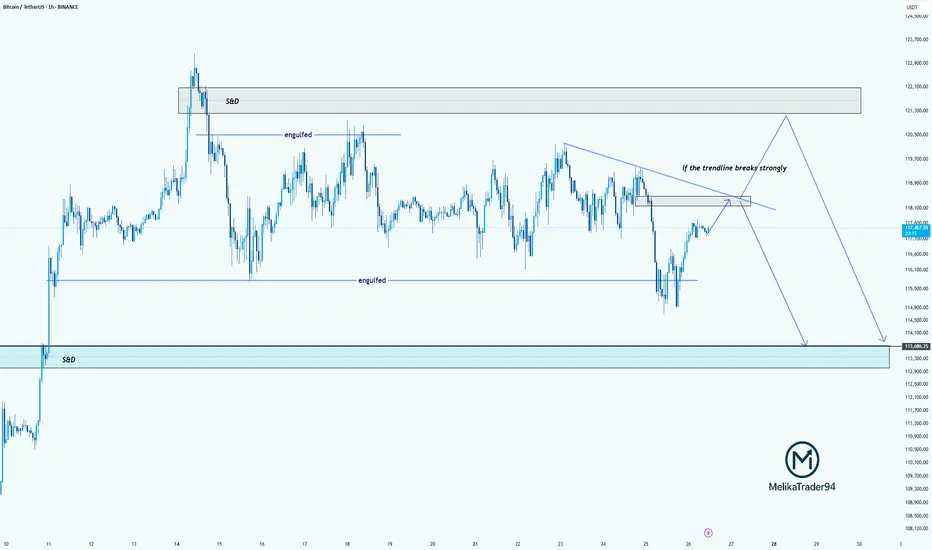
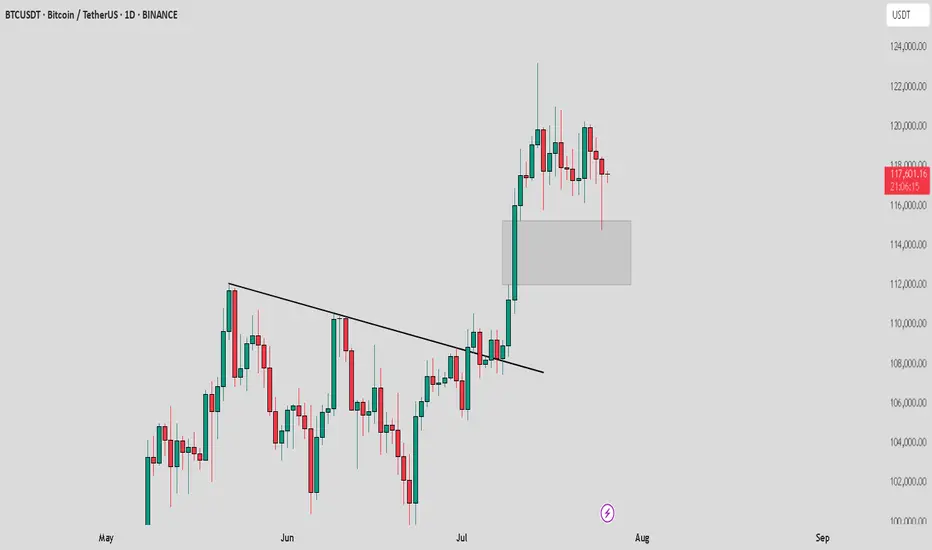
TC Analysis – Watching That Trendline Closely!Hello guys!
Bitcoin is currently approaching a key decision point. As highlighted on the chart, we’ve got a descending trendline acting as strong resistance. If this trendline breaks with strength, we may see price push up into the supply & demand zone around 121,000–122,000 before potentially reversing.
However, if the trendline holds, this current move could be a retest, setting up for another drop. The engulfed level at 114,000 has already been tested once, and if we break below that again, the price could slide down into the S&D demand zone around 113,000–112,000.
summry:
Trendline resistance is critical right now
Watch for a strong breakout or a fakeout & rejection
Possible bearish continuation if we fail to reclaim above 118,500
Let’s see how BTC reacts around this zone.
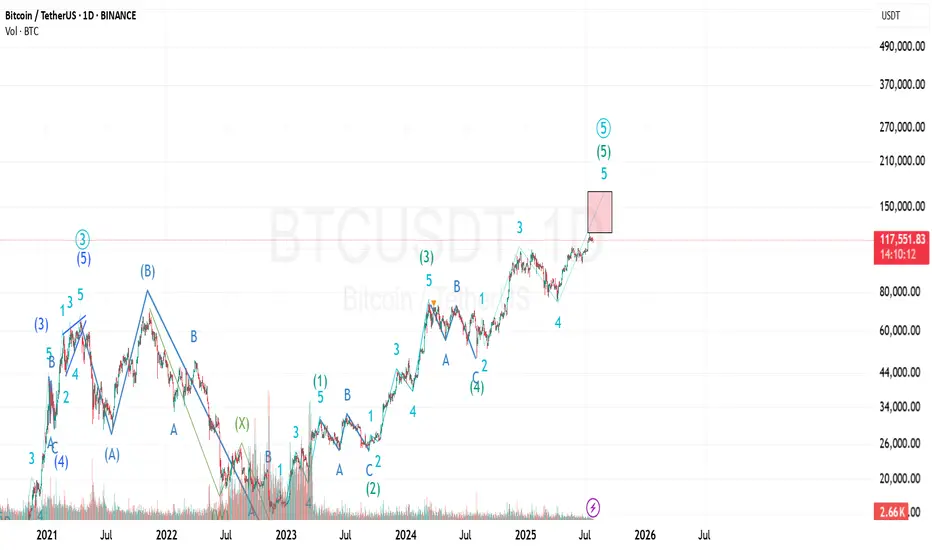
Bitcoin Prediction UpdateI've just modified the wave count and still the previous analysis is valid...
I'm not sure about the target of the last wave (the 5th of 5th wave) because it can be an extended wave...
The shown box is where I'll investigate to find any ending pattern...
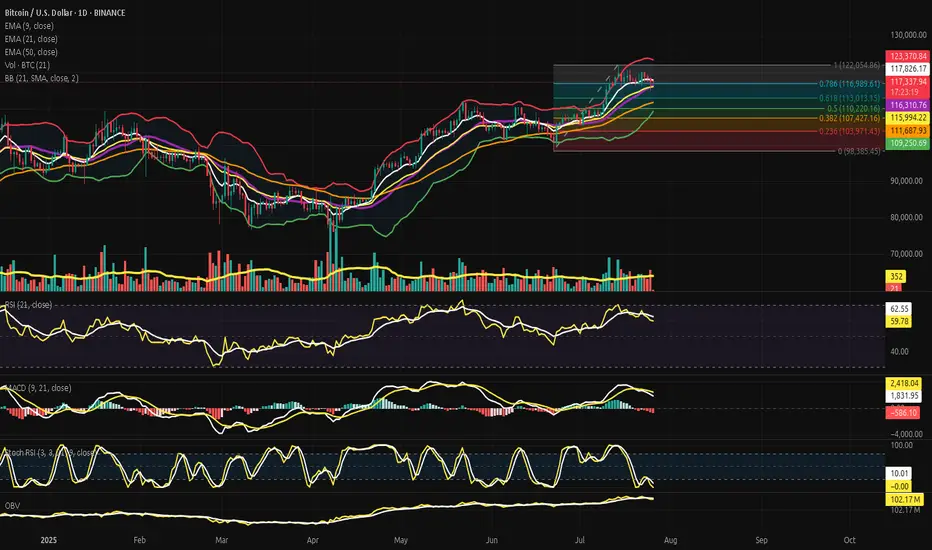
Bitcoin Beneath the Arc of Silence - Structural Faith, Tactical?⊢
⟁ BTC/USD - BINANCE - (CHART: 1D) - (July 26, 2025).
◇ Analysis Price: $117,421.02.
⊣
⨀ I. Temporal Axis - Strategic Interval - (1D):
▦ EMA9 - ($117,842.79):
∴ The EMA9)is currently positioned at $117,842.79, slightly above the price ($117,421.02), acting as immediate dynamic resistance;
∴ Price has closed below EMA9 for multiple sessions, indicating a fading short-term momentum arc;
∴ The slope of the EMA9 is flattening, signaling an inflection zone rather than active thrust.
✴️ Conclusion: The short-term control line has been lost tactically; a sign of momentum exhaustion but not structural breakdown.
⊢
▦ EMA21 - ($116,001.77):
∴ EMA21 stands at $116,001.77, serving as an intermediate-range support below current price;
∴ The slope remains positive, providing a second-layer bullish structure after the loss of EMA9;
∴ Price has not tested EMA21 since early July - proximity implies possible gravitational pull.
✴️ Conclusion: EMA21 is the next defense line in a suspended structure, acting as the center of tactical compression.
⊢
▦ EMA50 - ($111,691.19):
∴ EMA50 sits at $111,691.19, aligned closely with the (0.236 Fibonacci) and historical cluster zone;
∴ Price has remained well above this level for over 30 sessions;
∴ The slope is clearly positive, marking macro structural support.
✴️ Conclusion: EMA50 represents the last reliable arc before macro invalidation. Its integrity maintains the long-term bullish thesis.
⊢
▦ Fibonacci Retracement:
∴ Retracement is correctly anchored: 1.0 = $122,054.86 (ATH) / 0.0 = $98,385.45 - (June 22 low);
∴ Price currently oscillates within the 0.618–0.5 zone ($113k–$110k), the classical golden pocket;
∴ The golden pocket aligns closely with EMA21 and the Bollinger mean, forming a triple confluence zone.
✴️ Conclusion: Price is inside the Fibonacci heart of reaccumulation - ideal for breakout setups or breakdown invalidation.
⊢
▦ Bollinger Bands (21, 2.0):
∴ The upper band is at $123,377.19, while the middle band rests at $116,314.72;
∴ Price is between the middle and upper bands, consolidating after rejection from the upper line;
∴ The bands are narrowing, indicating a volatility contraction cycle.
✴️ Conclusion: Bollinger geometry confirms volatility suppression, aligning with RSI and MACD flattening - a signal of impending release.
⊢
▦ RSI (21) + EMA9:
∴ RSI is at (59.99), slightly under its EMA9 - (62.59), showing momentum erosion without collapse;
∴ The RSI has declined from the high 70s in late June, signaling tactical cooling;
∴ Remaining above 50 preserves structural bullish bias.
✴️ Conclusion: RSI is in tactical descent, but not structurally bearish - neutral-to-bullish compression.
⊢
▦ MACD (9,21):
∴ MACD line is below signal line, currently at (1,841.01) vs (2,419.86), confirming a bearish cross;
∴ Histogram prints red for several sessions, with fading amplitude;
∴ Despite the crossover, MACD remains in positive territory, indicating soft correction, not trend reversal.
✴️ Conclusion: MACD confirms a tactical retracement, aligned with RSI weakness, yet within bullish context.
⊢
▦ Stochastic RSI (3, 3, 21, 9):
∴ Current value is 0.00, denoting extreme oversold conditions;
∴ Multiple sessions have closed at this level without relief;
∴ Historically, flatlines at 0.00 often precede upward jolts.
✴️ Conclusion: Stoch RSI indicates exhaustion of momentum - potential for rebound or failed bounce.
⊢
▦ Volume + EMA21:
∴ Volume on current sessions is below the 21-period EMA, confirming absence of strong sell-side dominance;
∴ No abnormal spikes or climaxes are visible - neither panic nor breakout yet;
∴ Volume profile aligns with Bollinger contraction.
✴️ Conclusion: Quiet volume supports the thesis of controlled tactical consolidation, not distribution.
⊢
▦ OBV + EMA9:
∴ OBV stands at 102.17M, flatlined with EMA9;
∴ No divergence detected relative to price;
∴ Momentum of accumulation remains static but not deteriorating.
✴️ Conclusion: OBV is in neutral stance, neither confirming breakout nor selloff - favors tactical patience.
⊢
🜎 Strategic Insight - Technical Oracle:
∴ Bitcoin is suspended in a compressed volatility range beneath its local high, resting upon layered support zones defined by EMA21, Bollinger median, and the Fibonacci golden pocket (0.618–0.5);
∴ Momentum indicators (RSI, MACD, Stoch RSI) are all in tactical decline, yet no structure has been broken - price still floats above all macro EMA's (21, 50) with OBV unshaken;
∴ The short-term weakness is absorbed within a higher-order structural integrity, suggesting latent potential awaiting a fundamental catalyst.
✴️ Conclusion: The oracle observes a coiled market, technically restrained but not structurally broken - an archetype of Strategic Suspension Beneath the Arc of Silence.
⊢
∫ II. On-Chain Intelligence - (Source: CryptoQuant):
▦ Exchange Netflow Total + 9EMA - (All Exchanges):
∴ The current netflow is (-864.6 BTC), remaining firmly below its EMA9 baseline;
∴ The 9-day moving average of netflows is flat-to-negative, signaling persistent withdrawal pressure from exchanges;
∴ Sustained negative netflows in conjunction with a stable price floor indicate non-speculative cold storage behavior.
✴️ Conclusion: Netflow structure is bearish for exchanges, but bullish for long-term price, as BTC flows into private custody.
⊢
▦ Miner to Exchange Flow + 9EMA - (All Miners):
∴ Current flow from miners hovers near 1.2K BTC/day, well below the EMA9 which trends above 3K;
∴ The flow has not pierced its EMA9 in recent weeks, despite BTC testing local highs - a strong non-distribution signal;
∴ The divergence between low miner outflows and high price resilience confirms supply-side discipline.
✴️ Conclusion: Miner flows remain suppressed beneath EMA9 - a structurally bullish posture amid local consolidation.
⊢
▦ Funding Rate + 9EMA - (All Exchanges):
∴ The funding rate is (+0.012), sitting above its EMA9, indicating a minor long bias across derivatives markets;
∴ There is no spike or deviation suggesting leveraged imbalance - the slope of the EMA9 remains shallow;
∴ Funding above EMA9, with RSI and MACD fading, implies a passively bullish positioning without euphoria.
✴️ Conclusion: Funding is technically constructive, aligned with healthy sentiment - not overheated, nor bearish.
⊢
▦ Spent Output Profit Ratio - (SOPR) + 9EMA - (Adjusted):
∴ The SOPR stands at 1.016, maintaining a position above its 9-day EMA;
∴ No dip below 1.0 has occurred in recent sessions, showing that BTC is being transacted in profit;
∴ EMA(9) acts as a median around 1.0 - a psychological pivot between profit realization and capitulation.
✴️ Conclusion: SOPR above EMA9 confirms a healthy trend, with profits being realized in harmony - not desperation.
⊢
🜎 Strategic Insight - On-Chain Oracle:
∴ All four on-chain pillars - Exchange Netflow, Miner Flow, Funding, SOPR - operate in favor of structural continuation, with none indicating exhaustion or distribution;
∴ The alignment of each indicator above or below EMA9 in the appropriate direction (accumulation vs euphoria) forms a cohesive bullish framework;
∴ The lack of pressure from miners, and the smooth funding environment, give room for technical consolidation to mature without triggering panic.
✴️ Conclusion: The oracle discerns a hidden current of strength, buried beneath the tactical mist. Structural forces remain aligned with continuation - though the flame is dimmed, it is not extinguished.
⊢
⧉ III. Contextvs Macro-Geopoliticvs - (July 25, 2025):
▦ 10:00 AM - Core Capital Goods Orders - (Durable Goods excl. Defense & Aircraft):
∴ The index, a proxy for business investment, contracted by (-0.7%) in June - the sharpest monthly decline of the year;
∴ This marks a decisive loss of momentum in private-sector expansion;
∴ While shipments rose slightly (+0.4%), the delta is attributed to inflation, not demand.
✴️ Conclusion: The business sector shows signs of hesitation, reinforcing the case for policy accommodation.
⊢
▦ 14:30 PM - Trump's Visit to the Federal Reserve - (Rare Executive Intervention):
∴ President Trump visited Powell directly, urging him to cut interest rates to "save the American engine";
∴ Powell responded with a carefully chosen phrase: “The country is doing really well” - read by markets as passive affirmation;
∴ This act marks a rare intrusion into Fed independence, adding political volatility to monetary policy expectations.
✴️ Conclusion: The Fed is now politically cornered, caught between inflation resilience and political coercion.
⊢
▦ 16:00 PM - Market Response & Euphoria Spike:
∴ U.S. indices - S&P 500, Nasdaq, Dow Jones - all reached all-time highs on the back of Powell's phrase and Trump’s pressure;
∴ Approximately 80% of S&P companies beat earnings expectations, providing fuel to the narrative;
∴ Market interpreted silence as assent, reactivating the “Fed put” theory.
✴️ Conclusion: Markets responded as if Powell had already signaled rate cuts, despite no formal commitment.
⊢
▦ 18:00 PM - Rate Cut Probability Assessment - (CME/FedWatch):
∴ Probability of a rate cut in September rose to (61.8%), precisely echoing the Fibonacci retracement now governing Bitcoin price;
∴ This alignment signals macro-on-chain-temporal resonance;
∴ Powell reiterates data dependency - no promises, but full optionality.
✴️ Conclusion: The macro veil is thin - policy pivot is anticipated, but not yet manifest. Tactical patience is vital.
⊢
🜎 Strategic Insight - Macro Oracle:
∴ Economic data weakens subtly;
∴ Political pressure intensifies;
∴ Market euphoria resurfaces on whispers, not substance.
∴ The silence of Powell is being interpreted, not spoken - a dangerous act of collective projection.
✴️ Conclusion: The Fed speaks in veils - and markets trade in illusions. The macro climate is now psychologically unstable, but not yet structurally broken.
⊢
𓂀 Stoic-Structural Interpretation:
▦ Structurally Bullish - Tactically Suspended:
∴ Price action remains well supported above all macro EMA's (21, 50), the OBV is intact, and no distribution signals are present;
∴ Momentum indicators (RSI, MACD, Stoch RSI) confirm a tactical cooldown, not collapse;
∴ On-chain fundamentals (Netflows, Miner Behavior, SOPR, Funding) remain constructively aligned.
✴️ Conclusion: Structurally, the market preserves a bullish foundation, while tactically locked in volatility suppression and directional indecision.
⊢
▦ Tactical Range Caution:
∴ Resistance: $123,377.19 (Upper BB), then $126,000 (local expansion);
∴ Pivot: $117,800 (EMA9) / $116,000 (EMA21);
∴ Support: $113,013.15 (Fibonacci 0.618), $111,691.19 (EMA50), then $107,400 (macro reversal threshold).
✴️ Conclusion: Tactical range is compressed within a ($116K-$123K) gate. Below $111K triggers macro risk.
⊢
◩ Codicillus Silentii - Strategic Note:
∴ In the breath between policy and projection, the markets chant futures yet unspoken.
BTC rests not in fear, nor in hope - but in silence.
✴️ Final Seal: The arc is intact. The veil has not fallen. Patience is power.
⊢
⧉
· Cryptorvm Dominvs · MAGISTER ARCANVM · Vox Primordialis ·
⚜️ ⌬ - Silence precedes the next force. Structure is sacred - ⌬ ⚜️
⧉
⊢
BTC /USDT : Getting support from FVG BTC Support from FVG - Bullish & Bearish Scenarios:
Bullish Scenario:
BTC is holding support from the FVG. As long as BTC stays above this zone, the market remains bullish. A bounce here could lead to further upside.
Bearish Scenario:
If BTC breaks below the FVG, it signals a potential downtrend. A breakdown may lead to more pain and further declines in the market.
Tips:
1. Wait for Confirmation: Look for a clear candle close above/below FVG for validation.
2. Risk Management: Set stops near the FVG to manage potential losses.
3. Monitor Volume: Strong volume during support retests increases bullish potential.
4. Stay Flexible: Be prepared for a market shift if BTC breaks the FVG support.
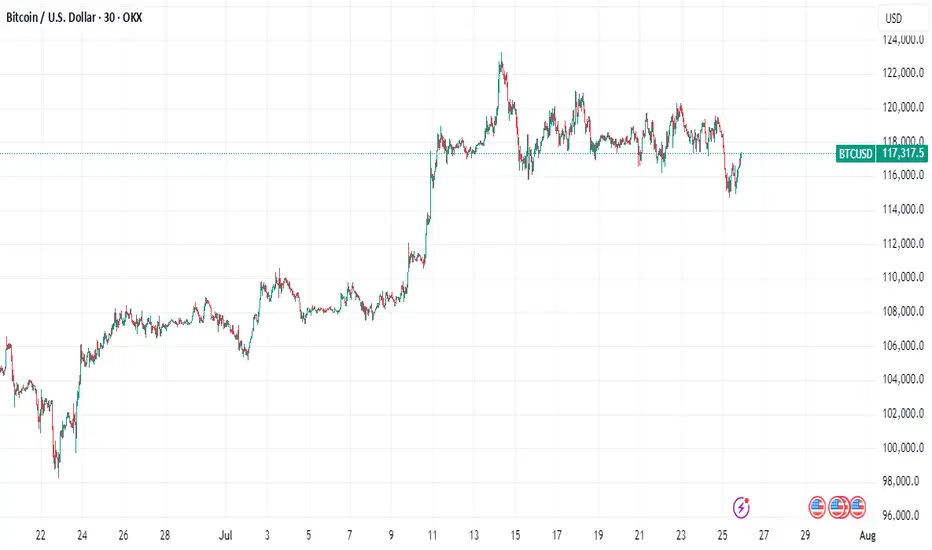
Why Bitcoin's Bull Run Hits a WallBitcoin's Bull Run Hits a Wall: A Deep Dive into the $115K Correction, Record Leverage, and the Battle for Market Control
A sudden and violent tremor has shaken the cryptocurrency market to its core. After a period of quiet range-bound trading, Bitcoin has decisively moved from consolidation to a sharp correction, plunging below the critical $116,000 support level and briefly touching $115,000. The abrupt downturn triggered a "bloodbath for crypto longs," liquidating hundreds of thousands of traders and wiping out nearly $600 million in leveraged positions. Yet, as the dust settles, a complex and contradictory picture emerges. While institutional sell-offs and cascading liquidations paint a grim short-term picture, record-high open interest, significant liquidity grabs, and bullish on-chain signals suggest the long-term uptrend may be far from over. This article delves into the anatomy of the crash, the forces that fueled it, and the fierce battle between bearish catalysts and bullish undercurrents that will define Bitcoin's next move.
Part 1: The Anatomy of the Correction - From Sideways to Sell-Off
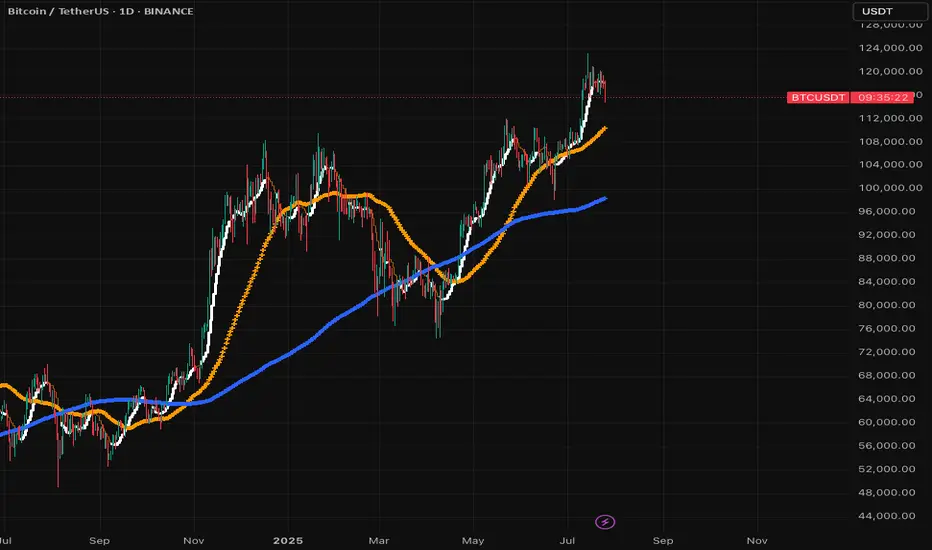
For weeks, Bitcoin's price action was characterized by consolidation, a phase where an asset trades within a defined range, reflecting market indecisiveness. After a strong upward trend that pushed Bitcoin to new highs above $120,000, this period of sideways movement was seen by many as a healthy pause before the next leg up. However, this placid surface masked building pressure. The transition from this consolidation phase to a full-blown correction was swift and brutal.
A market correction is defined as a rapid price change, often a decline of at least 10% but less severe than a crash, that disrupts an asset's prevailing trend. The recent tumble below $116,000 fits this description perfectly. The sell-off was not a gradual slide but a violent dislocation, breaking through established support levels and triggering a wave of panic.
This dramatic shift was exacerbated by several key factors. On-chain data revealed that a significant institutional player, Galaxy Digital, unleashed a massive sell-off, reportedly moving billions in Bitcoin to exchanges. This sudden injection of supply into the market acted as a powerful catalyst, overwhelming buy-side pressure and initiating the downward price spiral. The market's reaction was immediate, with the price slicing through the psychological support at $116,000 and heading towards the next major liquidity zone around $115,000.
Part 2: The Cascade - A $600 Million Bloodbath for Leveraged Traders
The speed of the price drop had a devastating impact on the derivatives market, a space where traders use borrowed funds to amplify their bets on price movements. The sudden downturn resulted in one of the most significant liquidation events in recent memory, with 213,729 traders liquidated for a total of nearly $600 million over a 24-hour period.
What is a Liquidation?
In crypto futures trading, liquidation is the forced closure of a trader's position by an exchange. This happens when a trader can no longer meet the margin requirements for their leveraged position, meaning their collateral is insufficient to cover their mounting losses. For example, a trader using 20x leverage on a $1,000 position controls $20,000 worth of Bitcoin. However, a mere 5% price move against them can wipe out their entire initial capital, triggering a liquidation.
The recent event was a "bloodbath for crypto longs," meaning traders who had bet on the price of Bitcoin increasing were the primary victims. As the price fell, these long positions became unprofitable, and once they crossed their liquidation price, exchanges automatically sold the collateral on the open market to cover the losses.
This process created a deadly feedback loop known as a liquidation cascade. The first wave of forced selling from liquidated longs added more downward pressure on the price. This, in turn, pushed the price down further, triggering the liquidation of another set of long positions whose liquidation prices were slightly lower. This domino effect—where liquidations cause lower prices, which in turn cause more liquidations—is what transforms a standard price dip into a violent market crash. This automated, rapid chain reaction is a hallmark of the highly leveraged and volatile crypto markets.
Part 3: The Fuel for the Fire - Open Interest Reaches a Record $44 Billion
Underpinning this massive liquidation event was an unprecedented buildup of leverage in the market, best measured by a metric called Open Interest (OI). Open Interest represents the total number of active or unsettled futures contracts in the market. It’s a measure of the total capital and number of positions committed to the derivatives market, distinct from trading volume, which counts both opened and closed positions. An increase in OI signifies that new money and new positions are entering the market, often leading to higher volatility.
In a stunning development, as Bitcoin's price began to plunge, the total Open Interest surged to a new all-time high of $44 billion. This unusual divergence—where price falls while open interest rises—suggested that a significant number of new short positions were being opened to bet against the market, while many longs remained trapped, hoping for a reversal. This created a powder keg of leverage.
Further fueling this was a notable surge on the world's largest crypto exchange. On-chain data showed that traders added 10,000 Bitcoin worth of open interest to the BTCUSDT perpetual contract on Binance alone. This single-day surge in open interest on a key trading pair signaled a massive influx of speculative capital.
High open interest acts as fuel for volatility. With so many leveraged contracts open, any sharp price movement can trigger the kind of cascading liquidations that were just witnessed. The record-breaking $44 billion in open positions meant the market was more susceptible than ever to a violent deleveraging event.
Part 4: The Big Players - A Tale of Two Whales
The recent market turmoil cannot be fully understood without examining the actions of its largest participants: the whales and institutions. Their movements often create the initial waves that retail traders are forced to navigate.
On the bearish side, the primary catalyst for the sell-off appears to be Galaxy Digital. The digital asset financial services firm was observed moving tens of thousands of Bitcoin, worth billions of dollars, to centralized exchanges. These flows were reportedly part of a larger liquidation of holdings from a dormant "Satoshi-era" whale, with Galaxy acting as the intermediary to facilitate the sale. By strategically offloading such a massive amount, even if through over-the-counter (OTC) desks to minimize initial impact, the sheer volume of sell pressure eventually spilled into the public markets, triggering the correction. The firm's subsequent withdrawal of over a billion dollars in stablecoins from exchanges further suggests a large-scale profit-taking or strategic de-risking maneuver.
However, this institutional selling pressure is contrasted by a powerful bullish undercurrent. Even as the market reeled, other large players were making bold, long-term bets. Reports surfaced of a significant whale bet on Bitcoin reaching a staggering $200,000 by the end of the year. This dichotomy highlights the deep division in market sentiment. While some large entities are taking profits or repositioning, others view this correction as a prime accumulation opportunity, demonstrating unwavering conviction in Bitcoin's long-term trajectory.
This clash of titans—the institutional seller and the long-term bullish whale—defines the current market structure. The price is caught in a tug-of-war between immediate, heavy supply and deep-pocketed, long-term demand.
Part 5: Reading the Tea Leaves - A Healthy Reset or the Start of a Bear Market?
While the headlines scream "bloodbath" and "crash," a deeper analysis of market mechanics and on-chain data offers a more nuanced perspective. Several key indicators suggest that this brutal pullback, while painful, may be a healthy reset rather than the beginning of a sustained bear market.
Argument 1: The Pullback Remains Within Normal Volatility Range
Bitcoin is notoriously volatile, and sharp corrections are a historical feature of its bull markets. Drawdowns of 30-40% have been common pit stops during previous bull runs. While a drop from over $120,000 to $115,000 is significant, analysts point out that such moves are not out of character for the asset. Historically, major cycle-ending bear markets have seen drawdowns exceeding 75-80%. In contrast, mid-cycle corrections serve to wipe out excess leverage, shake out weak hands, and build a more sustainable foundation for future growth. This event, though severe for leveraged traders, may fall into the category of a standard, albeit sharp, bull market correction.
Argument 2: A Necessary Liquidity Grab
Sophisticated market analysis suggests the plunge below $115,000 was a textbook liquidity grab. This is a maneuver, often initiated by large players or "smart money," where the price is intentionally pushed to a level where a high concentration of stop-loss and liquidation orders are known to exist. By triggering these sell orders, large buyers can absorb the resulting liquidity to fill their own large positions at more favorable prices before reversing the market direction. The area just below a key psychological level like $115,000 is a prime location for such a maneuver. The rapid dip followed by a stabilization could indicate that this was not a panic-driven crash, but a calculated move to hunt liquidity before the next leg up.
Argument 3: Bullish Signals from Spot Markets and On-Chain Data
While the derivatives market was in turmoil, other indicators flashed bullish signals. One analyst pointed to a strong correlation between surges in Binance's spot trading volume and subsequent price upswings. Recently, Binance's share of the spot market volume surged significantly, a move that has historically preceded rallies. High spot volume indicates genuine buying and selling activity, as opposed to the paper bets of the futures market, and can signal strong underlying demand.
Furthermore, key on-chain metrics suggest the long-term bullish scenario remains intact. Analysts highlighted that Bitcoin's price found support near the "Realized Price" for short-term holders, indicating that recent buyers were not panic-selling in large numbers. Other metrics, such as those showing that major long-term holders are retaining their assets despite record prices, paint a picture of underlying market strength that contrasts with the short-term speculative chaos.
Conclusion: A Market at a Crossroads
The dramatic plunge to $115,000 was a multifaceted event, a perfect storm of institutional profit-taking, extreme leverage, and the brutal mechanics of the crypto derivatives market. For the over-leveraged trader, it was a catastrophe. For the long-term investor, it may have been a fleeting opportunity.
The market now stands at a critical juncture, defined by conflicting forces. On one hand, the specter of institutional selling, exemplified by the Galaxy Digital offload, looms large. The record-high open interest, though slightly diminished after the liquidations, still represents a significant amount of leverage that could fuel further volatility.
On the other hand, the arguments for a bullish continuation are compelling. The idea that the crash was a calculated liquidity grab, the historical precedent for sharp bull market corrections, the strength in spot market volumes, and the conviction of long-term holders all suggest that the core uptrend is resilient. The whale betting on a $200,000 price by year-end serves as a potent symbol of this underlying confidence.
The coming weeks will be crucial in determining which of these forces will prevail. The battle between the short-term pressures of deleveraging and the long-term thesis of accumulation will be fought in the charts and on the blockchain. While the bloodbath for longs served as a stark reminder of the perils of leverage, it may have also been the violent, necessary purge required to cleanse the market and pave the way for a more sustainable ascent.
BTC dropping like a brick....bound to happen sooner or laterHard drops follow big spikes. Happens every time, just look back in time. But this time it's different? Maybe to some extent, but as long as there are short term profit takers and insane volatility this trend will continue. Only 2 cents is to not SHORT SELL. You will only contribute to the potential squeeze and will lose money. If you're up now, your priority should be to retain value and sell before it goes down to it's next support level which is under 100k! Maybe it does or not, but the dips do happen and with automated trading bots it could hit more aggressively and faster. If anything, but the dip when there's sufficient support. Best of luck!
BTC key zones for continueBTC needs to hold this zones for continue and there is some liquidity. Because dominance get breakout we want to see much higher prices for altcoin but maybe we will see sharp correction and continue up.
Feel free to ask for some altcoin analysis.
