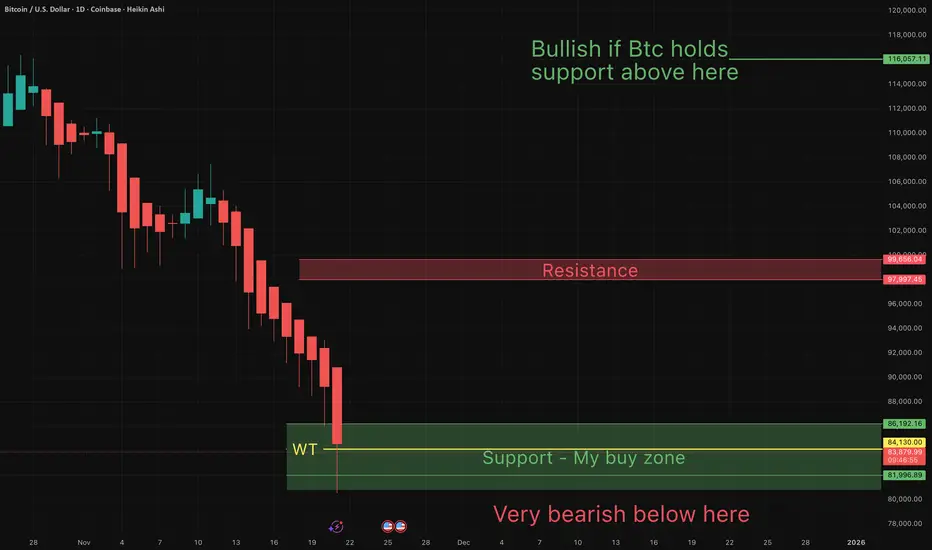
BTC’s 85k-87k Range: 80k Risk or 100k Rebound Next WeekBTC plummeted to around 80,000 last Black Friday, now ranging between 85,000 and 87,000. A breakdown below 85,000 risks breaching the 80,000 support; holding above confirms a rebound, with a potential retest of 100,000 next week
Sell 88000 - 87500
TP 86500 - 86000 - 85000
Accurate signals updated daily. They serve as a reliable guide for trading issues – feel free to refer to them. Hope they help!
Btcusdbuy

BTC Trade Set Up Nov 24 2025Price has shifted to bullish structure making HH/HL on the 1h and engulfed a 4h bearish candle so i am looking to hold buys up to higher BSL levels to be swept

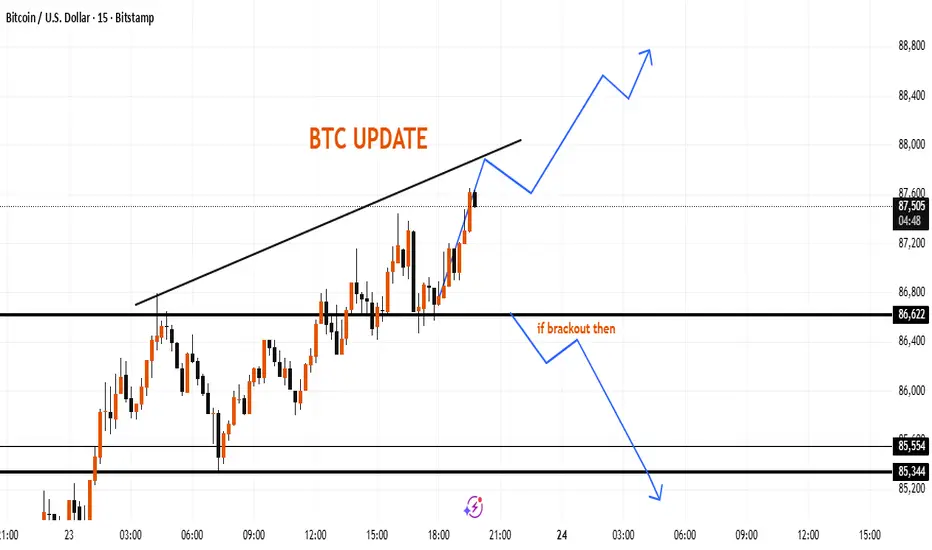
BTC Intraday Structure UpdateBitcoin is currently moving within an ascending structure, approaching a trendline that has acted as a reaction zone in recent candles. If price holds above the 87,500 area, the chart suggests the potential for continued upward momentum toward higher intraday levels.
If the market slips below the 86,620 zone, it may indicate a shift toward lower support areas around 85,550–85,340, where the chart previously showed reactions.
This update highlights the key zones to watch based on recent movement and overall short-term structure.
$BTC planCRYPTOCAP:BTC depending on weekly close I will go long or short. Reclaim trendline and I will go long. Stay below and I will short it.


BITCOIN : Where is the price floor (full analysis)Hello friends
Well, the fall in Bitcoin has really scared the market these days, and that's why we had a sharp fall, as it turned out.
Well, if we examine the past price, you will see that there has always been an upward trend and sometimes we have had price corrections, and this is completely normal.
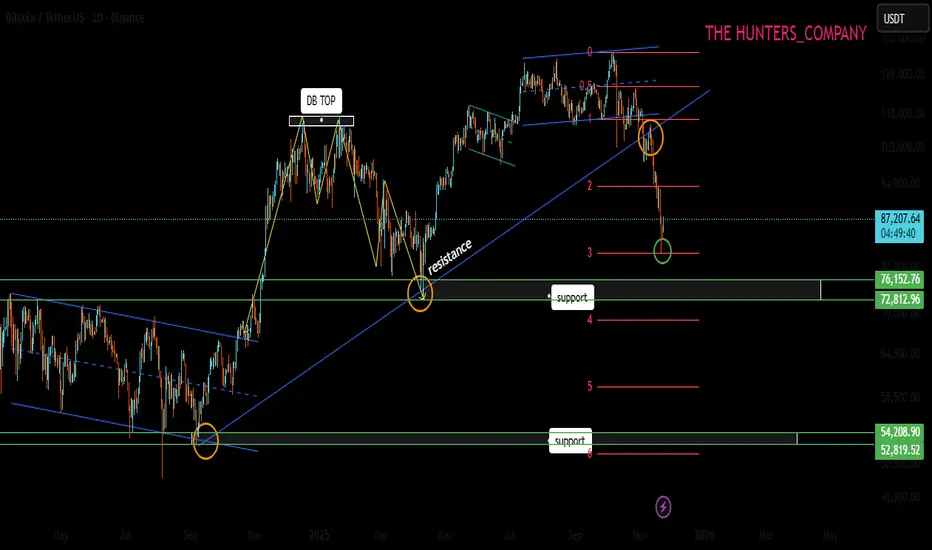
Before this drop, Bitcoin formed a double top pattern and the price corrected, and was again supported by the area indicated by buyers, and the price hit a higher ceiling.
But at the price ceiling, we witnessed weakness in buyers and, more importantly, a rounding of the price, which caused a heavy drop to 80,000. Now, after this sharp drop, the price is unlikely to go straight back up and make a new ceiling.
Now, after this strong spike by sellers, we can expect a descending range or channel.
What do we need to climb to?
Well, obviously the price needs to recover and buyers need to provide good support for the price, and first of all we see a range or channel, and then if they can break the channel or range, buyers can hope for a new ceiling. Otherwise, the price pivots we identified are the most important supports that the price can reach over time.
So, can we say that the rise is over?
No, nothing can be said with certainty. Maybe the price will bottom out at 70,000 to 80,000 and buyers will come in.
But in order to minimize the risk, we must move forward with the market and according to market behavior, not predict...
For this reason, it is not possible to say at this time that the price will go to a new ceiling from here because we do not see any buyers!!!
What is the solution?
Well, let's be logical: when the price goes down and Bitcoin becomes cheaper, better opportunities for buying are available to us, and we should take advantage of this situation and not enter the price ceiling emotionally and suffer losses.
Finally,
We need to see what the buyers' reaction is and if they want to support, then we can enter safely, not now that the Sharp price is falling.\
Be sure to observe risk capital management and do not get excited.
*Trade safely with us*
[WEEKLY] ANFIBO | Bitcoin BTCUSD - Downtrend? [11.24 - 11.28]Hi traders, Anfibo’s here!
BTCUSD – Technical Outlook
Overall Picture:
Last week, BITSTAMP:BTCUSD dipped into the 80,000 USD support zone, a key area that has previously acted as a structural demand region during corrective phases. The market reacted well, showing a notable bounce—though not yet strong enough to confirm a full trend reversal. Current price action remains in a broad corrective structure, and until BTC reclaims major broken levels, we treat all upward movements as retracements within a larger correction. The next week will be crucial, with clear opportunities both for strategic dip-buying and trend-continuation selling depending on how price behaves around major zones.
Weekly Trading Plan:
>>> BUY ZONE:
ENTRY: 83,000 – 85,000
SL: 80,000
TP: 96,000 → 98,000 → 102,000
(Looking to buy the retest of the previously broken structure around 98k. This is a classic “reclaim & retest” setup if momentum continues to recover.)
>>> SELL ZONE:
ENTRY: 98,000 - 102,000 (retest of breakdown)
SL: 106,000
TP: 87,000 → 80,000 → 77,000 → 72,000 → ...
(These levels align with the deeper correction targets. I will only execute these sells if BTC shows clear rejection signals, matching the purple-arrow projection.)
Risk Management:
Keep position size moderate until BTC confirms a clear trend direction.
Prioritize setups with clean invalidation points such as the 98k retest and the 76–71k demand range.
Avoid chasing price mid-range; trade only from well-defined boundaries.
Always secure partial profits once the market moves in your favor to reduce emotional pressure.
Conclusion:
BTC is showing signs of stabilizing after the bounce from 80k, but the market remains in a broad corrective phase. The plan for the upcoming week is straightforward: look to buy corrective pullbacks into the 98k retest, while also preparing to sell deeper breakdowns toward the 76–71k zone if bearish confirmation appears. Flexibility is essential—trade the chart, not the prediction.
HAVE A POWERFUL WEEK, GUYS!

BTC BLUE TRADE UPDATE Bitcoin buy update , btcusd has triggered the buy stop and now it’s possible to keep buying the cryptocurrency

BTC UPDATE Bitcoin has been going up here’s an update, you can close partial profits if necessary to avoid losing profits already made

BTC rewards the one with patience! BTC to all time high soon!🚀 Wave 4 Almost DONE!
This wave count is one of the cleanest macro structures we’ve seen in this cycle. Every leg has unfolded with beautiful precision, and now Bitcoin is approaching a high-probability reversal zone. 👇
🔍 Why This Count Looks 🔥
• Textbook Impulse Structure: Wave 1, 2, and the extended Wave 3 all follow classic Elliott Wave proportions.
• Clean W-X-Y Correction: Wave 4 has respected every trend channel and internal subdivision — a sign of structural strength.
• Major Fibonacci Confluence: Price is now diving into the 0.382 fib level (~$87.4K) — a common Wave 4 retracement in strong bull markets.
• Perfect Geometry: Trendlines, fibs, and wave symmetry all align at this region. 🎯
🚀 What’s Coming Next?
From the 0.382 level, BTC is primed for a strong bounce and the start of Wave 5 — historically the second-most explosive leg of the entire cycle.
This is where momentum accelerates, sentiment flips, and exceptional moves often ignite. ⚡🔥
📈 Wave 5 is loading… stay ready.

BTCUSDT 4H, aggressively sold off!We’re looking at BTCUSDT on the 4H timeframe.
After a strong bullish leg, BTC has been aggressively sold off from the upper supply zones and is now sitting inside the first major demand area.
🔑 Key zones on the chart (approx.):
4H FVG (supply): 95,000 – 97,500
Current demand zone / upper OB: 82,500 – 85,500
Major lower demand zone: 72,000 – 77,000
Price is at a decision point, and I’m mainly watching three scenarios:
Scenario 1 – Relief long into the 4H FVG
If price holds inside 82.5K–85.5K
and on the lower timeframes (15m / 1H) we get a clear bullish CHoCH + clean long OB,
BTC can easily print a relief rally toward the 95K–97.5K 4H FVG.
This would be a decent short-term long opportunity,
but as long as the 4H structure remains heavy and impulsively bearish,
I still treat it as a counter-trend move, not the start of a fresh macro bull leg.
Scenario 2 – Pullback to FVG and continuation down
My main working scenario:
BTC bounces from the current demand zone,
Fills the 4H FVG around 95K–97.5K,
Shows strong rejection + wicks + reversal candle + bearish CHoCH on LTF,
Then starts the next leg down toward the 72K–77K major demand zone.
For me, any serious swing/position longs make more sense down there,
not in the middle of this aggressive repricing move.
Scenario 3 – No strong bounce, straight flush to 72K–77K
If the current demand around 82.5K–85.5K completely fails
and we don’t see any meaningful bullish structure on lower timeframes,
BTC can simply bleed directly into 72K–77K without a big relief move.
In that case,
trying to long every little dip in the middle of the dump is basically fighting the flow.
I’d rather wait patiently until:
Either we get a proper relief rally into the 4H FVG (Scenarios 1–2),
Or price flushes into 72K–77K and gives a high-quality long setup from there.
🧠 Overall view (our style):
We’re in a distribution / repricing phase, not a clean trending leg.
Big, conviction longs for me belong closer to 72K–77K, not here.
Any long from current levels is tactical, short-term and LTF-based,
with tight risk and clear invalidation – not a “close your eyes and hold” type of trade.

BTC(based on NEo wave)everything is ok with flat.
time of wave B is more than wave A and wave C is making a beautiful impulse wave.
bitcoin price under 74500$ is a bear trap!

You will ask yourself, "how did he know Btc would dump to $80s"?On Oct 23rd I wrote:
"Btc bounce incoming off support? If not, and support is broken... long way down to 84K.
Too soon for concern, but Btc is currently bottom feeding off my lowest support".
Followers of my charts would know that "strangely accurate" calls have been made throughout Btc's recent months worth of price action. I anticipated the previous low (at $107K) and since September I have repeatedly expressed my concens about a dump to a lower low (see Sept-Oct Btc charts). The "3 Red Week Down Rule" warned us that this lower low was coming.
I simultaneously, posted charts warning that the altcoin market will be subject to the this "3 Red Week Down Rule"
2 days ago I reminded my followers of my "All In" target at 84,200K (WT target).
Today Btc has hit the WT ($84,200) as anticipated, and is resting in my buy zone (currently at $84K). You will ask yourself, "how did he know Btc would do that"?
Congrats to those of you who have made significant gains...following along my journey.
May the truth be with you!
BTC Next moveBTC gave a choch and bos / Trend line break conformation
market came without taking a supply from trend change area and there we can see FVG
so trend have to collect that FVG for continue sell trend
or break there structure for uptrend
📌 Please support me with your likes 🤞🏻 and comments 💬 to motivate me to share more analysis with you and share your any opinion about the possible trend of this chart with me !
Best Regards , Davis 🥰
Hit the like 🤞🏻 button to !! Motive some energy !!🥇
📌 Note :
⨻ Check the live market updates and analysis yourself before buy 📈🔺 or sell 📉🔻
⨺ Am not giving any advisory or signals its just my idea for upgrade my knowledge 📚 in trading
⨹ This is my pre and post market analysis to improve my trading journey 🚀
⨂ Am Not suggesting anyone to buy or sell ❌ am just giving my views 👀
⫸ You are responsible for your trading ✅ not me ❌ ⫷
HAPPY TRADING 🥰
Nov 21, 2025
Trade closed: target reached
bitcoin reach as expected on supply area around5000$ upside and down side gave target
HAPPY TRADING 🥰

Strong Support Holding - BTCUSD Buy OpportunityHello Followers, I am going to share you my opinion on BTCUSD next move.
BTCUSD is currently respecting the 89,000-90,000 support zone, indicating strong buying interest. A breakout and hold above support zone presents a high-probability buying opportunity towards the next move targets. As long as price remains above support, bullish continuation toward targets 93,600 and then 96,000 remains likely. If BTCUSD break the support zone then protect downside risk with a stop loss at 87,500.
KEYPOINTS:
Entry-level 90600
Target Area 93600
Target Area 96000
Stop loss point 87500
Support area 89000/90000

Bitcoin Next Move ? 108KWhy BTC Could Push Toward / Above $108K
Technical Setup
BTC is trading in a relatively tight range below the $107,500–$108,000 resistance.
Cycle & On-Chain Dynamics
Historically, Bitcoin bull cycles don’t peak immediately after a halving — this could mean room to run. Some analysts think we haven’t hit the top yet.
Some bullish chartists (e.g., “Titan of Crypto”) project a parabolic run if BTC clears $108K.
Is $108K A Realistic Next Move? Yes,

$BTC spot planBuying Bitcoin in purple box. Think 86k area will act as a good support. This is not a leverage trade. I am buying this spot so I can adjust my stoploss later if I want to.

BTC Potential Path - Multiple 30% Dips - Back to 120K SoonThis is usually how a run goes with multiple dips including 30% ones on BTC, its a healthy correction from going up for months. We are in a zone where we are repeating the dip from earlier in the year and are at a major support/demand zone. Falling below 75K will invalidate this chart and everything will be over. I think there are many bullish things that will happen towards the end of the year, rate cuts, QE, QT then stimulus next year. This might be the last dip ever? Not financial advice.

BTCUSD (Bitcoin) has broken powerful support = Time to sell!BTCUSD (bitcoin) has been in a new bearish trend for the last few weeks and has just recently broken a major support level which is shown (white line drawn) .. it has also broken the support level of an upward channel (the 2 red trendlines) ... The next very likely outcome for bitcoin is for it to hit and test the next support level all the way to the downside. SELL NOW!
BTC/USDT - Make-or-Break Demand Zone: Reversal or Breakdown?Bitcoin is now entering one of the most critical zones of its mid-term market structure. After a sharp decline from the 126k peak, price is sliding into the major demand block at 83,000–78,000, a region that previously acted as a springboard for the rally earlier this year.
This 3D chart clearly highlights a structural decision point:
➡️ Hold this zone → strong bullish continuation potential
➡️ Lose this zone → the market opens room for a deeper macro correction
The next few candles in this zone will shape the direction of the entire Q4–Q1 trend.
---
Why This Yellow Block Matters
The 83k–78k zone is not random. It represents:
The origin of a previous rally, where institutional buying stepped in aggressively
A macro demand cluster, confirmed by multiple touches and consolidations
A liquidity “rebalance zone”, often retested before trend continuation
A structural higher-low area in the broader bullish cycle
If BTC wants to maintain a macro uptrend, this is where buyers must show up.
---
Market Structure & Pattern Description
The chart shows a macro uptrend, followed by a deep correction from the top.
Price is now approaching the key retracement zone of the previous expansion.
This area previously formed a base pattern before the 50k → 126k breakout.
Candles entering the demand zone show seller exhaustion signals, but no confirmation yet.
A reversal pattern here (engulfing, long-wick rejection, inside bar break) would be the first bullish signal.
A clean 3D close below 78k would convert this demand zone into supply — a strongly bearish structural shift.
This is the type of zone where trends are born or destroyed.
---
Bullish Scenario (Reversal from 83k–78k)
For the bullish thesis to remain valid:
🔥 Conditions Needed
Rejection wick or bullish engulfing on the 3D timeframe
Higher low confirmation on daily
Return above key short-term resistance around 92,400
🎯 Bullish Targets
TP1: 92,000 (short-term reclaim)
TP2: 110,000 (macro mid-range)
TP3: 126,000 (previous high → breakout zone)
If buyers defend this zone, BTC maintains its macro bullish structure.
❌ Bullish Invalidation
A 3D full-body close below 78,000
Followed by failed attempts to reclaim the zone
---
Bearish Scenario (Breakdown of 78k)
If price fails to hold the demand block:
🔥 Breakdown Confirmation
Strong 3D candle close under 78k
Retest of 78k–83k as resistance
Increasing selling volume
🎯 Bearish Targets
Target 1: 72,000 (major liquidity zone)
Target 2: 62,000 range
Target 3: 49,000 (macro support from prior cycle)
A breakdown here would confirm a macro correction, not just a pullback.
❌ Bearish Invalidation
Price quickly reclaims 80k–83k with momentum
Failed retest turns into a deviation
---
Trading Notes
This is a macro (3D) zone — be patient.
Let confirmation develop, avoid knife-catching.
Use wide stops; 3D signals require larger breathing room.
Watch volume:
Increasing volume near the bottom = accumulation
Increasing volume on breakdown = distribution
#Bitcoin #BTCUSD #BTC #CryptoMarket
#PriceAction #DemandZone #CryptoTA #BullishScenario #BearishScenario #MarketStructure #CryptoOutlook #MacroAnalysis

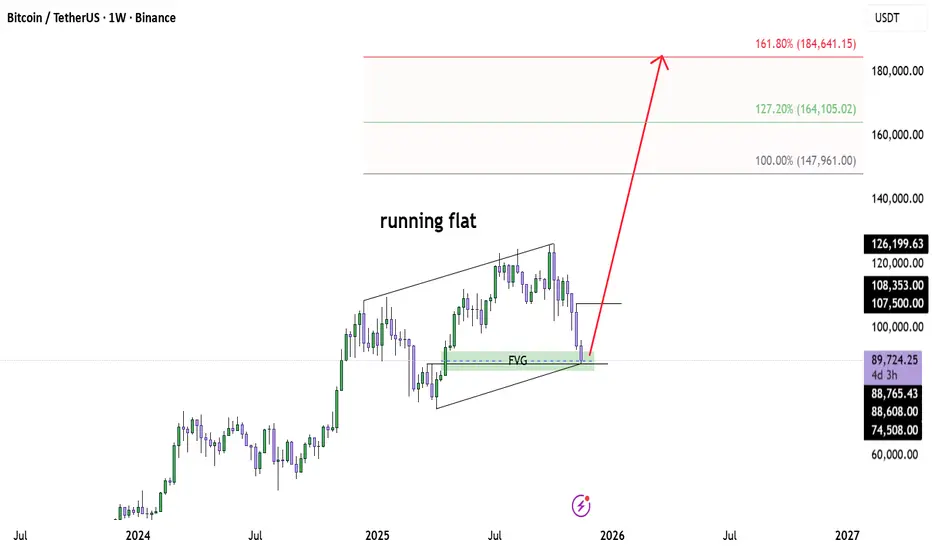
Bitcoin Macro Support Hit — Bull Cycle Ready to ExtendBINANCE:BTCUSD BINANCE:BTCUSDT
Bitcoin just tapped the weekly FVG + channel support, completing what looks like a running flat correction.
This zone has acted as a major demand area, and price reacted exactly where a higher-timeframe Wave 2 should finalise.
As long as BTC holds above this green support block, the bullish macro structure stays intact.
Upside targets for the next impulsive leg are:
147,961 (1.0 extension)
164,105 (1.27 extension)
184,641 (1.618 extension)
If this running flat is confirmed, Bitcoin may be entering a large Wave 3 — historically the most explosive phase.
Still watching weekly close for validation, but momentum is shifting.
⚠️ Disclaimer
This analysis reflects my personal view based on market structure and Elliott Wave principles.
It is not financial advice.
Always do your own research and manage your risk — the market doesn’t forgive careless entries.
The 2025 structure currently matches ~85% of the 2022 pre-bear Mhistorically BTC often touches EMA89 then retests EMA55 before a bear market and right now the chart structure looks similar to past cycle tops
Scenario A – Reclaim EMA55 (Bullish Recovery)
Chance: ~35%
Must close multiple weekly candles above EMA55
Would signal the bull trend is still intact
Correction becomes similar to 2013/2017 mid-cycle crash
Bullish targets:
$110k
$125k
$135k final blow-off
=============================
Scenario B – Rejection at EMA55 → Full Bear Market
Chance: ~65%
This is the historically normal outcome.
If BTC:
fails to reclaim the EMA55,
AND closes weekly candles below EMA89 →
Then this confirms a macro trend reversal.
Bearish targets (based on past cycles):
First major support: $72k–76k
Cycle bottom zone: $55k–63k
Extreme wick target (like 2020 crash): $48k (low probability)

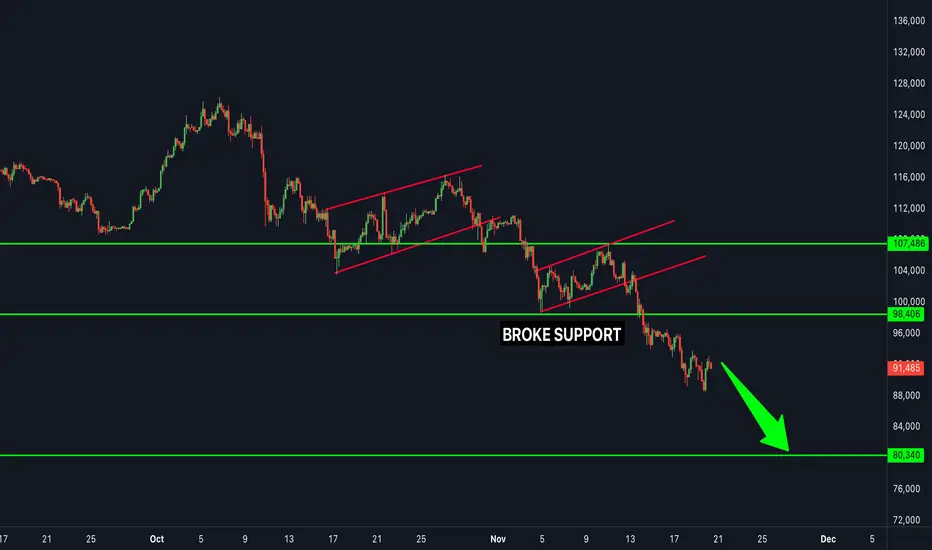
Avoid chasing long positionsBTC has broken below the key level of 90000 today, with the downtrend becoming clear.
If the support around 87500 is broken, it may continue to decline
Accurate signals updated daily. They serve as a reliable guide for trading issues – feel free to refer to them. Hope they help!
