Bitcoin Macro Support Hit — Bull Cycle Ready to ExtendBINANCE:BTCUSD BINANCE:BTCUSDT
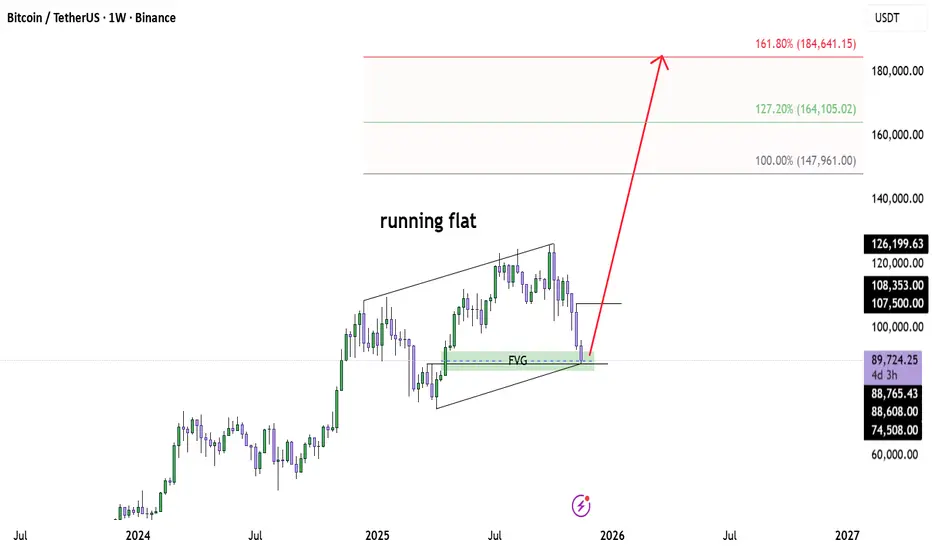
Bitcoin just tapped the weekly FVG + channel support, completing what looks like a running flat correction.
This zone has acted as a major demand area, and price reacted exactly where a higher-timeframe Wave 2 should finalise.
As long as BTC holds above this green support block, the bullish macro structure stays intact.
Upside targets for the next impulsive leg are:
147,961 (1.0 extension)
164,105 (1.27 extension)
184,641 (1.618 extension)
If this running flat is confirmed, Bitcoin may be entering a large Wave 3 — historically the most explosive phase.
Still watching weekly close for validation, but momentum is shifting.
⚠️ Disclaimer
This analysis reflects my personal view based on market structure and Elliott Wave principles.
It is not financial advice.
Always do your own research and manage your risk — the market doesn’t forgive careless entries.
Btcusdbuy
The 2025 structure currently matches ~85% of the 2022 pre-bear Mhistorically BTC often touches EMA89 then retests EMA55 before a bear market and right now the chart structure looks similar to past cycle tops
Scenario A – Reclaim EMA55 (Bullish Recovery)
Chance: ~35%
Must close multiple weekly candles above EMA55
Would signal the bull trend is still intact
Correction becomes similar to 2013/2017 mid-cycle crash
Bullish targets:
$110k
$125k
$135k final blow-off
=============================
Scenario B – Rejection at EMA55 → Full Bear Market
Chance: ~65%
This is the historically normal outcome.
If BTC:
fails to reclaim the EMA55,
AND closes weekly candles below EMA89 →
Then this confirms a macro trend reversal.
Bearish targets (based on past cycles):
First major support: $72k–76k
Cycle bottom zone: $55k–63k
Extreme wick target (like 2020 crash): $48k (low probability)

Avoid chasing long positionsBTC has broken below the key level of 90000 today, with the downtrend becoming clear.
If the support around 87500 is broken, it may continue to decline
Accurate signals updated daily. They serve as a reliable guide for trading issues – feel free to refer to them. Hope they help!

BITCOIN SIGNAL: NOBODY COUNTS ON THIS!!! (scary)Yello Paradisers! Enjoy the video!
And Paradisers! Keep in mind to trade only with a proper professional trading strategy. Wait for confirmations. Play with tactics. This is the only way you can be long-term profitable.
Remember, don’t trade without confirmations. Wait for them before creating a trade. Be disciplined, patient, and emotionally controlled. Only trade the highest probability setups with the greatest risk to reward ratio. This will ensure that you become a long-term profitable professional trader.
Don't be a gambler. Don't try to get rich quick. Make sure that your trading is professionally based on proper strategies and trade tactics.

Bitcoin’s Price at $90,000 Is Signaling a Bottom Formation
Bitcoin trades at $90,331 and holds above the $89,800 support level, which has become a key buffer during the decline. The recent drop to a multi-month low has increased caution, but technical and behavioral signals suggest downside pressure is easing.
Based on investor support and historical patterns, a deeper drop appears unlikely. A bounce from $89,800 could push BTC back toward $95,000 as confidence improves. Strengthening demand and exchange outflows reinforce the possibility of a recovery in the near term.
If bullish momentum fades and broader weakness intensifies, Bitcoin could slip below $89,800 and fall toward $86,822. Such a decline would invalidate the current bullish thesis and signal a deeper retracement.
BITCOIN BIG HIGH BUY PROBABILITY SETUP SOON!!!🚨 BITCOIN HIGH PROBABILITY BUY SETUP 🚨
* Here We Can See Clearly The Next Potential Moves For BTCUSD Coming Hours/Days.
* Keep Your Eyes Close On Your Trading Positions.
* Happy PIP Hunting Traders.
FXKILLA.

Btc - This is what may happen nextJust a Btc thought experiment. It's good to anticipate price action so you know if and when we need to invalidate our trading idea.
Those that follow, may remember I sold all my crypto (at the top), when I was repeatedly saying the crypto market will soon have a lower low...because of the "3 Red Week Down Rule".
Now that Btc hit the lower low, I believe Btc is in for a bounce soon. Maybe Btc bounces now, and then lower to $84K. Or maybe one last flash down to $84K now. Idk, my cystal ball is still in the shop.
Either way, I believe Btc (and some alts) have or are the process of bottoming, and preparing for a bounce.
Btw I have been waiting for this $84K Btc "WT" target for months. Going back into the market in this region is a good idea (with proper risk management). Although to be honest, I have shifted my attention to stocks in recent weeks as you may have noticed. Recent price action in the crypto market, should explain why I stopped following it. But now it's time to pay attention, that Btc's recent low was within 5% of my $84K target.
May the trends be with you

Btc - NEXT LOW TARGET- My All in targetOn Oct 23rd I suggested that if Btc broke below $96K, it would drop to $84K. $96 just broke 4 days ago, and Btc already hit $89K. For those that were in doubt...$84K is starting to look pretty reasonable now.
Btw $84,200 is a WT target and I usually go in heavy on those. If the pattern holds true to form, then I anticipate a big bounce from around $84K, back up to at least $99K.
May the trends be with you

BTC Downtrend With Short-Term Rebound TargetBTC is trading in a clear downtrend, breaking below the central level and approaching the support zone. A short-term corrective bounce toward 92,000 is highlighted, but overall structure still shows bearish pressure under major resistance and BOS levels.

Bitcoin RSI Oversold Again - Is Another bounce Coming?Bitcoin chart highlights a repeating pattern on Bitcoin’s daily timeframe: every time the RSI drops into oversold territory (below 30), it has historically marked a major local bottom followed by a strong recovery.
On the price chart above, each green arrow represents a previous swing low. On the RSI panel, the boxed areas show moments when RSI dipped below 30. Every one of these events has been followed by a noticeable rebound in Bitcoin’s price.
We are now seeing the same setup again. RSI has once again fallen into the oversold zone, aligning with another green arrow on the chart. If history repeats, we could see a similar recovery this time too, just as Bitcoin has done consistently over previous cycles.
Key Points
- Historically on the daily chart, whenever RSI dropped below 30, Bitcoin experienced a recovery soon after.
- The current RSI reading is tapping this same level again.
- This confluence suggests a potential bottoming zone and possible trend reversal.
- While not a guarantee, the pattern has been reliable across multiple past cycles.
Cheers
hexa

BTC market on fire, sharp dropBTC Daily Timeframe – Short Summary
BTC is forming a bearish 5-wave Elliott structure:
Wave (3) seems to have bottomed around 94,000.
Price is now expected to make a Wave (4) pullback toward 100,000–101,000 (major resistance).
After that, BTC is likely to drop again in Wave (5) toward the 80,000–82,000 zone (1.618 extension).
Technical signals:
BTC is below all EMAs (34/89/200) → trend still bearish.
200 EMA near 104,800 is strong resistance.
Key supports: 94k, then 80k.
Bias: Bearish while below 104k–105k.

Potential BTCUSD RUsh to $155KPrice action has reached our anticipated support level of $89,000, a critical threshold we identified in our previous analysis.
Based on current technical structure, we are positioning for a potential rally toward $155,000 in the next 24weeks.
However, over the coming weeks, with our target window extending through January 26th.
Forward Outlook:
The manner in which price navigates to this level will be instrumental in shaping our 2025 outlook. We are monitoring two primary scenarios:
Bullish Case: A sustained move higher could establish new targets at $145,000
Bearish Case: Failure to maintain momentum may result in a retracement toward the $78,000-$65,000 range
We are intentionally keeping technical details concise to maintain clarity for our portfolio holders.
Further updates will be provided as market conditions develop.
Disciplined patience remains our guiding principle.
Ieios Capital

Bitcoin $BTC price analysis we need your vote !💥 Final “dip” of November?
💰 Will CRYPTOCAP:BTC drop to $91,600
to close that old GAP on the chart? 🤔
🟢 Bullish case: $100K holds → next rally begins.
🔴 Bearish case: gap fills near $91,600 → possible reversal after.
What do you think — final washout or just a pause before the next move?, vote at comments
______________
◆ Follow us ❤️ for daily crypto insights & updates!
🚀 Don’t miss out on important market moves
🧠 DYOR | This is not financial advice, just thinking out loud.

BTC to fire up!Looking at the structure, it seems like selling is over and we are about to turn around. This is potential bottom for BTC.

Bitcoin (BTCUSDT) – Short-Term Bearish StructureHi!
The chart shows BTC moving inside a descending channel, with consistent lower highs and lower lows confirming a controlled downtrend. Recent price action attempted to push back into the QML (Quasimodo Level) area, but the reaction there shows clear rejection, suggesting supply remains in control.
Price is now falling toward the lower boundary of the channel, where a short-term bounce is possible. However, unless BTC breaks above the QML zone and the descending trendline, the broader expectation remains bearish.
The projected path suggests:
A drop into the channel low,
A corrective pullback,
And then a continuation lower toward the next major support zone around 89,700 – 89,800.
Overall, momentum and structure both support a bearish continuation unless buyers manage to reclaim the supply zone above.

Bitcoin trading strategyNew Dimension of Core Logic: Breaking Out of Liquidity Traps, Focusing on Structural Variables
1. Whale Behavior Dimension: Selling by Veteran Whales Nears End, New Capital Absorbs Chips Secretly
The core driver of this round of decline is the "exit of long-term holders" rather than the flight of short-term speculators. Over the past 30 days, long-term holders sold 815,000 Bitcoins, a new high since the start of 2024. Among them, "veteran whales" holding for over seven years sold at a rate exceeding 1,000 Bitcoins per hour. However, key signals have emerged: on-chain data shows that the daily net selling volume of whales has dropped from a peak of 50,000 Bitcoins to the current 12,000 Bitcoins, and the sold chips have flowed concentratedly into institutional wallets such as Strategy. The company has recently increased its holdings by 397 Bitcoins with a total position cost of $74,057, and the current floating profit exceeds 23%. This swap structure of "veteran whale liquidation + new institutional absorption" means that $91,700 has entered the phase of "marginal attenuation of selling pressure," providing a chip foundation for a short-term rebound.
--------------------------------------------------------------------------------
2. Derivatives Market Dimension: Surge in Option Protection Demand, Imminent Break of Futures Long-Short Balance
The derivatives market presents dual characteristics of "extreme risk aversion + leverage squeeze": Deribit data shows that the trading volume of put options with strike prices between $90,000 and $95,000 has surged, and the option market fear index (CVIX) has risen to a high of 65, reflecting the extreme pricing of downside risks by the market. But the futures market has shown signs of reversal: 180,000 traders were liquidated in the past 24 hours, including $510 million in long liquidations and $170 million in short liquidations, indicating that the long leverage squeeze is drawing to a close. Meanwhile, although the funding rate remains at -0.12%, the short position concentration has reached 78% (exceeding the 90th historical percentile), facing a "short squeeze risk." Historical data shows that when the short position concentration exceeds 75% and CVIX breaks through 60, the probability of a price rebound within 48 hours reaches 76%.
Bitcoin trading strategy
buy:91000-92000
tp:94000-95000
sl:90000

Bitcoin Reversal Setup Toward 96K TargetBitcoin is currently trading within a corrective structure after breaking down from the central zone. The chart highlights a fair value gap (FVG), a support level below, and a potential short-term bullish push toward the 96,000 target before any deeper move. The market remains in a ranging phase with key levels marked for possible reactions.

BITCOIN:LIVE TRADEHello friends
You know that this is a risky situation, so observe risk and capital management.
The price has risen after the decline, has collected good liquidity, and now it has fallen again, has collected low liquidity, and is waiting now that this floor has been made, to move to the specified targets. Of course, the opening of the US government is also effective.
Observe capital management.
*Trade safely with us*

BTC Daily View 17.11Hey friends! How’s your trading week starting off?
In my last Bitcoin post, I shifted my invalidation zone from 96,600 to 95,545 and said that if 95,545 breaks, then 96,600 won’t hold either.
Well… it broke — so I revisited the chart.
Now I think the correction after the drop should be bigger than I first expected.
For now, I’m looking at a move up toward 98,400, and then a possible continuation of the downtrend.
I still see two paths — along the orange and purple arrows.
❌ Invalidation zone: 94,850
⚠️ Not financial advice — just sharing my view.
Trade your own plan, always use stops.
⭐ Follow for updates
💬 Drop a reaction in the comments!

BTC on the brink of explosion: Wave 5 is charged –BTC on the brink of explosion: Wave 5 is charged – those who are not up are late.
🌀 Wave Structure
On the weekly chart, BTC is forming a major impulse, where:
Wave 3 is already complete (characteristic super-sharp rise + volume extremes).
The market is now in the area of wave 4—an extended correction moving sideways.
Wave 5—the next wave in the cycle—is preparing to launch but requires confirmation through a resistance breakout.
The correction looks like this:
A–B–C (flat correction or sideways zigzag)
Wave A—a sharp decline.
Wave B—a rebound without breaking the high.
Wave C—a fading decline/flat.
This is a classic pattern before the start of the final impulse.
📍 Key Resistance Levels
$71,500—the main trigger level for wave 5.
A breakout opens the way for a trend acceleration.
$75,000—the boundary of a new impulse zone. Support
$64,000 is the support zone for wave 4.
Holding it is critical.
$60,500 is the deep support for wave C.
Only a breakout of this support will cancel the bullish scenario.
📈 Weekly Scenarios
🟩 Bullish Scenario (Main)
BTC holds the $64,000–$66,000 range, forming the bottom of wave 4 →
breaks $71,500 →
wave 5 activates.
Wave 5 Fibonacci targets:
$78,000
$82,000
Maximum extension: $89,000
🟥 Bearish Scenario (Alternative)
If the price breaks below $64,000, the structure turns into an extended zigzag. Then wave C could drop to:
$60,500
Extreme: $57,800
From there, there's a high probability of an upward reversal—the start of wave 5 is simply shifted in time.
🎯 Summary
BTC has reached its conclusion:
🔥 Above $71,500—the start of a powerful wave 5 and a new historical impulse.
⚠️ Below $64,000—wave 4 deepens before the final push.
This week promises to be a decision point: either a sharp upward move or a final liquidity boost at the bottom.

BTC/USD – Liquidity Sweep Setup With Potential Bullish ExpansionBitcoin is currently ranging near the lower liquidity zone around 93,894, where the market has previously reacted. Price is forming compression into the lows, suggesting that sellers are losing momentum and liquidity is building underneath. If the market sweeps this blue liquidity line, a strong bullish reaction can be expected.
Once liquidity is taken, the first upside target aligns perfectly with the high-volume node at 99,659, where the market previously consolidated. A clean break and hold above this level opens the door for a deeper bullish expansion toward the second major target around 105,125, which matches another high-volume node and previous structural resistance.
Market is currently trading below the EMAs, showing temporary bearish control — but overall structure hints that market makers may be engineering a liquidity grab before a strong reversal.
Key Points:
Liquidity resting at 93,894 (likely stop-hunt zone).
Target 1: 99,659 – first major volume imbalance & resistance.
Target 2: 105,125 – major high-volume node and strong resistance.
Expect bullish reversal ONLY after liquidity sweep.
EMAs show bearish short-term trend, but compression suggests reversal potential.

Bitcoin Downtrend Continues: Bearish Target at $93,500Bitcoin is trading in a clear downtrend channel, repeatedly rejecting the trendline after liquidity sweeps. Support zones above have already been broken and retested as resistance, signaling bearish momentum. Price is currently consolidating near the lower channel, with a potential drop toward the target zone around $93,500.

