Bitcoin (BTC/USDT) – Long Bias AnalysisPrice is currently trading inside a key demand zone where buyers previously showed strong interest. After the recent sell-off, BTC has stabilized around this support area and is now showing signs of accumulation, suggesting a potential reversal to the upside.
From my current entry zone, I expect Bitcoin to push higher and target the previous major high around 107,465.98, which aligns with the bullish zone highlighted on the chart. This area represents the next significant liquidity pocket where price may look to tap before any deeper correction.
My stop loss is set at 94,016.34, positioned safely below the support zone to protect the trade in case of unexpected downside continuation. As long as price holds above this level and maintains structure, the bullish outlook remains valid.
Overall, I’m looking for BTC to build momentum from this zone and drive upward toward the high, in line with the broader market structure shown on the chart.
Btcusdbuy

Core Logic for Short-Term Long PositionsCore Logic for Short-Term Long Positions
1.Distinct Sentiment Rebound Signals After BottomingMarket sentiment is near the historical bottom zone. Amplified negative talks on social media and retail investors’ phased withdrawal are typical signs before repeated market stabilization after stopping declines. The NUP ratio has fallen to 0.476. This range has repeatedly marked short-term bottoms historically, spurring several double-digit rebounds over the past year and offering sufficient room for sentiment recovery.
2.Resonant Technical Support with Strong TenacityAs the 0.618 Fibonacci Retracement of the recent downtrend, $94,200 proved effective as support in Q4 2024. It rebounded sharply after hitting $94,000 this time, forming a solid support. Now the price has firmly held the key short-term support at $95,543. The shrinking MACD Histogram signals fading bearish momentum and emerging bullish counterattacks, laying solid technical ground for a rebound.
3.Latent Upsides in On-Chain Data and Capital FlowOn-chain data reveals mid-and-small BTC holders (1 - 1000 BTC) have kept net accumulation since early October, while "smart money" is positioning via the pullback. Though the market is in the doldrums, the OTC market has stable receiving capacity and no large-scale panic selling, providing basic capital backup for the short-term rebound.
Bitcoin trading strategy
buy:95000-96000
tp:97000-98000
sl:93500
Triple Resonance Lays a Solid Foundation for Upside Core Logic for Going Long: Triple Resonance Lays a Solid Foundation for Upside
1. Institutional Trends: Strong Low-Level Absorption, Clear Capital Layout Signals
Despite short-term profit-taking in the market, institutional capital continues to flow in at low levels. According to CoinDesk data, large institutional buy orders emerged in the $94,000 support zone, with OTC market trading volume reaching $18.6 billion in 24 hours—surging 42% from the recent average. Institutions like JPMorgan and Galaxy Digital absorbed selling pressure through the OTC market. Meanwhile, the outflow trend of ETF funds has slowed, with net outflows narrowing to $120 million in the past 3 days—a stark contrast to the previous daily outflows of $500 million—reflecting institutions’ "buying on dips" behavior. Historical data confirms that concentrated institutional absorption at the Fibonacci 0.618 retracement level (corresponding to $94,200) leads to an 83% probability of growth in the subsequent month.
2. Fundamentals: Solid Hash Rate Support, Uncompromised Network Security
Mining fundamentals continue to improve, providing underlying support for prices. Bitcoin’s hash rate momentum indicator remains in positive territory and continues to rise, with the current hash rate stable above 370 EH/s. There has been no "miner capitulation selling" typically seen during sharp declines. Miners’ balances remain stable, with a 30-day net selling volume of only 0.8%—far below the 5% average during bear markets—indicating high miner recognition of current prices. Network security and consensus foundations have not been affected by the correction. The divergence between hash rate and price signals potential for subsequent price catch-up.
3. Technicals & Sentiment: Resonance of Supports + Sentiment Bottoming, Rebound Conditions Mature
Technically, multiple supports form a resonance. $95,600 lies between the $94,200 Fibonacci 0.618 support and the short-term key support at $95,543—a zone whose effectiveness was verified during the Q4 2024 rally. On the daily chart, MACD green bars continue to shorten, with bearish momentum gradually fading. The RSI indicator has rebounded from the oversold zone to 41, signaling the end of short-term adjustments. In terms of market sentiment, the Fear & Greed Index has dropped to a low of 28, leaving ample room for sentiment recovery. Trading volume has shrunk from 27,579 BTC during the previous volume-driven decline to a current low of 165 BTC, indicating phased exhaustion of selling pressure and distinct characteristics of consolidation and bottoming.
4. Macroeconomic Environment: Policy Expectation Game, Limited Downside Room
Uncertainty surrounding Fed policy persists, but the market has fully priced in hawkish expectations. The economic recession risks and affordability crisis mentioned by New York Fed President Williams provide potential support for a December rate cut. While market pricing for rate cuts fluctuates, there is limited room for further downside. After the end of the U.S. government shutdown, sentiment toward risk assets has improved. As a high-elasticity risk asset, Bitcoin is expected to benefit from expectations of liquidity easing and rally in resonance with U.S. stocks and commodities.
Bitcoin trading strategy
buy:95000-96000
tp:97000-98000
sl:93500

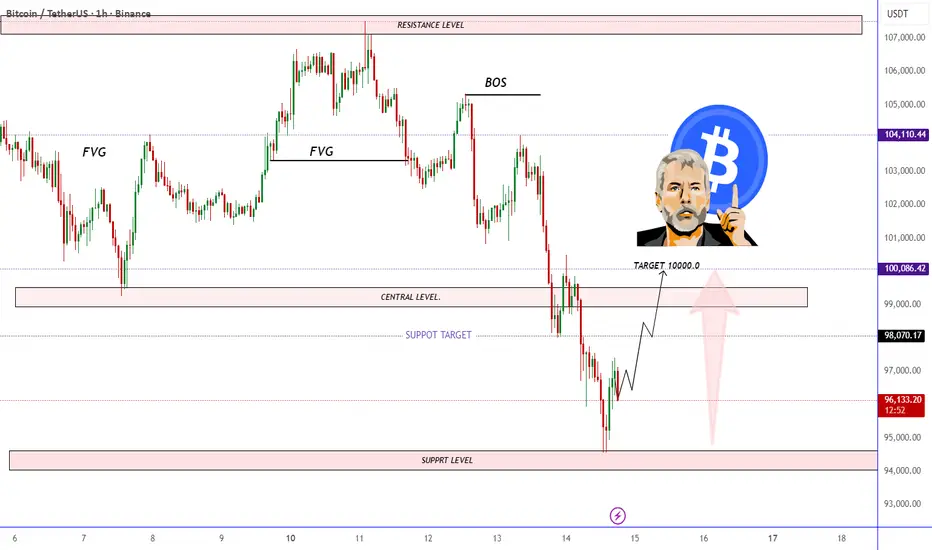
Bitcoin Price Reversal Setup Targeting the 100K ZoneA Bitcoin price chart highlighting key ICT concepts including FVGs, BOS, support and resistance levels. The analysis suggests a potential bullish retracement from the support zone toward the central level, targeting the 100,000 USDT region. The layout shows expected price movement with marked liquidity zones and structural shifts.
“BTC Liquidity Sweep → Bounce”BTC Trendline Break Setup
⸻
🔍 Quick Summary
I’m seeing BTC react strongly from the 0.618 retracement + demand zone, and the bearish trendline is losing power with every touch. The next interaction with this trendline looks primed for a clean breakout, and I’m positioning myself for a move toward the liquidity sitting above the weak high 🔥.
⸻
📊 Deep Analysis
Price has tapped into a major area of demand just above 94k–90k, which lines up perfectly with the 0.618 FIB from the larger swing. This zone has previously acted as a strong base for impulsive moves, and I’m seeing that same type of absorption now — long wicks, slowing bearish momentum, and a clear BOS structure forming.
The descending trendline has produced multiple rejections, but each reaction is getting smaller. That usually signals seller exhaustion. The BOS at the bottom of the structure confirms a short-term shift, and I expect price to make its way back up to retest the trendline one more time.
Above current price sits a Weak High at ±135k, which is almost always a magnet for liquidity. The chart even shows a projected long setup targeting this level with a ~41% move. Given BTC’s market context, this is a realistic target if the trendline breaks.
Volume confirms compression, and the recent BOS + CHoCH sequence suggests buyers are slowly regaining control. As long as 87k holds, this bullish structure remains intact.
⸻
🎯 Trade Idea Scenario
Bullish Scenario
• Entry: In the 94k–90k demand area (already reacting).
• Confirmation: Break + retest of the descending trendline.
• TP1: 106k (FIB 0.382 / prior structure).
• TP2: 135k (weak high liquidity target).
• SL / Invalidation: Below 87k — that would break the demand structure and shift the narrative bearish.
Bearish Scenario
• Only valid if BTC rejects the trendline hard and closes below 87k.
• That would open the path to 80k and possibly to the strong low around 72k.
• At the moment, this seems less likely based on the reaction inside demand.
⸻
📌 What I’m Watching Next
I’m watching how BTC behaves when it reaches the trendline again. A strong close above it with volume will confirm the bullish continuation. If price stalls or produces heavy wicks, I’ll wait for clearer structure before adding to the position.
⸻
⚠️ Disclaimer
This is just my personal analysis and not financial advice. Always do your own research and manage risk carefully 📉📚.

understanding how technical workson btc move and learning, we firstly need to view back starting from the week 1 timeframe down to D1 H4 H1 M30 M15 and M5 to understand how the chart move and view. without understanding the past candle knowing the current market wont be easy because the current and past works together so we focus firstly on both, then by checking the move its show to determine what the next movement will give.

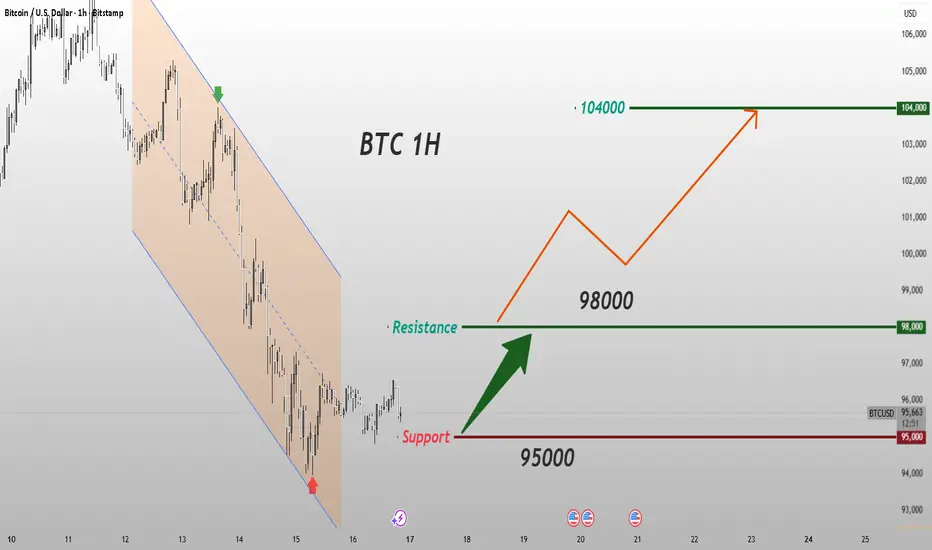
#BTC/USDT – Support Reversal & Bullish Recovery Outlook#BTC
The price is moving in a descending channel on the 1-hour timeframe and is expected to break out and continue upwards.
We have a trend to stabilize above the 100-period moving average again.
We have a downtrend on the RSI indicator, which supports an upward move if it breaks above it.
We have a key support zone in green that pushed the price higher at 95327.
Entry price: 95815
First target: 96158
Second target: 96865
Third target: 97661
For risk management, don't forget stop-loss orders and capital management.
The stop-loss should be below the green support zone.
Upon reaching the first target, take some profits and then change the stop-loss order to an entry order.
For any questions, please comment.
Thank you.

Start Accumulating BTC!Bitcoin has reached a major demand zone between $91,000–$97,000, an area that has consistently acted as a strong support throughout 2024–2025.
Price has now tapped the bottom of this accumulation zone, where buyers previously stepped in aggressively.
Key Points:
BTC is sitting inside a high-probability bounce zone.
Historically, this region has triggered strong upward reversals.
Market structure is still intact as long as price holds above $91,000.
Perfect area for long-term positioning.
Start accumulating BTC within this support zone.
This is one of the cleaner levels to build exposure before the next macro move.

BITCOIN SIGNAL: IS THIS THE END OF BITCOIN CYCLE??!!!(get ready)Yello Paradisers! Enjoy the video!!!!!
And Paradisers! Keep in mind to trade only with a proper professional trading strategy. Wait for confirmations. Play with tactics. This is the only way you can be long-term profitable.
Remember, don’t trade without confirmations. Wait for them before creating a trade. Be disciplined, patient, and emotionally controlled. Only trade the highest probability setups with the greatest risk to reward ratio. This will ensure that you become a long-term profitable professional trader.
Don't be a gambler. Don't try to get rich quick. Make sure that your trading is professionally based on proper strategies and trade tactics.

btc await breakout to sell#BTCUSD price needs reverse above the 98k which holds sell continuation, possibly decline still holds below 94600 on sell.
Sell limit 98k, target 93k-90k, stop loss 99300.
Bullish isn't strong now, we need multiple breakout above 100k before Bullish range can be formed.

releasing the Bull with steroidsAfter almost two months of back and forth, Bitcoin has finally reached the price that the algorithms had programmed, opening the way for the continuation of the rise that targets 129,900 and later 145,000. The elements involved: two megaphones and two flags. This should be very explosive.

BTC Analysis | CME GapHello friends
Bitcoin’s critical gap between $91,500 and $92,500 could serve as a short-term correction target if selling pressure continues.
A gap that closes could set the stage for a bottom and a continuation of the uptrend.
The price’s reaction to this area will determine the market’s next direction.
Don't forget risk and capital management.
*Trade safely with us*

BTCUSDT - The manipulation Festival!Bitcoin has already formed a rising wedge pattern, broke it downward after retesting it, and continued falling, even breaking below 100K just like you wanted? There’s also a death cross forming on the chart… and from here I’ll just sit back and watch the manipulation festival.
Bitcoin never forms a bearish pattern and hits its targets the way people expect — not until it wipes out every type of trader first. And look at the candlestick formation I predicted; Bitcoin followed it exactly, to the millimeter, on the 3-day chart.
The idea that Bitcoin is actually bearish and will drop more than this is a joke to me — something absurd. What about the people who have been holding short positions for the past 10 days? Nobody’s going to ask about them?
It’s their turn now, of course… You’ve taken your profit and now you’re greedy for more downside?
Come on, let’s liquidate all of you the same way we liquidated the long positions earlier, and the same way spot traders got shaken out. Let’s make everyone lose hope and exit the market.
The market is built on manipulation, and technical analysis is just a tool to understand where that manipulation happens — nothing more.
Study my candlestick projection carefully, because that’s exactly what’s going to happen in the coming days. And remember what I said.
Best Regards:
Ceciliones🎯

BTC/USD – Eyes on the Double Bottom ReversalAfter weeks of consolidation and a sharp dip that shook out weak hands, IG:BITCOIN appears to be setting up for its next major leg higher. The 4-hour chart reveals a textbook double bottom formation, a pattern that often marks the end of a correction and the beginning of a fresh uptrend.
The Setup
Following Bitcoin's rejection from the $126K zone in early November, we witnessed a measured retracement that found support near the $98K-$100K level. This crucial support zone has now been tested twice, forming two distinct lows that create the foundation of our double bottom pattern. The neckline, sitting around $104.6K, has been breached with conviction, suggesting buyers have regained control.
What makes this setup particularly compelling is the measured move target. By projecting the formation height from the breakout level, we arrive at a first target around $111.5K—conveniently aligned with the 0.618 Fibonacci retracement level. This confluence adds weight to the bullish thesis.
The risk-reward here is attractive. With a stop loss positioned just below the recent swing low at $101K, roughly a 3:1 reward-to-risk ratio.
The Path Forward
If IG:BITCOIN maintains support above the neckline and current price action, the path of least resistance appears to be upward. The measured move projection suggests we could see a structured advance through the $108K-$111K zone in the coming sessions. Beyond the immediate target, the chart hints at even more ambitious levels, with the all-time high region at $126K coming back into focus if momentum continues.
Of course, IG:BITCOIN doesn't move in straight lines. Expect consolidation phases and potential retests of the neckline as support. The key is whether buyers continue to defend the $104K-$105K zone on any pullbacks.
📝 TL;DR
Bitcoin has formed a double bottom pattern after testing $98K-$100K support twice. The neckline breakout at $104.6K targets $111.5K, offering an attractive risk-reward setup. Invalidation occurs below $101K.
---
Invalidation: A sustained break and 4H close below $101K would negate the bullish structure and suggest the correction may extend lower toward the $98K support zone.
---
*Note: This analysis is for educational purposes. Always conduct your own research and manage risk appropriately.*

ANFIBO | Bitcoin BTCUSD - Bet a Buy order [11.14.2025]Hi traders, Anfibo’s here!
BTCUSD – Technical Outlook
Technical Structure:
BTC is now trading extremely close to a major structural support zone, aligning with the 61.8% Fibonacci retracement around the $94,000 region. This confluence makes the area a high-value reaction point—historically, 61.8% fib zones often act as strong bases for corrective rebounds during healthy bull-cycle pullbacks. Momentum is slowing down as price compresses into this support cluster, signaling that the market is preparing for a potential relief bounce… unless the level fails.
Trading Strategy:
Our approach today focuses on respecting this key confluence zone.
If BTC stabilizes above 94k, a short-term rebound toward 110,000 USD is a realistic target.
However, if price breaks below 91,000 USD, structure becomes decisively bearish, exposing deeper supports and invalidating the rebound setup.
This is a “react at the level, not before the level” type of day.
Daily Trading Plan:
>>> BUY ZONE:
ENTRY: 93,500 – 95,000
SL: 90,500
TP: 110,000
(Looking for a clean rebound from the 61.8% confluence, ideally with volume pickup or bullish rejection candles.)
>>> SELL ZONE: (only if 91k breaks cleanly)
ENTRY: 90,000 – 91,000 (retest of breakdown)
SL: 94,000
TP: 87,000 → 80,000 → 77,000 → 72,000 → 63,000
(A structural breakdown would shift momentum from corrective to impulsive downside.)
Risk Management:
Keep size moderate; counter-trend buys at major supports require disciplined SL usage.
If entering long, move stop to breakeven once price clears 98k–100k to reduce downside exposure.
Never average down near broken supports; wait for structure to confirm strength before adding.
If the 91k level breaks, switch to defensive mode — reassess bias and avoid catching falling knives without confirmation.
Conclusion:
BTC is sitting on one of its most important confluence supports at 94k. A rebound from here can push price toward 110k, but a clean breakdown below 91k will shift the broader narrative toward a deeper corrective leg with multiple supports waiting below (87k → 80k → 77k → 72k → 63k). Today is a critical inflection point—let the level decide the direction and react accordingly with disciplined execution.
GOODLUCK GUYS!!!

BITCOIN SIGNAL: HERE IS WHATS NEXT!!!! (boom)Yello Paradisers! Enjoy the video!
And Paradisers! Keep in mind to trade only with a proper professional trading strategy. Wait for confirmations. Play with tactics. This is the only way you can be long-term profitable.
Remember, don’t trade without confirmations. Wait for them before creating a trade. Be disciplined, patient, and emotionally controlled. Only trade the highest probability setups with the greatest risk to reward ratio. This will ensure that you become a long-term profitable professional trader.
Don't be a gambler. Don't try to get rich quick. Make sure that your trading is professionally based on proper strategies and trade tactics.

Bitcoin Bearish Reversal SetupBitcoin is showing a potential bearish setup as the price approaches the central resistance zone. A rejection from this area could lead to a downward move toward the 101,500 target level, with selling pressure expected below the trendline.

ANFIBO | Bitcoin BTCUSD - UP or DOWN? [11.13.2025]Hi traders, Anfibo’s here!
BTCUSD – Technical Outlook
Technical Structure:
On the higher intraday frame, BTC is running an H1 uptrend — higher highs / higher lows are still intact and the structure favors the bulls. However, on the lower intraday frame (M15) price is trapped inside a short-term descending trend, creating compression between the bullish H1 bias and the bearish M15 micro-structure. That interaction is producing chop around the ~102,000 area and increases the value of waiting for a clean directional resolve (breakout + retest) before committing.
Daily Trading Strategy:
Our approach today is simple and veteran-focused: wait for the breakout of the conflicted edge and trade in the direction of the break after a proper test.
If price breaks up out of the M15 downtrend: wait for the pullback / downtest, then buy near the test level (~102,000).
If price breaks down through H1 support / the current compression: wait for the retest of that broken edge, then sell near ~102,000.
This “break → retest → trade” workflow avoids getting caught in false moves and puts probability in our favor.
Daily Trading Plan:
>>> SELL ZONE:
ENTRY: 101,500 – 102,500 (on confirmed breakdown + failed retest)
SL: 104,500 (above the immediate M15 channel / invalidation level)
TP: 96,000 (TP1) — 92,000 (TP2)
>>> BUY ZONE:
ENTRY: around 102,000 (on confirmed breakout + clean downtest)
SL: 99,500 (below the downtest low / invalidation level)
TP1: 108,000
TP2: 112,000
(Notes on entries: the same ~102k area becomes the decision point — trade only after structure confirms: for buys, look for bullish confirmation on the retest (rejection wick, bullish engulf, rising volume); for sells, look for bearish rejection on retest or inability to reclaim the edge.)
Risk Management:
Keep position sizes small-to-medium while the pair remains in a compressed range; risk 1–2% of equity per full setup.
Use stop losses as listed and never widen SL to “hope” — adjust size instead if you need a wider stop.
Prefer scaling: take a starter size at first confirmation and add only after the trade behaves in your favor (e.g., after TP1 or strong momentum continuation).
Avoid trading into major macro prints or news; if a scheduled event is imminent, reduce size or stand aside until clarity returns.
Conclusion:
Today’s market is a classic “higher-frame bias vs. lower-frame conflict” scenario. The H1 uptrend gives the structural edge to buyers, while the M15 downtrend supplies immediate supply and failure points. The correct, experienced play is to wait — only engage after a clear breakout of the micro-trend and a confirming retest around the decision area (~102k). Whether the trade becomes a buy or a sell, follow the break → retest → confirm discipline, manage risk tightly, and let price prove the direction before enlarging exposure.
GOODLUCK GUYS!!!

BitcoinBTCUSD
- Exp Fiat as an corrective pattern in Long Time Frame
- Break of Structure
- Demand Zone
- Buy Side Liquidity
- Order Block

LONG ON BTC/USD (BITCOIN)Bitcoin has given us a retracement to the demand zone it created after it gave a change of character from down to up.
I expect bitcoin to rise to fill imbalance to the upside for about 15k-20k points.

Bitcoin Rebound from Support Toward Key Resistance TargetsBitcoin is showing a potential rebound from the support zone near $103,200. Price may target the $104,800 (Target 1) and $105,400 (Target 2) resistance levels if bullish momentum continues. The Fair Value Gap (FVG) suggests possible upward movement after recent correction.

BTCUSDT.P : positionHello friends
Given the decline we had, the price has now made a good floor and is supported, but it is still early for confirmation. We must let the resistance break and form a higher ceiling for us.
Everything is clear and transparent. If you have any questions, ask.
Don't forget risk and capital management.
*Trade safely with us*

btc await breakout#BTCUSD stands between the third pattern rejection which still holds drops till 101800 to reverse back on buy. We buy when breakout on M15-30 closure above 105541.
Breakout on M15-30 closure at 105541 buy, target 107300, SL 104511.
Below the rectangle 104500 holds strong bearish which will drop till 101800 to form new buy range.
