BITCOIN SIGNAL: HERE ARE THE NEXT BTC TARGETS!!!! (trap) Yello Paradisers! Enjoy the video!
And Paradisers! Keep in mind to trade only with a proper professional trading strategy. Wait for confirmations. Play with tactics. This is the only way you can be long-term profitable.
Remember, don’t trade without confirmations. Wait for them before creating a trade. Be disciplined, patient, and emotionally controlled. Only trade the highest probability setups with the greatest risk to reward ratio. This will ensure that you become a long-term profitable professional trader.
Don't be a gambler. Don't try to get rich quick. Make sure that your trading is professionally based on proper strategies and trade tactics.
BTCUSDC

BitcoinBTCUSD
- Completed " 1234 " Impulsive Waves
- Buy Side Liquidity
- Bearish Channel as an corrective pattern in Short Time Frame
- RSI - Divergence
- Order Block

Bitcoin BTC price analysis📊 US macro data has been updated — and CRYPTOCAP:BTC reacted with a bounce to the upside.
Altcoins, meanwhile, still look confused, as if they don’t know where to run yet 🤷♂️
😨 Fear & Greed Index: 11.
That’s extreme fear — and historically, such levels often mark zones where a gradual recovery can begin. Possibly even starting tomorrow.
📈 Overall, the OKX:BTCUSDT price action in 2025 looks very similar to #Bitcoin ’s behavior in 2021–2022.
We really want to believe we’re already in “Phase 2” of this fractal.
Because if this is still “Phase 1”, history suggests a scenario like:
➡️ first $103,000 BTC,
➡️ then potentially a deeper move toward $53,000.
🤔 What do you think — are we already transitioning into recovery, or is another painful leg still ahead?
______________
◆ Follow us ❤️ for daily crypto insights & updates!
🚀 Don’t miss out on important market moves
🧠 DYOR | This is not financial advice, just thinking out loud

BTC 4H Range Structure With Key Breakout Levels🔥 Welcome To FireHoseReel !
Let’s dive into Bitcoin (BTC) analysis.
👀 BTC 4H Overview
Bitcoin is currently trading inside a 4-hour range, with resistance at $93,663 and support at $84,563. A breakout from this box could trigger a major move. Keep in mind that December holiday conditions, especially Christmas, are keeping overall market volume relatively low.
📊 Volume Analysis
After breaking $88,082, Bitcoin’s volume shifted into strong selling pressure, printing a large 4H sell-off candle. A renewed volume expansion could lead to another significant move and potentially push price out of this range.
✍️ BTC Trading Scenarios
🟢 Long Scenario:
A breakout above $88,082 with rising buy volume could activate a low-risk long setup (~0.25% risk). If buying pressure expands into higher timeframes, the next resistance levels are $89,807, $93,663, and $96,412.
🔴 Short Scenario:
A breakdown below the current support near $84,563, confirmed by increasing sell volume, could provide a solid short opportunity.
🧠 Protect your capital first. No setup is worth blowing your account. If risk isn’t controlled, profit means nothing. Trade with rules, not emotions.
BTC / USD Long IdeaBTCUSDT – Bullish Continuation Setup
⚠️ Disclaimer
This is for educational purposes only and should not be considered financial advice.
Always apply proper risk management and confirm signals with your own analysis.

BTCUSD – Range-Bound Distribution | Liquidity-Driven Enviro🔍 Market Structure:-
HTF Range High / Sell-Side Resting Above:
94,500 – 95,200
HTF Range Low / Buy-Side Resting Below:
84,500 – 85,000
Mid-Range (Equilibrium):
~89,500 – 90,000 (current price area)
Price is currently hovering around equilibrium, which is typically low-probability for directional bias.
⚠️ Risk Disclaimer (TradingView-Friendly)
This analysis is for educational purposes only and does not constitute financial advice.
Market behavior is probabilistic and subject to change at any time.
Always apply proper risk management and use your own confirmation before executing trades.

#BTC/USDT is currently strongly bullish#BTC
The price is moving in a descending channel on the 1-hour timeframe. It has reached the lower boundary and is heading towards breaking above it, with a retest of the upper boundary expected.
We have a downtrend on the RSI indicator, which has reached near the lower boundary, and an upward rebound is expected.
There is a key support zone in green at 89300. The price has bounced from this level multiple times and is expected to bounce again.
We have a trend towards consolidation above the 100-period moving average, as we are moving close to it, which supports the upward movement.
Entry price: 90200
First target: 90600
Second target: 91256
Third target: 92000
Don't forget a simple principle: money management.
Place your stop-loss below the support zone in green.
For any questions, please leave a comment.
Thank you.

Breaking: Bitcoin Might Dip to $70k Support Point The price of Bitcoin is poised to dip to the $70k support to shake off weak hands before picking liquidity up albeit the market is generally bearish.
The $70k support is feasible or nearest support zone for bitcoin to consolidate before going back up. In similar context, as per data from crypto quant the open interest of Bitcoin on all exchanges is down 0.45% losing roughly $29 billion.
This data further solidifies our bearish thesis on $BTC.


BTCUSDT (4H) chart update !!BTC is holding above the rising trendline and trying to stabilize.
The 88,000–89,000 zone is acting as strong support, where previous bounces occurred.
As long as this support holds, upside targets remain 94,000 → 98,000 → 102,000.
A 4H close below 89K could open room for a pullback toward 85K–84K.
The overall structure remains bullish consolidation. 🚀
DYOR | NFA

BTC/USDT - The Calm Before the Storm - Breakout or Breakdown?Bitcoin is not simply moving sideways.
Price is currently compressed inside a critical technical structure, where buying and selling pressure is tightening aggressively. Historically, this type of compression often precedes a strong impulsive move.
After the sharp decline from the 126,000 area, BTC has entered a controlled consolidation phase within a falling wedge, while still trading below the major descending trendline. This is a decisive zone where the market chooses between reversal or continuation.
---
Current Market Structure
The higher-timeframe trend remains bearish, but selling pressure is weakening
Higher lows are forming, signaling early buyer participation
Volatility is shrinking → energy is being stored
Price is approaching the apex of the pattern, meaning a breakout decision is near
This is the market loading liquidity before the next major move.
---
Bullish Scenario — “Reversal Confirmation Zone”
If BTC:
Breaks and closes strongly above the descending trendline
Holds above 94,300
Shows expanding volume
Then:
The corrective phase is likely complete
Bearish structure starts to fail
A medium-term bullish reversal becomes highly probable
Upside targets:
99,000 → 103,000 → 107,000
A clean breakout could shift market sentiment from fear to confidence.
---
Bearish Scenario — “Continuation Trap”
If BTC:
Gets rejected again at the trendline
Loses the 90,300 support
Breaks down below the wedge structure
Then:
The consolidation becomes a bearish continuation pattern
Late buyers get trapped
The dominant downtrend resumes
Downside targets:
86,000 → 82,200 → potential retest of 80,500
---
Key Levels to Watch
94,300 – 99,000 → Breakout validation or fakeout zone
90,300 → Psychological mid-range support
86,000 – 82,200 → Final defensive demand zone
Price reaction at these levels matters more than any indicator.
---
Bitcoin is trading at a structural decision point.
This is not an area for FOMO — it is an area for confirmation.
➡️ Breakout = follow the trend
➡️ Breakdown = respect risk
Let price action do the talking.
---
#BTC #Bitcoin #BTCUSD #CryptoAnalysis #TechnicalAnalysis #PriceAction #FallingWedge #MarketStructure #CryptoTrading #SmartMoney

BITCOIN SIGNAL: ARE BEARS PREPARING TO CRASH BTC??????!!!Yello Paradisers! Enjoy the video!
And Paradisers! Keep in mind to trade only with a proper professional trading strategy. Wait for confirmations. Play with tactics. This is the only way you can be long-term profitable.
Remember, don’t trade without confirmations. Wait for them before creating a trade. Be disciplined, patient, and emotionally controlled. Only trade the highest probability setups with the greatest risk to reward ratio. This will ensure that you become a long-term profitable professional trader.
Don't be a gambler. Don't try to get rich quick. Make sure that your trading is professionally based on proper strategies and trade tactics.

BTC Trade Plan (December 12, 2025)BTC Trade Plan (December 12, 2025)
(D1 Neutral / H4 Buy dips / H1 Locally bullish / M15 Trend)
⬛️ 1. Higher Timeframe Context (D1 and H4)
• D1 bias: neutral
• D1 range (approx): 89,000 – 94,000
• Key D1 zones:
• Supply: 93,000-94,000 tested highs
• Demand: 89,000-91,000 supports
• H4 bias: buy dips
• H4 zones of interest:
• H4 Sell Zone 1: – supply cluster/rejection
• H4 Buy Zone 1: – demand area/gap fill potential
Active setups are trend-aligned relative to D1/H4.
⬛️ 2. Preferred Setups by Horizon
🔳 2.1 Swing Setup (D1/H4)
• Idea: trend-aligned long on dips (neutral structure support).
• Time horizon: multi-day.
• Context: stable macro, neutral derivatives.
🔲 2.2 Intraday Setup (H1 focus)
• Idea: buy dips toward supports.
• Time horizon: intraday.
• Context: H4 demand zones, local bullish.
▫️ 2.3 Scalp Setup (M15 focus)
• Idea: scalp minor trends upside.
• Time horizon: minutes–hours.
• Risk: higher-risk in expansion regime.
▪️ 2.4 Arbitrage/Pairs Concept (if relevant)
• Idea: BTC dominance high, neutral vs ETH/sector.
🟩 3.1 Long Setup (Trend-Aligned)
• Execution timeframe: H1
• Trigger timeframe: M15
• Entry zone:
• Context: H4 demand, LVN support.
• Pattern tags:
Trigger conditions:
• Liquidity sweep or SFP at/under key low, then reclaim (liquidity_sweep_reclaim).
• Evidence of liquidation_spike_reversal and absorption_at_level.
• ML-Predictive (15m): upside probability ≥ downside.
• On-chain and regulatory risk not at “extreme”.
🟥 3.2 Short Setup (Counter-Trend)
• Execution timeframe: H1
• Trigger timeframe: M15
• Entry zone:
• Context: H4 supply + put-biased skew.
• Pattern tags (from pattern_library):
Trigger conditions (non-exhaustive example):
• Price trades into the H4 sell zone and forms required pattern combination (e.g., double_sweep_high + vwap_rejection).
• Orderflow: evidence of absorption_at_level and delta_divergence_high.
• ML-Predictive (15m): downside probability ≥ upside.
• Event/Regulatory risk is not “extreme” and uncertainty is not “high”.
🔴 4. Stops (Invalidation Levels)
Long setups:
• Stop: 88,000.
• Logic: break of H4/H1 key low/demand invalidation; idea is wrong below this level.
Short setups:
• Stop: 95,000.
• Logic: break of H4/H1 structural high or OB invalidation; idea is wrong above this level.
🟢 5. Targets
Long:
• TP1: 93,000 – local HVN/VWAP or M15/H1 level.
• TP2: 94,000 – H4 supply/OB retest.
• TP3 (optional): 95,000 – extended D1 objective (HVN).
Short:
• TP1: 91,000 – intraday HVN or VWAP retest (H1).
• TP2: 89,000 – H4 demand / LVN void.
• TP3 (optional): lower – extended D1 objective (gap fill).
⬛️ 6. Position Sizing
• Baseline risk:
• Trend-aligned setups: typically 1.0 (relative unit).
• Counter-trend setups: ≤ 0.5 (relative unit).
• Adjust up/down using:
• high volatility_context, normal onchain_risk_profile.risk_level, normal sentiment_state.sentiment_risk, normal anomaly_state.manipulation_risk, overall_event_risk normal, uncertainty.level medium, trade_readiness.status ok_to_trade.
Final recommended relative risk per setup: 0.8 for trend long, 0.4 for counter-trend short.
⬛️ 7. Risk Flags
• Thin liquidity and high slippage risk
• Macro headwinds (DXY flat, NQ flat)
• Elevated regulatory risk (bank competition news)
⬛️ 8. Flip Conditions
• For long bias → bearish flip:
• Close below 89,000 with sell delta, failed demand.
• For short bias → bullish flip:
• H4 close above 94,000 with rising OI, positive delta, and acceptance above the OB cluster.
⬛️ 9. Alternative Scenario
Reject highs with range_high_rejection, short direction entry 93,000-94,000, stop 95,000, targets 89,000-88,000, differs as bear continuation vs base range grind.
⬛️ 10. Model Self-Critique
• Main assumptions: stable macro, neutral derivatives/on-chain.
• Main vulnerabilities: regulatory shifts, large whale flows.
• Behavioural risk notes: do not average into losers, do not increase leverage beyond a safe threshold.
⬛️ 11. Uncertainty and Constraints
• Uncertainty level: medium.
• Avoid high leverage, require strict pattern confirmation before entry, limit the number of trades.

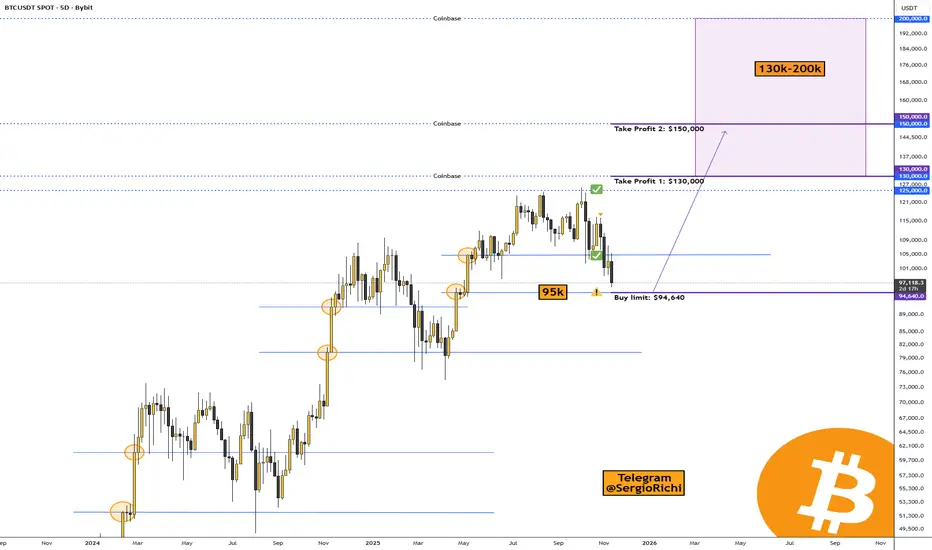
Bitcoin is approaching a key level at $94,640CRYPTOCAP:BTC #Bitcoin — Bitcoin is approaching a key level at $94,640.
The correction in the crypto market continues, and it's now starting in the US stock market.
Bitcoin is nearing an important level on the 5-day timeframe—specifically $94,640.
That's where market makers and big players have placed limit buy orders, and I think we'll see some major trader liquidations there too. For those who trade Bitcoin exclusively, I've marked a buy level.
• Buy limit: $94,640.
• Take Profit 1: $130,000
• Take Profit 2: $150,000
The range for wrapping up Bitcoin's cycle is pretty wide, since there are large orders set up there for taking profits. It's tough to pinpoint exactly where the price peak will be—we can only go by the data we can see.
• Coinbase: $130,000, $150,000, and possibly $200,000.
• Binance: $130,000, $150,000, and likewise, it's unlikely but possible to climb to $200,000.
Based on Elliott waves, we're finishing the 5th upward wave, and I figure the peak will hit in 2026, followed by a straight drop.
Indicator for Bitcoin miners:
The cycle indicator on Bitcoin shows the peak hasn't been reached yet:
Samuel Benner's Cycle and the 2026 Peak
The "200-year farmer chart," often referred to as Samuel Benner's Cycle Chart, is a historical economic forecasting tool created in 1875 by Ohio farmer and self-taught economist Samuel Benner.
It's credited with a "90% success rate" in broad sentiment prediction, and modern applications extend to stocks, crypto, and even solar cycles correlating with recessions.
It's best used as a sentiment gauge, not a precise timer.
Implications for 2026
The chart marks 2026 as a "B" year—a cycle peak in "Good Times," signaling high prices and a time to sell before transitioning to panic and hard times from 2026-2032.
This suggests a potential bull run peak, followed by downturn risks amid global debt, inflation, and geopolitics. As of late 2025, we're in a growth phase approaching this apex, per the model's extensions.
Dear friends, it looks like 2026 will mark the end of the growth cycle for Bitcoin and altcoins, so we'll need to find exit points, bail out of the crypto market, stock up on supplies for 3-5 years, and get busy building bunkers 😀🔥.
BITCOIN SIGNAL: FOMC MEETING WILL PUSH BTC TO HERE!!!? (warning)Yello Paradisers! Enjoy the video!
We are discussing a lot of technical stuff—Elliott Wave theory. We are going through multiple time frames, and I'm updating you about the price action, development structure, and important levels, as well as what the highest probability next move is.
And Paradisers! Keep in mind to trade only with a proper professional trading strategy. Wait for confirmations. Play with tactics. This is the only way you can be long-term profitable.
Remember, don’t trade without confirmations. Wait for them before creating a trade. Be disciplined, patient, and emotionally controlled. Only trade the highest probability setups with the greatest risk to reward ratio. This will ensure that you become a long-term profitable professional trader.
Don't be a gambler. Don't try to get rich quick. Make sure that your trading is professionally based on proper strategies and trade tactics.

btc live tradeHello friends
Given the sharp upward movement we had, you can see that the sellers have made a high, which increases the possibility of a price correction, and we can witness a price increase in the price correction until the specified targets are reached.
This analysis is purely from a technical perspective and is not a buy or sell recommendation, so please observe risk and capital management.
*Trade safely with us*

#BTC/USDT is currently strongly bullish#BTC
The price is moving in a descending channel on the 1-hour timeframe. It has reached the lower boundary and is heading towards a breakout, with a retest of the upper boundary expected.
We are seeing a bearish trend in the Relative Strength Index (RSI), which has reached near the lower boundary, and an upward bounce is expected.
There is a key support zone in green at 88200, and the price has bounced from this level several times. Another bounce is expected.
We are seeing a trend towards stabilizing above the 100-period moving average, which we are approaching, supporting the upward trend.
Entry Price: 88900
First Target: 90000
Second Target: 91123
Third Target: 92300
Remember a simple principle: Money Management.
Place your stop-loss order below the green support zone.
For any questions, please leave a comment.
Thank you.

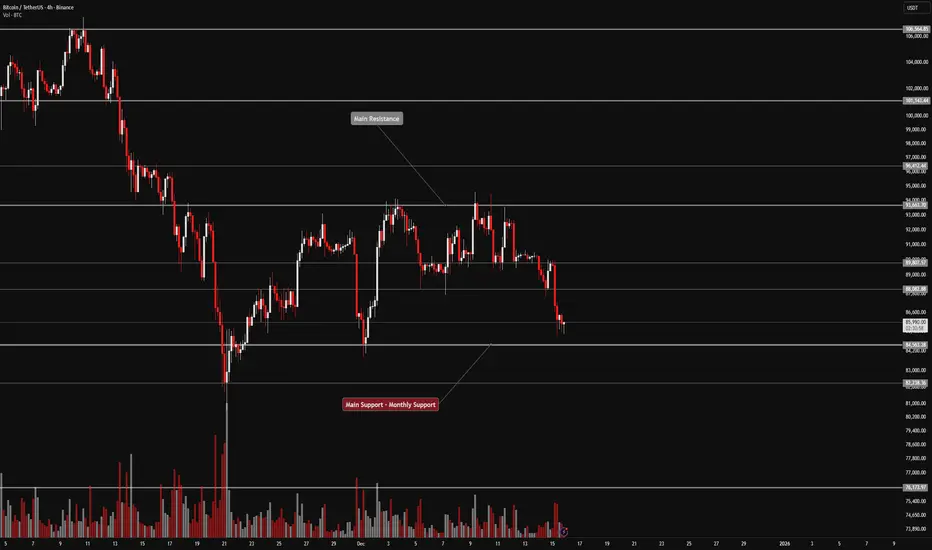
BTC/USD) Bearish trend analysis Read The captionSMC Trading point update
Technical analysis of Bitcoin (BTC/USDT), showing likely support/resistance zones + moving averages + a projected downside “target.” I think the analysis has merit — but it also carries risks. Here’s a breakdown of what works & what to watch out for:
---
What the analysis does well (strengths)
Use of support and resistance zones: The chart marks a “key support zone / breakout level” and a “resistance level.” That’s textbook technical analysis — horizontal zones where price has previously stalled or reversed tend to work as future decision points.
Dynamic resistance via moving averages: The chart uses EMAs (50 and 200) — those help traders spot trend direction and possible dynamic resistance/support. When price is below a major EMA (like the 200), that EMA often acts as resistance rather than support.
Clear target defined: Having a target around ~$83,783 (as drawn) gives a concrete downside level if the bearish case plays out. This is useful for planning scenarios and risk management.
Logical structure: support → breakdown → target: The idea seems to be that price broke a support zone (or tested and failed), is now below important moving averages — which supports the bearish bias. If support fails, move down toward target. That’s a valid “trend + structure” bearish setup.
---
What to be cautious about (weaknesses / risks / what’s uncertain)
Support/resistance zones are not guarantees: As described in guides for support/resistance — these zones work because many traders place orders there, but price can ignore them, especially under high volatility or news triggers.
EMAs as dynamic resistance/support are probabilistic: While 50-EMA or 200-EMA often act as resistance/support, they are not always respected — especially in volatile crypto markets.
Timeframe & context matter: The chart seems 1-hour, which means the zones and signals are relatively short-term. Levels that look robust on a 1-h chart may dissolve quickly when broader contexts (daily/weekly) shift. Many TA educators stress using multiple timeframes to confirm strong levels.
No certainty of target — market structure can change: The “target point” assumes continuation of bearish momentum. But if price action reverses, or some bullish catalyst emerges, the setup becomes invalid. This is true for any technical projection.
---
What this setup implies — possible scenarios
Bearish scenario (the chart’s base case): Since price is below both EMAs and has recently broken support, BTC could drift toward the projected target around $83,000–$84,000 if downward pressure continues, especially if sellers dominate near EMAs/resistance zones.
Invalidation / bull scenario: If BTC climbs back above the 50 and 200 EMAs, or reclaims a broken support zone, that bearish thesis fails — and price may instead bounce back toward higher resistance. In that case, the target becomes irrelevant.
Choppy / range-bound scenario: Price may hover between the support/resistance / EMA zones, bouncing up/down without reaching the target — which is common in crypto when there’s no strong directional catalyst.
Mr SMC Trading point
---
My view: Reasonable as a probabilistic bearish trade — but not a guarantee
Your chart offers a plausible bearish setup. It makes sense to watch how price interacts with the EMAs and the support/resistance zones. However: because markets are never deterministic, it’s best to treat this as one possible scenario, not a sure bet.
If I were trading this, I’d probably:
Wait for confirmation (e.g. a breakdown + close below support, or rejection at EMA) before committing.
Define risk controls: like where to set a stop-loss (maybe just above the 200-EMA or above recent consolidation), and a realistic profit target as indicated.
Monitor for catalysts (volume spikes, news) — these can up-end technical setups quickly in crypto.
---
Please support boost 🚀 this analysis

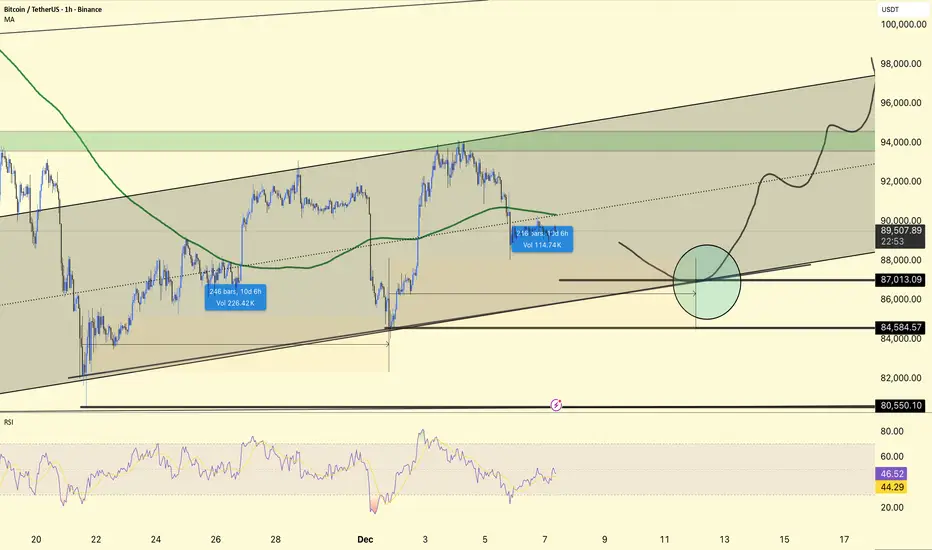
#BTC 4HOUR CHART UOPDATE !!BTCUSDT is still trading within an ascending channel, now pulling back towards the mid-lower portion of the structure after failing to sustain above 90k on the latest push.
The price has rolled over from the upper half of the channel and is heading towards the main confluence zone around 87,000–88,000, where the lower channel line, previous horizontal support, and your marked circle align.
84,584 and 80,550 remain the next downside reference supports; holding above 87k maintains the short-term bullish channel, while a break below 84,584 would increase the risk of a deeper correction towards 80k.
A decline into the 87k area, followed by basing and a continuation back towards 92k–94k, and if buyers defend the channel as drawn, possibly to the 96k–98k channel top.
The RSI is mid-range rather than overbought, so there is room for another leg down or a sharp bounce to test support; using 87k–84.5k as the main invalidation band for aggressive longs fits within the current 4H structure.
DYOR | NFA,
#BTC/USDT is currently strongly bullish#BTC
The price is moving in a descending channel on the 1-hour timeframe. It has reached the lower boundary and is heading towards breaking above it, with a retest of the upper boundary expected.
We have a downtrend on the RSI indicator, which has reached near the lower boundary, and an upward rebound is expected.
There is a key support zone in green at 92500. The price has bounced from this level multiple times and is expected to bounce again.
We have a trend towards consolidation above the 100-period moving average, as we are moving close to it, which supports the upward movement.
Entry price: 92990
First target: 93204
Second target: 93750
Third target: 94406
Don't forget a simple principle: money management.
Place your stop-loss below the support zone in green.
For any questions, please leave a comment.
Thank you.

BITCOIN SIGNAL: ONE MORE DUMP BEFORE PUMP??? (warning)Yello Paradisers! Enjoy the video!
And Paradisers! Keep in mind to trade only with a proper professional trading strategy. Wait for confirmations. Play with tactics. This is the only way you can be long-term profitable.
Remember, don’t trade without confirmations. Wait for them before creating a trade. Be disciplined, patient, and emotionally controlled. Only trade the highest probability setups with the greatest risk to reward ratio. This will ensure that you become a long-term profitable professional trader.
Don't be a gambler. Don't try to get rich quick. Make sure that your trading is professionally based on proper strategies and trade tactics.

BTCUSDTWe have a big downtrend.
By breakout from support and resistance we will have continued trend to next target.
Breakout 82k ready to 70k.
Breakout 93k ready to 100k and 115k.
CRYPTOCAP:BTC BITSTAMP:BTCUSD BINANCE:BTCUSDT

#BTC/USDT is currently strongly bullish#BTC
The price is moving in a descending channel on the 1-hour timeframe. It has reached the lower boundary and is heading towards breaking above it, with a retest of the upper boundary expected.
We have a downtrend on the RSI indicator, which has reached near the lower boundary, and an upward rebound is expected.
There is a key support zone in green at 85249. The price has bounced from this zone multiple times and is expected to bounce again.
We have a trend towards stability above the 100-period moving average, as we are moving close to it, which supports the upward movement.
Entry price: 86624
First target: 87386
Second target: 88635
Third target: 90106
Don't forget a simple principle: money management.
Place your stop-loss below the support zone in green.
For any questions, please leave a comment.
Thank you.
