BTCUSD: Holding Wave X or Slipping Lower?24 Nov 2025
27 Nov 2025
1 Dec 2025
17 Dec 2025
Bitcoin is still trading inside a falling channel, and the overall structure remains corrective. The recent bounce from lower levels lacks momentum and is overlapping, which signals consolidation rather than a trend reversal. Price continues to respect channel resistance, keeping the broader bias weak.
Wave X is acting as an important support zone around 83,822 , and as long as price holds above this level, further consolidation remains possible. This area is currently absorbing selling pressure and preventing immediate continuation to the downside.
However, a decisive breakdown below Wave X would signal that the correction is not complete. In that scenario, downside momentum is likely to expand, opening the path toward the 79,650 - 75,655 zone.
Stay Tuned
@Money_Dictators
RD :)
Btcusdshort

BTCUSD Rebound & ConsolidationToday, BTCUSD is experiencing a narrow-range consolidation following a oversold rebound. Despite bouncing roughly 3% from its overnight low, the bearish structure on the daily timeframe remains intact. Market sentiment stays cautious, and the short-term trend will still hinge on the defense of key price levels and upcoming macroeconomic data releases.
The November U.S. nonfarm payroll data delivered a strong headline but weak internals outcome. It neither altered market expectations for the Federal Reserve’s monetary policy nor provided clear unilateral guidance. Meanwhile, year-end institutional settlements have triggered liquidity tightening, coupled with a slowdown in stablecoin growth, which has weighed on Bitcoin’s short-term risk appetite. Additionally, expectations surrounding the Bank of Japan’s interest rate hike remain uncertain—an unexpected 50-basis-point rate hike could spark a fresh round of correction in Bitcoin prices.
On the support front, the $85,000–$86,000 zone serves as the core support range. This level not only marks the early November low but also encompasses the average cost basis of U.S. spot Bitcoin ETFs. Approximately 400,000 BTC were purchased within this range, making it a robust structural support for the year. A breakdown below this zone would open the door to a further decline toward $80,000–$82,000.
For resistance, the initial hurdle lies at $88,000–$88,500 (yesterday’s rebound peak), with further resistance at $89,700–$90,500. A decisive breakout above this upper resistance band would pave the way for a potential rally toward $94,000.
In summary, BTCUSD is likely to trade within the $85,000–$94,000 range in the short term. Going forward, focus should be placed on the U.S. inflation data and remarks from Federal Reserve officials scheduled for Thursday. Ahead of the release of these key data points and policy signals, the market will most likely adopt a wait-and-see stance, with prices lacking a clear directional bias.
Trading Strategy:
Buy 86000 - 86500
SL 85500
TP 87500 - 88000
Sell 88000 - 88500
SL 89000
TP 86000 - 85500

BTCUSD:Bearish Bias with ConsolidationToday, BTCUSD is in a downtrend - dominated consolidation pattern, trading sideways after failing to hold gains above 89000 and dropping to test the 85000 key support zone. The price dipped to a low of 85055 in the early session then rebounded, with upside momentum curbed by persistent selling pressure and weak risk appetite. Key drivers include EMA50 dynamic resistance, RSI still in a weak range, and institutional caution (ETF outflows), pushing the market into a technical defensive phase where 85000 acts as the bull’s critical short - term lifeline.
Core Price Zones:
Resistance:88500 - 89000 (intraday first resistance), 90000 (psychological + trend - line resistance), 92000-94000 (mid - term target)
Support:85000 - 85500 (Fibonacci 0.786 retracement + dense trading zone), 84000 (intraday low), 80000-82000 (major support cluster)
Trading Strategy:
Buy 85000 - 85500
SL 84300
TP 86500 - 87500 - 88500
Sell 88500 - 89000
SL 89700
TP 87000 - 86000 - 85000

BTCUSD: weak oscillating patternToday, BTCUSD has extended its correction trend that started in October, exhibiting a weak oscillating pattern. Prices have been range-bound around the core zone of $85,000–$86,000. Following the flash crash after the price challenged the $90,000 level, the pair is now lingering near the critical support at $85,000, with bears firmly in control of the market.
Support Levels:
$85,000 serves as the current core lifeline. This level corresponds to the 0.786 Fibonacci retracement of the uptrend that began in April. A daily close below this threshold will most likely trigger a new round of panic selling, opening the door to the next support zone of $78,000–$80,000. In the short term, a weak support has formed around $86,000, though its effectiveness has already been undermined. From the perspective of the daily EMA indicator, $85,000 also coincides with the EMA 400 level, further underscoring its significance as a support level.
Resistance Levels:
For any short-term rebound, the primary resistance zone lies at $87,000–$88,000, with $87,200 and $87,500 as key intraday resistance points. Stronger resistance is concentrated at $91,000 (the midpoint of the previous consolidation phase) and $94,700. Additionally, the descending trend line from the October high has formed a robust resistance barrier. Without the support of large-scale spot buying, it will be difficult for any rebound to break through these levels.
Trading Strategy:
Sell 86500–87000
SL 87500
TP 85000 - 84000 - 83000
Buy 85000 - 85200
SL 84500
TP 86000 - 86500 - 87000

BTC Trade Set Up Dec 16 2025I am expecting a continuation of the bearish trend especially if price respects this 4h FVG. The target is demand and lower SSL

Bitcoin - The classic bullrun top creation!🗿Bitcoin ( CRYPTO:BTCUSD ) created the bullrun top:
🔎Analysis summary:
A couple of weeks ago, Bitcoin retested a major decade long resistance curve. Since Bitcoin then already created bearish confirmation, we are currently seeing an expected crackdown. Considering all the underlying trends, this bearish cycle is still not over yet.
📝Levels to watch:
$70,000 and $50,000
SwingTraderPhil
SwingTrading.Simplified. | Investing.Simplified. | #LONGTERMVISION

BTC Trade Set Up Dec 15 2025Price pushed down to SSL over the weekend has been engulfed back to the upside. Now price is trading in between a bullish and bearish 4h FVGs so i will want to see a push through either one of them to confirm either a continuation lower to demand and SSL or a reversal higher to BSL

BTCUSD’s Weak ReboundToday, the BTCUSD pair exhibited a volatile and weak trend characterized by a decline followed by a pullback. After a sharp drop in the early trading session, it staged a slight rebound but still failed to break free from the recent downward trend overall. Bulls and bears engaged in fierce rivalry around key price levels, which was driven by multiple factors including expectations for macroeconomic policies, institutional attitudes and market sentiment.
Resistance Levels
The key short - term resistance stands at $90,400, a level that corresponds to the CME futures gap formed over the weekend. It exerts a strong magnetic pull on the price and serves as a crucial juncture determining whether the rebound can gain further momentum. The $90,500 level, where multiple moving averages converge on the 4 - hour chart, also acts as a resistance level. If this level can be breached, the pair will subsequently face a strong resistance zone between $92,000 and $94,000. Only a volume - backed breakout of this zone will enable Bitcoin to be expected to regain upward momentum.
Support Levels
The current core support zone ranges from $88,000 to $89,000. If this zone is lost, the price may further decline to the key Fibonacci Retracement level of $85,569, or even lower regions, and the subsequent trend will weaken further.
Trading Strategy:
Sell 91500 - 92000
SL 92500
TP 90000 -89000- 88000
Buy 88000 - 89000
SL 875000
TP 91000 - 91500 - 92000

BTCUSD in Risk-Off Mode | Diversify & Scalp SmartBTCUSD Risk-Off Consolidation – Eyes on 70K Risk, Scalping to 100K
Bitcoin’s stuck in a risk-off rut, consolidating near 90,000–95,000 as global markets turn cautious. It’s not dumping yet, but a sell-off to 70,000 looms if sentiment worsens. Here’s my approach to navigate this:
Setup:
Current State: BTCUSD’s holding low, reflecting risk-off flows (flat 20-day EMA, RSI ~40). Volume profile shows weak support until 70,000.
Risk Warning: A break below 90,000 could trigger a slide to 70,000, a key demand zone with historical buying.
Strategy:
Scalping Start: Enter small-position scalps (0.01–0.02 lots) on intraday bounces (e.g., 4H bullish pin bars above 90,000), then manage into longer-term positions if momentum builds.
Diversification: Mitigate risk by trading other pairs (e.g., XAUUSD, EURUSD) with calculated entries. Use available margin and prop firm leverage (e.g., FTMO’s 1:100) wisely, keeping total risk at 10% max.
Position Management: Scale in cautiously, trailing stops to lock in profits. My long-term target is 100,000, but hope isn’t a strategy—small positions keep me flexible.
Market Context:
Risk-off sentiment (e.g., equity sell-offs, USD strength post-Fed) is capping Bitcoin’s upside. Recent highs near 103,000 (November 2025) faded fast, and low volume suggests hesitation. A 70,000 test is possible if macro fears grow, but 100,000 remains viable if safe-haven flows return. Volatility’s moderate (3–5% daily), ideal for scalping with tight risk.
Risk Warning: Don’t put all eggs in one basket. BTC’s downside risk demands diversification and strict risk management (10% max, per FTMO rules). Trade calculated, not emotional!
What’s your BTCUSD play?
Share your setups or risk-off strategies below!
#BTCUSD #Bitcoin #RiskOff #Scalping #RiskManagement

Bitcoin (BTC/USD) Daily Chart: Downtrend Pressure with Early Sta
Trend: BTC is still trading below a clear descending trendline, confirming a broader bearish structure since the mid-year highs. Lower highs and lower lows remain intact.
Price Action: Current price is around $90,160, consolidating after a sharp sell-off in November. This looks like a pause or base-building phase, not yet a confirmed reversal.
RSI (≈44): RSI is below 50, indicating weak momentum, but it has stabilized above oversold territory. This suggests selling pressure is easing, though bulls are not in control yet.
MACD: MACD remains below the signal line, but histogram contraction hints at bearish momentum slowing. A bullish crossover would be an early reversal signal.
Momentum/Volume Indicator: Negative values persist, showing dominant bearish momentum, but the flattening bars imply reduced downside strength.
Key Levels:
Resistance: $95,000–$100,000 (trendline + prior support)
Support: $85,000, then $78,000
Outlook:
BTC is in a bearish-to-neutral transition zone. A daily close above the descending trendline with RSI reclaiming 50 would favor a trend reversal. Failure to hold $85,000 increases the risk of another leg down toward $78,000.

BTCUSD 15-Minute Chart – Symmetrical Triangle Consolidation withAnalysis:
Market Structure: After a sharp bearish impulse (strong sell-off), BTC entered a consolidation phase, forming a symmetrical triangle. This indicates balance between buyers and sellers after high volatility.
Trend Context: The impulse move before the triangle was downward, but price has stabilized and volatility is compressing — often a precursor to a strong breakout.
Pattern Details:
Lower highs and higher lows are clearly converging.
Price is currently near the apex, where breakout probability increases.
Bias:
The drawn plan suggests a bullish breakout scenario.
Entry is placed slightly above triangle resistance to avoid false breakouts.
Trade Plan (as illustrated):
Entry: On confirmed breakout above the triangle resistance
Target: Measured move projection upward (roughly equal to the triangle’s height)
Stop Loss (SL): Below triangle support to invalidate the setup
Risk–Reward:
Favorable R:R, as the stop is tight relative to the projected upside.
Confirmation to Watch:
Strong bullish candle close above resistance
Increase in volume on breakout
Failure signal if price breaks down instead and closes below support
Conclusion:
BTCUSD is coiling inside a symmetrical triangle after a high-momentum drop. The setup favors a volatility expansion trade, with a bullish breakout being the planned direction — but confirmation is essential. A downside breakout would invalidate the bullish bias and shift momentum back to sellers.

Bitcoin - This cycle is totally clear!🚨Bitcoin ( CRYPTO:BTCUSD ) enters the next bearmarket:
🔎Analysis summary:
Bitcoin always creates textbook cycles. And after every retest of the major resistance curve, Bitcoin started a major bearmarket. Since we already witnessed bearish confirmation, Bitcoin is heading for a new correction. Just let it play out.
📝Levels to watch:
$60,000
SwingTraderPhil
SwingTrading.Simplified. | Investing.Simplified. | #LONGTERMVISION

BTCUSD Analysis - Major Supply Zone + Reversal1. Higher-Timeframe Context
BTC is currently trading inside a broad consolidation range after a strong impulsive leg to the upside followed by an equally sharp corrective decline. The market has created clear liquidity pockets both at the top and bottom of the range, suggesting price is hunting for inefficiencies rather than trending cleanly.
The current structure shows that BTC is in the middle of a retracement phase after rejecting the lower boundary of the range.
2. Impulse Move & Liquidity Grab
A significant vertical bullish impulse can be seen near the left side of the chart, creating a sharp displacement candle. This move broke short-term structure and left behind a clean imbalance.
After the rally, price failed to maintain directional continuation and rotated back lower, indicating the move acted more like a liquidity sweep rather than genuine trend continuation.
This is important because markets typically return to revisit these inefficient zones before deciding the next major direction.
3. Reversal Zone (Key Supply Area)
The highlighted green zone represents a high-probability supply area where:
Volume Burst: Indicates aggressive buy-side activity that may have come from late buyers or trapped longs.
Reversal Zone: This is the last major bearish origin block that caused the breakdown. Price re-entering this area signals a likely reaction.
A reaction here is expected because this zone contains both:
Unmitigated supply
Liquidity engineered above recent swing highs
This combination often creates a magnet for price and a turning point afterward.
4. Expected Price Behavior
Price is currently climbing back toward the Reversal Zone.
The chart suggests two possible scenarios:
Scenario A – Pattern Confirmation Before Short
Price taps the reversal zone, forms a bearish confirmation pattern (e.g., bearish engulfing, 2-candle reversal, break of intraday low), and begins trending downward.
This aligns with the diagram arrows showing rejection and continuation down.
Scenario B – Liquidity Grab Then Rejection
Price may wick slightly above the zone to collect liquidity, then sharply drop.
This is common behavior in areas with heavy wick rejections on history.
A clear message noted on the chart: “Need Pattern Here” – meaning that entries should only be attempted once the market shows clear reversal structure, not by blindly shorting the zone.
5. Short-Term Targets if Rejection Happens
If rejection confirms, potential downside targets include:
Return to mid-range
Retest of intraday support around recent consolidation
Lows near 90,800–91,200
Possible extension toward the range bottom if momentum increases
These levels are visible on the chart where previous structural lows were formed.
6. Market Psychology at This Zone
This area is important because:
Buyers who bought late in the impulse are trapped
Short sellers are waiting for optimal entries
Liquidity accumulates above swing highs
Institutions often push price into such zones to fill large orders
This creates a high-probability reversal environment, but confirmation is essential.

BitcoinBTCUSD
- Bearish Channel as an corrective pattern in Long Time Frame
- Fair Value Gap
- Completed " 123 " Impulsive Waves
- Fibonacci Level - 38.20% / 50.00%
- Bullish Channel in Short Time Frame

Bitcoin at a Crossroads!Downtrend overall
The general trajectory has been lower — lower highs and lower lows over the past several weeks.
🔹 Possible consolidation / base forming
Price has leveled out a bit instead of accelerating down; that can sometimes mean sellers are losing momentum and the market is consolidating.
🔹 Uncertain direction short-term
Because it’s range-bound right now, there isn’t a clear breakout direction yet. Bulls vs bears are in a tug-of-war around this level.
Key Levels to Watch
📌 Support zone: ~~$84,000–$87,000
📌 Resistance zone: ~~$92,000–$96,000
Break above or below those could signal the next big move.

BTC Isn’t Bottoming — It’s Bargaining: Why 75k Still Makes SenseAs I mentioned in my previous analysis, the idea that “BTC has bottomed” simply doesn’t convince me.
And let’s be honest: when a true bottom forms, you won’t see every account on social media announcing it. Markets don’t work that way — especially crypto, where optimism is often weaponized.
From a structural perspective, the entire rise from the 80k zone looks like a textbook corrective move. Yes, we had a perfectly normal rebound into the 94k area, but everything that followed has been classic corrective behavior:
- Mostly ranging price action
- Repeated spikes into 95k that were quickly sold
- Clear overlapping structure
- A bearish flag, which statistically favors continuation lower
If we also consider the four-month distribution phase between 110k–120k, it becomes even harder to justify a bullish reversal narrative. Distribution of that scale rarely resolves into instant trend reversals — instead, it usually marks the beginning of a deeper cycle shift.
So from a psychological standpoint, the crowd is still bargaining — trying to convince themselves the trend is intact, even though the structure keeps printing lower-probability bullish outcomes. That cognitive dissonance is exactly what fuels bear markets.
My view remains unchanged: 75k remains the primary downside target.
And for me, nothing changes unless BTC manages to stabilize above 100k — not just wicks above, but hold with clear buying interest.
Until that happens, selling rallies is the only rational play.

BITCOIN SELLING CONFIRM📉 Sell Trade Summary
Pair: BTC/USDT
Direction: Sell (Short)
Reason: Price swept the Buy-Side Liquidity Range, rejected from supply, and broke structure bearish.
Entry: Retest of the supply zone around $93.2K–$93.4K
Stop-Loss: Above liquidity sweep at $94.6K
Take-Profit: Demand zone at $89.5K–$90K
R:R: Approximately 1:3+
Bias: Bearish continuation toward lower demand.

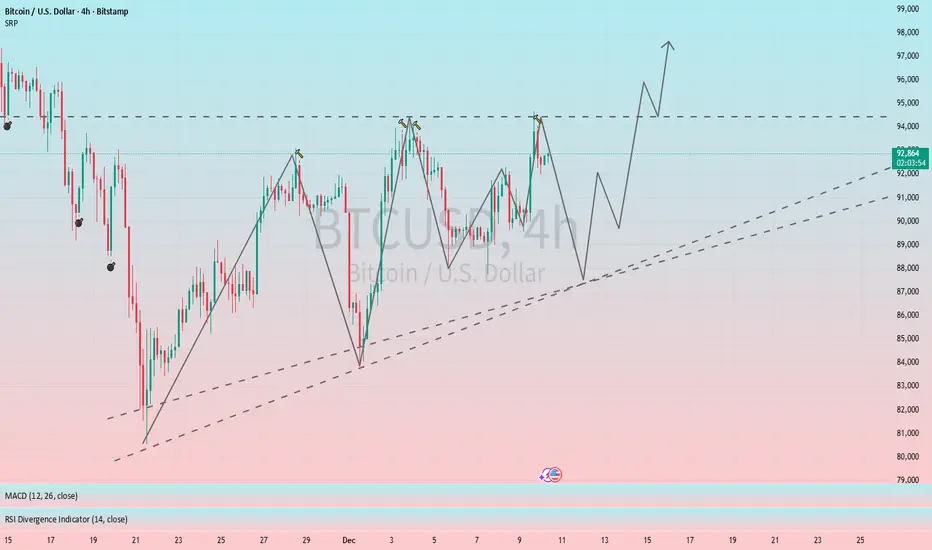
Ascending triangle formation indicates a bullish outlook for BTC#BTCUSD BITSTAMP:BTCUSD BINANCE:BTCUSDT
From the 4H chart, BTC's short-term trend has formed an ascending triangle pattern, which is a typical bullish pattern. Short-term resistance is located at 93500-94500, a break above this level would likely lead to further gains. The key support level to watch is 88000-87500. If the price retraces to this range, we can consider going long on BTC.
BTCUSD Stabilizes Near 92,000 – Key Entry Zones & TargetsBitcoin prices kicked off a sharp unilateral rally from around 90,000 yesterday. The upward momentum was extremely strong, as prices not only broke through the key 94,000 level smoothly but also hit a short-term high near 94,550. This move successfully broke the previous consolidation range of 88,000–91,000, setting a new price high in nearly three weeks and reflecting robust short-term bullish momentum.
However, facing heavy pressure from strong resistance near 95,000, prices subsequently entered a phase of sustained pullback. Hourly charts saw a string of consecutive bearish candles, with a marked retracement magnitude that drove prices gradually down to around 92,000. Today, BTCUSD trended with an oscillating pullback after breaking the key level, and it is currently stabilizing around the 92,000 mark without further sharp declines.
Resistance Levels:
The immediate strong resistance remains in the 94,000–94,550 range, which was the short-term high established in the early hours of today. For bulls to reignite an upward move in the near term, a breakout above this range is essential to unlock further upside potential. Further up, the 95,000 round-number level acts as a major psychological resistance, which exerted significant suppression and triggered the pullback during the previous rally.
Support Levels:
92,000 serves as the most immediate support level, which has already been tested during the morning pullback and is currently showing effective support. Below that, the core support band lies in the 91,000–91,500 range—a zone that was the upper edge of the previous consolidation platform and acts as a critical bullish defense line. If this support fails to hold, the next major support zone will be 88,000–90,000, which has withstood multiple market tests in the past and boasts relatively strong support strength.
Trading Strategy:
Buy 92000 - 92500
SL 91000
TP 94000 - 94500 - 95000
Sell 94000 - 94500
SL 95000
TP 92000 - 91000 - 90000

BTCUSD — Strong Supply Rejection & Bearish Continuation SetupBTCUSD is reacting strongly to the major supply zone, where sellers have stepped in multiple times, creating consistent price rejections. Each attempt to break above this level has failed, confirming that this zone is a high-pressure resistance area.
After the failed breakout, price formed a trapping area, indicating that smart money trapped late buyers before reversing the market. This is a classic sign of distribution, where buyers lose strength and sellers take control.
Additional bearish signals include:
Multiple wick rejections at resistance showing aggressive selling
Lower highs forming inside the range, signaling weakening bullish momentum
Break of internal structure, confirming sellers are gaining control
Absence of strong bullish volume, showing buyer exhaustion
Price now heading toward the nearest support and liquidity levels
With strong supply overhead and buyers losing momentum, market sentiment remains bearish, and BTCUSD is likely to continue drifting downward toward the demand zone area and the marked target level.
If this analysis helps you, hit like and drop your thoughts below!

BTC Trade Set Up Dec 9 2025Price remains bearish making LH on the 1h and has swept BSL with a strong engulfing candle forming so i am targeting SSl

Bitcoin Short Term Sell IdeaH4 - Strong bearish move.
No opposite signs.
Currently it looks like a pullback is happening.
Expecting bearish continuation until the two Fibonacci resistance zones hold.
If you enjoy this idea, don’t forget to LIKE 👍, FOLLOW ✅, SHARE 🙌, and COMMENT ✍! Drop your thoughts and charts below to keep the discussion going. Your support helps keep this content free and reach more people! 🚀
--------------------------------------------------------------------------------------------------------

Bitcoin - The bearmarket officially started!🪚Bitcoin ( CRYPTO:BTCUSD ) will still head lower:
🔎Analysis summary:
Taking a look at all previous cycles on Bitcoin, each cycle lasted for about 1,000 days. Together with the current retest of the major resistance curveline, the recent move lower was totally expected. And looking at clear market structure, this correction is not over yet.
📝Levels to watch:
$75,000 and $60,000
SwingTraderPhil
SwingTrading.Simplified. | Investing.Simplified. | #LONGTERMVISION
