BTCUSDT: Buyers Aim for Recovery Toward $115K ResistanceHello everyone, here is my breakdown of the current Bitcoin setup.
Market Analysis
Bitcoin (BTCUSDT) is showing a constructive bullish setup after rebounding from the 106,600–107,000 Support Zone. This area has consistently acted as a strong demand region, confirming buyers’ interest each time price tested the lower boundary of the Upward Channel. The market structure has remained bullish overall, characterized by a series of higher highs and higher lows since the correction phase in mid-October.After a recent fake breakout below the support line, buyers quickly regained control, pushing price back above the channel’s lower boundary. This rejection from support and recovery above 110,000 suggests renewed bullish momentum.
Currently, BTCUSDT is approaching the midline of the channel, while short-term resistance lies at 115,400 — a level that coincides with a previous fake breakout zone and horizontal supply area.
My Scenario & Strategy
As long as BTCUSDT holds above the 109,000–110,000 region, the bullish scenario remains valid. I expect the price to continue climbing toward the 113,000–115,400 Resistance Zone in the near term. A clean breakout above 115,400 could open the way for another bullish leg toward the upper boundary of the channel near 117,000–118,000.
However, a confirmed rejection from 115,400 could trigger a temporary pullback toward the support trendline before another potential push higher. In my view, Bitcoin remains in a healthy uptrend, and I prefer to look for long opportunities from dips above the support line, targeting 115,400 (TP1) and potentially 117,000 (TP2).
That's the setup I'm tracking. Thank you for your attention, and always manage your risk.
BTCUSDT

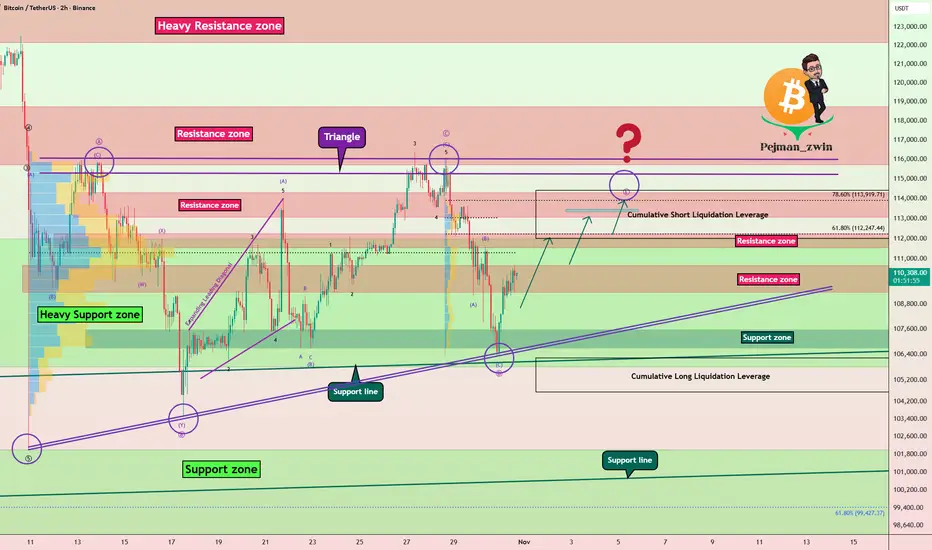
Bitcoin Correction Forming a Triangle – Which Way Next?Bitcoin ( BINANCE:BTCUSDT ), just as I expected in the previous idea , started to decline and reached its full target .
Over the past 20 days , Bitcoin has been moving in a ranging pattern that seems to be forming into a triangle shape .
From an Elliott Wave perspective , this corrective structure also appears to be a triangle , with its wave E potentially completing around the Resistance zone($114,300-$113,000) and the Cumulative Short Liquidation Leverage($114,424-$112,000) .
I expect that in the coming hours, Bitcoin can rise at least up to about $112,800 . If the upward momentum is strong enough , we might even see it reach the upper lines of the triangle .
Cumulative Long Liquidation Leverage: $106,231-$104,648
Please respect each other's ideas and express them politely if you agree or disagree.
Bitcoin Analysis (BTCUSDT), 2-hour time frame.
Be sure to follow the updated ideas.
Do not forget to put a Stop loss for your positions (For every position you want to open).
Please follow your strategy and updates; this is just my Idea, and I will gladly see your ideas in this post.
Please do not forget the ✅' like '✅ button 🙏😊 & Share it with your friends; thanks, and Trade safe.
TradeCityPro | Bitcoin Daily Analysis #208👋 Welcome to TradeCity Pro!
Let's take a look at Bitcoin's analysis — the market is still ranging.
⏱ 1-Hour Timeframe
In the 1-hour timeframe, Bitcoin is still below the 111365 level. Today, it moved close to this level once, but it is currently still trading below it.
⛏ Good buying volume has entered the market, while the volume of red candles has been decreasing. In case 111365 is broken, we can open a long position.
🧮 If the price gets rejected from this level, the first short trigger we have is 108844. The next support levels are 107486 and 106319.
📊 Overall, I still believe that as long as the price is between 106319 and 115808, the market movements are temporary and not very exciting. As long as the price stays in this zone, I will open short-term positions and take profit quickly.
❌ Disclaimer ❌
Trading futures is highly risky and dangerous. If you're not an expert, these triggers may not be suitable for you. You should first learn risk and capital management. You can also use the educational content from this channel.
Finally, these triggers reflect my personal opinions on price action, and the market may move completely against this analysis. So, do your own research before opening any position.

Bitcoin Consolidates Within Symmetrical TriangleHi guys!
The chart illustrates a symmetrical triangle formation. This pattern typically signals a potential breakout scenario, though the direction must be confirmed by price action.
Key Technical Levels
Resistance Zone: Around $111,000 – $113,000, aligned with the top line of the symmetrical triangle.
Major Support: Defined by the bottom line of the triangle, currently holding near $107,000 – $108,000.
Breakout Target: Upon a confirmed breakout to the upside, the projected target for the triangle stands near $122,587, which aligns with a measured move from the pattern’s height.
Trading Plan
Bullish Scenario:
A breakout and close above the resistance zone ($111,500) would confirm bullish momentum. In this case, a long position could be considered, with the target around $122,500 as marked on the chart. This would also indicate renewed market strength and continuation toward higher levels.
Bearish Scenario:
If the price fails to break above the resistance and instead faces rejection, traders are advised to focus on short positions, anticipating a potential retracement toward the lower boundary of the triangle or even a breakdown below it. A close below the bottom trendline could signal deeper downside continuation.
Conclusion
Bitcoin is currently consolidating within a symmetrical triangle, reflecting indecision in the market. A confirmed breakout above resistance could trigger a bullish run toward $122,500, while rejection at this level would favor short setups. Traders should monitor the breakout area closely and wait for volume confirmation before committing to a position.

BTC Analysis — Support or Trap? The 106–107k Zone Under PressureIn my previous BTC analysis — right before the flash crash — I mentioned that I was struggling to maintain my bullish stance, and that only a break back above 118k would restore confidence. In fact, I leaned toward a bearish bias, and the recent price action has confirmed those concerns.
The market has repeatedly failed to reclaim the 118k zone, continuing to drift lower toward 106–107k support.
As I’ve explained multiple times, when I see this kind of movement — price coming back to the same support again and again — it’s hard to believe that the market is doing it so we can all buy and profit.
Usually, this pattern acts as a trap, luring in buyers before a final breakdown.
That’s the scenario I’m watching once again.
Technical Levels:
- Resistance: 118k (major cap)
- Support: 106–107k (key zone)
- Interim level: 100k (psychological)
- Target on breakdown: 90k
My selling zone is between 113–115k, as I expect any bounce into this area to meet renewed selling pressure.

Bitcoin Losing Steam – Is the $100,000 Zone Calling?Hello everyone, BTCUSDT is currently trading around $109,600, still facing strong pressure from the medium-term descending trendline . After three failed attempts to break above the $112,000 resistance, selling momentum is gradually taking control.
On the macro side, although the Fed cut rates by 0.25% , Chair Powell’s cautious remarks suggest the central bank isn’t ready for an aggressive easing cycle. This “hawkish rate cut” keeps the USD strong and weakens risk appetite — an unfavorable setup for Bitcoin in the short term.
Adding to the pressure, October — typically known as “Uptober” — closed with a sharp red candle , signaling widespread pessimism. Meanwhile, Spot Bitcoin ETFs continued to record hundreds of millions of dollars in outflows , showing that institutional investors remain on the sidelines.
From a technical perspective, the lower-high structure is clearly visible, with EMA34 and EMA89 sitting above the price, reinforcing the bearish bias. If the $105,000 support fails to hold, the next key target lies near $100,000, a level that has historically attracted strong buying interest.
Combining both fundamentals and technicals, BTCUSDT appears to be in a short-term corrective phase , and the likelihood of a retest of the $100,000 zone in the near future remains quite high.

No Rise in Sight — the Drop’s Still RightAs I mentioned before, I expect Bitcoin to decline toward 104K, and now the signs of this move are forming.
The invalidation zone is marked on the chart (and may be shifted closer to 110,445).
After reaching 104K, a sharp but limited rebound is possible, but I don’t expect a trend reversal at this stage.
⚠️ This is not financial advice or a trade signal. Please manage your risks and follow your own money management system.

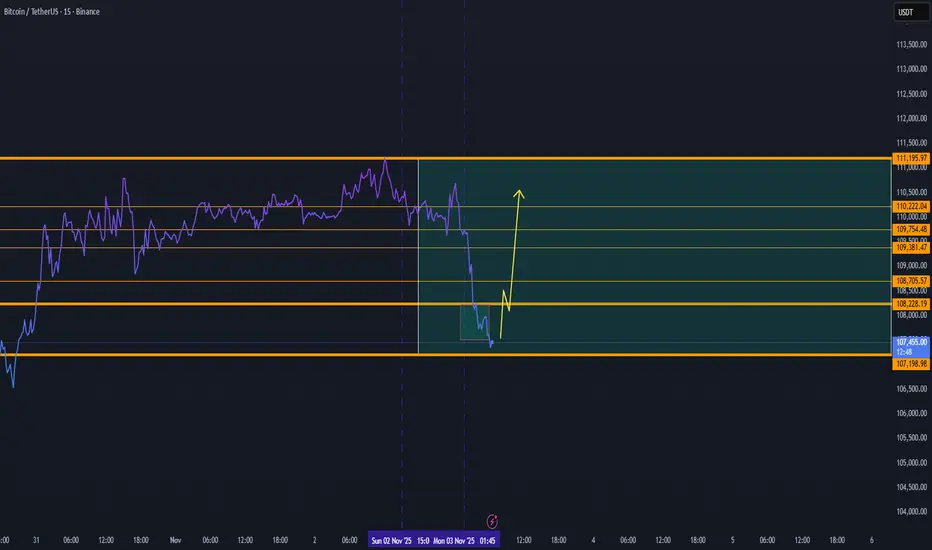
TradeCityPro | Bitcoin Daily Analysis #207👋 Welcome to TradeCity Pro!
After a short break, let's get back to the daily Bitcoin analysis. The market is still in a very large range box.
⏳ 1-Hour Timeframe
Currently, Bitcoin is recovering after the drop to the 106319 level and has moved up to 110803.
✅ Today is Saturday, and as you can see, the market volume has dropped significantly. It seems that the market may range until tomorrow afternoon and won't move much upwards, with the main movement starting next week.
⚡️ The triggers we have for opening positions right now are:
For long: 110803
For short: 108844 and 106319
💥 Overall, Bitcoin is in a very large range box between 106319 and 115808, and as long as the price stays between these two levels, I will open my positions with very low risk.
❌ Disclaimer ❌
Trading futures is highly risky and dangerous. If you're not an expert, these triggers may not be suitable for you. You should first learn risk and capital management. You can also use the educational content from this channel.
Finally, these triggers reflect my personal opinions on price action, and the market may move completely against this analysis. So, do your own research before opening any position.

BTC Reversal Momentum — Targeting 110K+ Zone ( DAY VIEW)Bitcoin is showing early signs of a potential short-term reversal after consolidating near the 107K–108K support area. The chart structure indicates a possible recovery wave that could push BTC back toward the 110K+ resistance range in the coming sessions.
Here’s the current structure breakdown:
🟢 Support Zone: 107K remains the key pivot base — holding this area keeps the potential for an upside bounce intact.
📈 Reversal Projection: If momentum builds from the current range, BTC could retest resistance levels at 109.3K → 110.2K → 110.7K.
⚠️ Invalidation: A breakdown below 107K would delay this upward move and reintroduce downside pressure.
Outlook:
Bitcoin is currently stabilizing after a local dip, with buying volume gradually returning. The next impulsive move could drive price action toward 110K+, potentially marking the start of a new short-term uptrend if confirmed by higher lows.
🕒 Summary: As long as BTC maintains structure above 107K, a recovery toward 110K+ remains a strong daily scenario.
Depending on our study BTC can enter a new cycle to 143K in 2025
#BTC Long toward $12100BTC is moving sideways as @unknown highlights current price near $109,942 aiming for a bullish breakout 📈 with targets around $123,313 noted on the chart.

BTC Scalp Sell/Short Setup (15M)The trend and structure are bearish, and Bitcoin is approaching a bearish origin point. If it fails to break through this origin, the low that created this bullish wave will be at risk.
With this in mind, we can prepare a position for Bitcoin with a risk-to-reward ratio of 1:2.
The last bullish wave on the lower timeframes also has a bearish CH.
Let’s see what happens.
For risk management, please don't forget stop loss and capital management
When we reach the first target, save some profit and then change the stop to entry
Comment if you have any questions
Thank You

Bitcoin Setup Ahead – Is the $115K Target Within Reach?🎯 BTC/USDT: The Gentleman Thief's Heist Plan | $115K Target 🔥
📊 Market Overview
Asset: BTC/USDT (Bitcoin vs Tether)
Market: Crypto
Strategy Type: Swing/Day Trade
Bias: 🐂 BULLISH
🎭 The Setup: Planning the Perfect Heist
Ladies & Gentlemen, gather 'round! We're orchestrating a sophisticated Bitcoin heist, and the vault is looking mighty accessible right now. 💼💰
🔍 TECHNICAL CONFIRMATION
✅ Weighted Moving Average (WMA) Double Pullback Detected
The chart structure shows a confirmed bullish setup with double pullback pattern on the WMA, signaling potential upward momentum continuation.
🚪 Entry Zone: Any Price Level
That's right, OG Thieves — flexibility is key! You can enter at current market price. We're not picky when the setup looks this clean.
🚨 Stop Loss: $103,000 (The Escape Route)
Now listen carefully, fellow bandits: This is my stop loss level at $103,000. But here's the deal — I'm NOT telling you to blindly follow my SL. You're the mastermind of your own operation! Manage your risk, protect your loot, and make decisions based on YOUR risk tolerance. Every thief needs their own exit strategy. 🏃♂️💨
🎯 Target: $115,000 (The Main Score)
Our primary target sits at $115,000. Why stop at $116K when there's a police barricade (strong resistance) + overbought conditions + potential trap zone lurking there? Smart thieves know when to grab the bag and disappear before the alarms go off! 🚔
Important Reminder: This is MY take-profit level. You run your own show! If you want to be greedy and push for $116K+, that's YOUR call. Take profits when YOU feel comfortable. This is your heist, not mine! 💼✨
🔍 Technical Analysis: Reading the Blueprint
Key Resistance Zones:
$115,000 - Primary target (Sweet spot to secure profits)
$116,000 - Strong resistance + overbought danger zone (Police barricade territory!)
Support Levels:
$103,000 - Critical support/stop loss area
Market Structure: Bullish momentum intact with room to run toward our target zone. Watch for signs of exhaustion near $115-116K.
👀 Related Pairs to Watch
Keep your eyes on these correlated moves:
🔹 ETH/USDT - Often follows Bitcoin's lead; look for confirmation
🔹 BTC Dominance (BTC.D) - Rising dominance = BTC outperformance
🔹 DXY (US Dollar Index) - Inverse correlation; weak dollar = crypto strength
🔹 TOTAL (Total Crypto Market Cap) - Confirms overall market sentiment
Key Correlation: When BTC pumps with strong volume, altcoins typically follow with a slight lag. Monitor Ethereum for confirmation of crypto-wide bullish sentiment.
🎪 Risk Management: Don't Get Caught!
⚠️ This is a high-risk, thief-style trading strategy — meant for entertainment and educational purposes!
✅ Golden Rules:
Never risk more than you can afford to lose
Position sizing is EVERYTHING
Have YOUR OWN exit plan
Markets can reverse faster than you can say "heist"
This is NOT financial advice — just one thief sharing his blueprint with other thieves! 🎩
💬 Final Word from Your Fellow Bandit
Stay sharp, stay disciplined, and remember: The best thieves are the ones who live to steal another day! 😎🔓
Whether you're swinging for the fences or day-trading the volatility, make sure you've got YOUR plan locked in. My levels are just a reference point — YOU are the mastermind of your own trading heist!
Good luck, OG Thieves! May your bags be heavy and your exits be timely! 🎯💰
✨ "If you find value in my analysis, a 👍 and 🚀 boost is much appreciated — it helps me share more setups with the community!"
#Bitcoin #BTCUSDT #CryptoTrading #SwingTrading #DayTrading #TradingView #CryptoAnalysis #BullishSetup #BTCPrediction #CryptoSignals #TechnicalAnalysis #BitcoinTrading #CryptoTA #PriceAction #TradingIdeas

Little Short Won’t Hurt a LotI’m opening a small short on Bitcoin.
You know that I’m expecting a decline toward 104K and possibly lower.
At the moment, I’m looking for a small move down — just a part of the bigger bearish trend.
Targets and stop are marked on the chart

BTC Entering New Uptrend —Weekend Volume Could Drive Price $116+BTC Entering New Uptrend — Weekend Volume Could Drive Price Above 116K +🚀
Bitcoin is showing strong signs of recovery after stabilizing at the lower support zone near 106K. The current structure indicates that BTC is entering a new uptrend, with higher lows forming and momentum gradually building.
📊 Market Structure:
BTC successfully held the volume support area and has begun to reclaim key short-term levels.
A break above 112K would confirm the shift in market momentum toward bullish continuation.
The next key resistance and target zone sits around 116K–117K.
💥 Weekend Outlook:
Volume is expected to increase through the weekend, which could fuel a strong upward move toward the 116K+ region.
With sentiment recovering and liquidity returning to the market, BTC appears positioned for a potential weekend breakout.
⚙️ Scenarios to Watch:
Holding above 109K–110K keeps the structure bullish and supports continuation toward 116K+.
Rejection below 109K could lead to a short pullback before another attempt upward.
💬 Summary:
BTC has entered a new uptrend phase, supported by strengthening volume and structure.
If momentum continues, a push beyond 116K during the weekend looks increasingly likely.

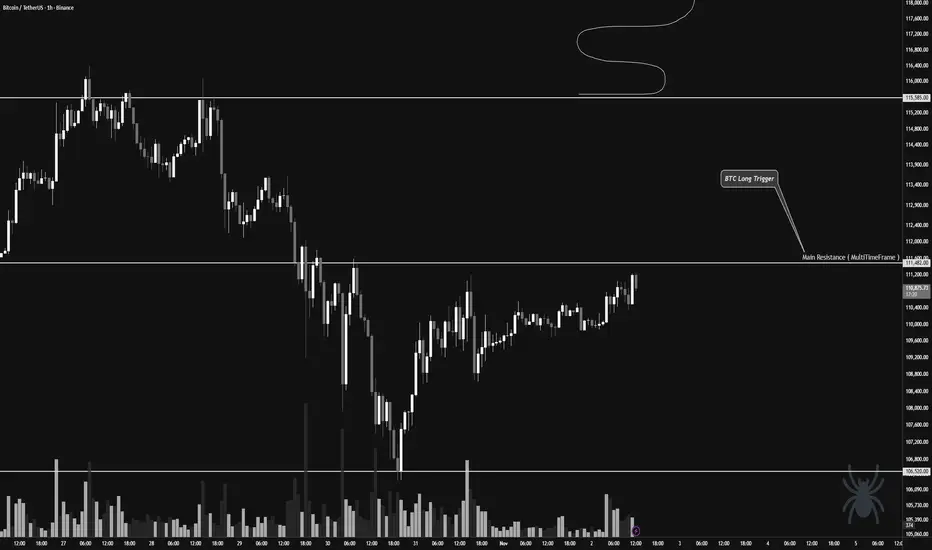
Major Breakout Setup Forming on Bitcoin’s 1-Hour Chart👋🏻 Hey everyone! Hope you’re doing great! Welcome to SatoshiFrame channel.
✨ Today we’re diving into the 1-Hour Bitcoin analysis. Stay tuned and follow along!
👀 On Bitcoin’s 1-hour timeframe, we can see that Bitcoin has built a multi-timeframe accumulation zone as the weekend began. It has now successfully broken above the top of this range, but we have a notable resistance area to keep an eye on.
The $111,482 price zone is a strong resistance level, and when price reached this zone, it faced heavy rejection and selling pressure. This area could provide the best trigger for a breakout. If Bitcoin manages to break above it, we could see a strong bullish leg and further upside momentum.
🧲 Bitcoin’s trading volume has slightly decreased over the past few days, so we’re waiting for volume expansion during the New York session to see what kind of reaction we get — this will guide our trade setup. Since there’s also a meeting between the U.S. and Chinese presidents tomorrow, we might prepare a speculative position ahead of that event to capture potential volatility and profits.
My current bias on Bitcoin remains bullish, as the trend hasn’t broken any significant support levels yet.
💵 Meanwhile, Tether Dominance (USDT.D) has reacted three times to its upper resistance zone on higher timeframes but failed to break above it. This suggests a bullish outlook for the crypto market, as a rejection in Tether Dominance could lead to downside movement there — fueling a strong bullish leg across the market.
✍️ The main long setup will trigger on a break above the $111,482 resistance zone. Confirmation can be taken from RSI oscillator signals and increasing buying volume.
We can open this low-risk long position (around 0.5% risk), and if tomorrow’s session brings clear bullish triggers, we can add to the position for larger exposure.
❤️ Disclaimer : This analysis is purely based on my personal opinion and I only trade if the stated triggers are activated .
From 107K to 104K — Bitcoin’s Next Stop Before the Big Drop?An update to my previous Bitcoin outlook — we’ve almost reached my 107K target.
Now, I’m setting a new short-term goal at 104K, though I believe we might even dip toward 100K.
Let’s see how the chart reacts as we approach the 104K zone.
On a larger scale, as I mentioned in one of my earlier posts, my global target remains around 83K.
The invalidation zone for this scenario is marked directly on the chart.
Let’s summarize 👇
📉 Nearest target: 107K (almost reached)
📉 Next target: 104K
📉 Possible drop to: 100K
🌋 Global target: 83K
👁️Follow me so you don’t miss future updates to my forecasts!

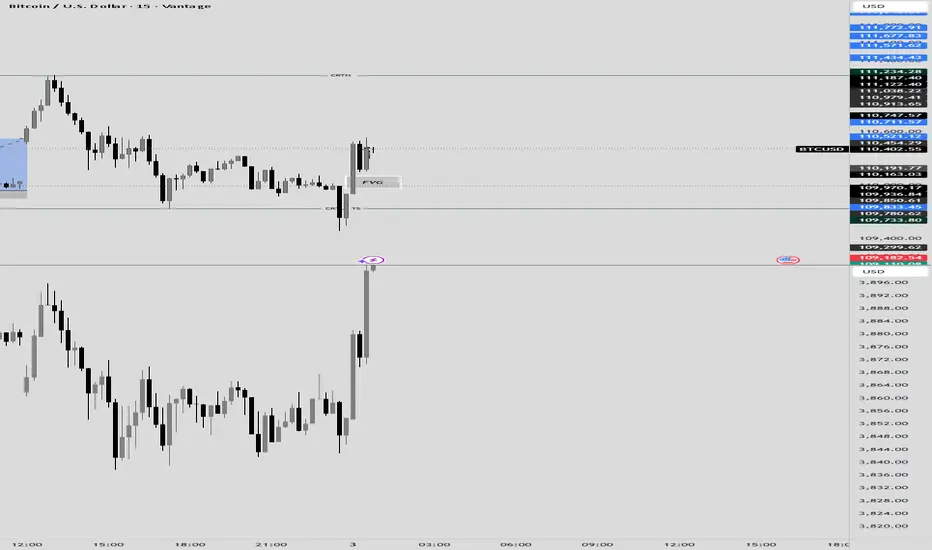
15-minute BTC/USD chart showing some clear price action pattern🚀 BTC/USD 5M - Short-Term Analysis: Bullish Displacement & FVG Fill the 5-minute chart for Bitcoin shows a significant shift in immediate order flow, characterized by a liquidity sweep followed by a strong displacement that left behind a clear price imbalance.
📊 Structure and Key LevelsCRTL + TS ($109,780.62 - $109,850.61): This zone marks a "Clear Run on the Low" (CRTL) or "True Stop-run" (TS). Price dipped below prior lows to trigger sell stops/liquidity, then immediately reversed higher. This is a classic sign of liquidity collection by institutional buyers.
FVG (Fair Value Gap/Imbalance): The strong green candles following the sweep created a significant Fair Value Gap between approximately $110,163.03 and $110,191.77. Price has recently retraced precisely into this gap.CRTH ($111,234.28): This level (a "Clear Run on the High") represents the major Buy-Side Liquidity (BSL) target that has been left un-tested and is the most likely destination for the next bullish move.
📈 Current Price Action and BiasThe chart shows a high-probability "Sweep $\rightarrow$ Displacement $\rightarrow$ Retrace to FVG" setup, which strongly favors continuation in the direction of the displacement (upward).
Stop Hunt Complete:
The market has successfully collected sell-side liquidity, providing the fuel for the move up.FVG Retest: Price has returned to the Fair Value Gap to effectively "fill" the imbalance created by the aggressive buying. This zone acts as a high-probability demand zone or entry point for bulls.
Bullish Confirmation: As long as price holds above the low of the liquidity sweep ($109,780.62), the immediate bias is bullish.
🎯 Trade Expectation
Entry: Look for confirmation (strong bullish candles or lower-timeframe shift) within or just below the FVG area.Target 1 (Liquidity): The primary target is the CRTH at $111,234.28 to clear the buy-side liquidity resting above those highs.Invalidation: A decisive close below the CRTL + TS zone (below $109,780.62) would invalidate the bullish structure and suggest a deeper drop toward the lower liquidity/support at $109,000.
BTC/USD Liquidity Blueprint – Are You Reading the Flow Right?🎯 BTC/USD: The Great Heist Setup | Swing Trade Blueprint 💰
📊 Market Overview
Asset: BTC/USD (BITCOIN/US DOLLAR)
Market: Cryptocurrency
Trade Type: Swing Trade
Strategy Style: The Thief Method™ (Layered Entry System)
🎨 Technical Setup
📈 Market Structure: BULLISH CONFIRMED
The Simple Moving Average is showing strong accumulation patterns with a healthy pullback structure. Bulls are loading up their bags like thieves preparing for the ultimate vault heist! 🏃♂️💨
Key Technical Indicators:
✅ SMA showing strong bullish accumulation
✅ Pullback phase completed
✅ Higher lows formation intact
✅ Volume supporting upside momentum
🎯 The Heist Plan: Entry Strategy
💎 The Thief Layered Entry System
Instead of going all-in at one price (that's how amateurs get caught! 👮), we're using a professional layered approach with multiple buy limit orders:
Entry Layers:
🔹 Layer 1: $108,000
🔹 Layer 2: $109,000
🔹 Layer 3: $110,000
🔹 Layer 4: $111,000
🔹 Layer 5: $112,000
💡 Pro Tip: You can add more layers or adjust based on your bag size and risk appetite. The beauty of this strategy? You average into position like a pro! 🎭
🛡️ Risk Management
⛔ Stop Loss: $106,000
⚠️ Important Note: Dear Thief OG's (Ladies & Gentlemen),
This is MY stop loss based on MY risk tolerance. You're the captain of your own ship! 🚢 Set your SL according to YOUR risk management rules. Remember: Take profits at your own risk, protect capital like it's your treasure!
🎯 Target Zone: The Great Escape
🚨 Target: $124,000
Why this target?
The "Police Barricade" (strong resistance zone) sits right here with multiple confluence factors:
🔴 Major resistance level
🔴 Overbought conditions expected
🔴 Bull trap zone activated
🔴 Historical rejection area
🏃♂️ Exit Strategy: When we hit this zone, it's time to take your loot and run! Don't get greedy and caught in the trap!
⚠️ Important Note: Dear Thief OG's (Ladies & Gentlemen),
This is MY take profit target. You're free to take profits whenever YOU feel comfortable. Your money, your rules, your timeline! 💰
🔗 Correlated Pairs to Watch
Keep your eyes on these related assets for confirmation:
💱 Major Correlations:
BITSTAMP:ETHUSD - Typically follows BTC momentum; watch for similar accumulation
BINANCE:BTCUSDT - Alternative pairing for liquidity confirmation
TVC:DXY (US Dollar Index) - Inverse correlation; weakness in DXY = strength in BTC
$SPX/SPY (S&P 500) - Risk-on sentiment indicator
GOLD ( OANDA:XAUUSD ) - Alternative store of value; competitive correlation
📍 Key Correlation Points:
When DXY weakens, crypto typically strengthens
Traditional market risk-on flows support Bitcoin upside
ETH/BTC ratio helps confirm alt-season vs BTC dominance
Gold movements indicate macro hedging flows
⚙️ Why The Thief Strategy Works
✨ Dollar-Cost Averaging (DCA) on steroids
✨ Reduces emotional decision-making
✨ Better average entry price
✨ Lower risk per order
✨ Professional money management
Think like a thief planning the perfect heist: multiple entry points, calculated risks, clear escape route! 🎭
🎬 Final Thoughts
This isn't financial advice—it's a strategic blueprint for those who trade with discipline and style! The market is our playground, but only the smart thieves get to keep their loot. 🏆
Remember:
📊 Stick to your plan
🎯 Manage your risk
💰 Take profits systematically
🧠 Trade with logic, not emotion
🎭 Execute like a professional
📣 Support This Analysis
✨ If you find value in my analysis, a 👍 and 🚀 boost is much appreciated — it helps me share more setups with the community!
#Bitcoin #BTCUSD #CryptoTrading #SwingTrade #TradingStrategy #TechnicalAnalysis #CryptoAnalysis #BTC #LayeredEntry #RiskManagement #ThiefStrategy #CryptoSignals #BitcoinAnalysis #PriceAction #TradingSetup #CryptoTA #BTCSetup #SwingTrading
🎯 Stay sharp, trade smart, and may the profits be with you! 🚀

what if $BTC Bitcoin has been trading within this ascending channel for years.
It has repeatedly touched the red resistance line but has never broken through.
Now, it's quietly recovering within the lower band.
The next upward move is $200k which coincides with the red resistance line.

Ready for BTC/USDT's Next Big Move?🎉 BTC/USDT: "Bitcoin vs. Tether" Crypto Wealth Heist Map (Swing/Day Trade) 🤑
🚨 Thieves of the Crypto Market, Assemble! 🚨
Ready to pull off a stylish swing/day trade heist on BTC/USDT? This is your Crypto Wealth Strategy Map with a bullish setup that’s screaming opportunity!
📈 Let’s dive into this cheeky yet professional plan with a sprinkle of thief swagger to snatch those profits! 💰
📊 The Setup: Why This Trade is a Steal! 🕵️♂️
Bullish Confirmation: We’ve got a double bottom pattern signaling a potential reversal. ✅
Accumulation Zone: Price action shows buyers stacking up, ready to push BTC higher. 🛒
Heikin Ashi Reversal: Smooth, green Heikin Ashi candles confirm the bullish vibes. 🟢
Market Sentiment: The crypto streets are buzzing with optimism — time to capitalize! 😎
The Thief’s Entry Plan: Layered Limit Orders 💸
This is where our thief strategy shines! We’re using a layering strategy with multiple buy limit orders to sneak into the market like the slick bandits we are. 🕴️
Entry Levels:
🎯 $112,000
🎯 $113,000
🎯 $114,000
🎯 $115,000
🎯 $116,000
Pro Tip: Feel free to add more layers based on your risk appetite! Stack those orders like a master thief planning the perfect heist. 😏
Why Layering?: This approach lets you average into the position, reducing risk if the market pulls a fast one. 🃏
🛑 Stop Loss: Protect Your Loot! 🔒
Thief’s Stop Loss: Set at $110,000. This is our escape hatch if the market turns into a trap. 🕳️
Note: Dear Thief OGs (Ladies & Gentlemen), this SL is just a suggestion. You’re the boss of your own vault — adjust it to your risk tolerance! 💪
🎯 Target: Cash Out Like a Pro! 🏦
Profit Target: Aim for $127,000, where we expect strong resistance and potential overbought conditions. Watch out for a possible trap — don’t get greedy! 😈
Note: Dear Thief OGs, this TP is my take. You decide when to grab your profits and vanish into the crypto night. 🌙 Take the money and run at your own discretion!
🔗 Related Pairs to Watch 👀
Keep an eye on these correlated pairs (all in USD) to confirm the broader market trend:
BITSTAMP:ETHUSD : Ethereum often moves in tandem with Bitcoin. A bullish ETH could reinforce BTC’s upward momentum. 📈
BITSTAMP:XRPUSD : Ripple’s price action can signal broader crypto market strength. Watch for similar bullish patterns. 🌊
COINBASE:LTCUSD : Litecoin tends to follow BTC’s lead. A breakout in LTC could confirm our bullish bias. ⚡
Key Correlation Insight: These pairs often move together due to shared market sentiment in the crypto space. If BTC/USDT pumps, expect ETH, XRP, and LTC to potentially follow suit. Cross-check their charts for confluence! 🧠
🛠️ Technicals Recap: The Thief’s Toolkit 🧰
Double Bottom: A classic reversal pattern signaling bulls are ready to charge. 🐂
Accumulation Zone: Buyers are quietly stacking positions — a sign of strength. 📦
Heikin Ashi: Smooth candles filter out noise, confirming bullish momentum. 🕯️
Resistance Watch: $127,000 is a key level where sellers might step in. Stay sharp! ⚠️
⚠️ Disclaimer: Thief Style, Just for Fun! 😜
This Thief Strategy is for entertainment and educational purposes only. Trading is risky, and the crypto market can be a wild ride. Always do your own research (DYOR) and manage your risk like a seasoned bandit. I’m not a financial advisor, just a cheeky chart enthusiast sharing the vibe! 😎
✨ If you find value in my analysis, a 👍 and 🚀 boost is much appreciated — it helps me share more setups with the community!
#BTCUSDT #CryptoTrading #SwingTrading #DayTrading #ThiefStrategy #Bullish #TechnicalAnalysis #HeikinAshi #DoubleBottom #MakeMoney

BTC/USDT 1H Chart Short-Term📉 Descending Channel (black lines)
The price previously moved within a clear descending channel, which was broken upward.
A breakout from the channel signals a change in the short-term trend – from supply pressure to an attempted rebound.
From a technical perspective, a breakout from a descending channel often leads to an upward correction, the extent of which is at least the midpoint of the previous downward impulse.
🔷 Triangle Formation (blue lines)
After breaking out of the channel, the price formed a symmetrical triangle (consolidation) – a sign of market indecision.
Triangles of this type are often trend continuation patterns, but in this context – after a breakout from a descending channel – an upward breakout (i.e., a further upward rebound) is more likely.
The key resistance level to watch is $111,145 – a breakout with volume confirmation would open the way to $112,320 and then $113,921.
🧭 Key Technical Levels
Resistance:
$111,145 – local resistance (upper boundary of the consolidation/triangle).
$112,320 – another strong resistance level from the previous local high.
$113,921 – major medium-term resistance.
Support:
$110,442 – lower boundary of the triangle (short-term support).
$108,793 – support after the recent bounce.
$107,285 – next demand level.
$104,969 – bulls' defensive boundary in the broader context.
📊 Stoch RSI (bottom of the chart)
The Stoch RSI oscillator is currently in a rebound phase from the neutral level (~40–60).
If the lines (blue and orange) cross upwards and enter the zone above 80, this could confirm bullish momentum and a breakout from the triangle to the upside.
However, a rejection from 60 and a further drop below 20 would signal a false breakout and a possible retest of USD 108,800.
🔎 Scenario Summary
➡️ Upside Scenario (more likely):
Breakout from the triangle to the upside (confirmed by a 1-hour candle above USD 111,150).
Potential move to USD 112,300 → USD 113,900.
Momentum indicators support a rebound if the Stoch RSI maintains its upward trend.
⬇️ Downside scenario (alternative):
Unsuccessful breakout and return below $110,400.
A correction to $108,800 can then be expected, and if this level is broken, a further decline to $107,300.

BTCUSDT -- Is 98K a key level??BTCUSDT -- Is 98K a key level and we see another ATH or we already hit the top of this cycle?
I would like some insights from expert and experienced traders here.

ATH incoming...The price will rise to $115,000 and then drop to the $103,000 range. This movement is driven by the liquidation of long and short positions. After collecting these liquidations, the price is expected to return to its previous all-time high (ATH)
