BTCUSDTThis breakout will push BTCUSD back up to 122k. But don't bet all your capital because of that. The market can be volatile, always manage your risk.
BTCUSDT

TradeCityPro | Bitcoin Daily Analysis #194👋 Welcome to TradeCity Pro!
Let’s analyze Bitcoin today, the market has calmed down a bit, and we can perform some analysis.
⏳ 1-Hour Timeframe
In the 1-hour timeframe, Bitcoin has reached a support level around $109,000 and has shown a reaction to this level.
⭐ After the heavy drop that occurred two days ago, the open interest and market volume have decreased significantly, which clearly indicates that market participants are currently indecisive.
✨ Yesterday, the price reacted to the support zone on Bitcoin, and a significant resistance was created around $112,420, which it has now reached again.
💥 The RSI oscillator has finally moved out of the Oversell zone, and it’s currently below the 50 level.
🧮 Although there’s still fear and a bearish momentum in the market, breaking the $112,420 resistance could be a very risky long trigger.
✔️ Personally, I’m waiting and observing. However, for those who like to open positions every day, breaking this resistance is the only long trigger I can provide.
💡 For a short position, we could enter after the price breaks below the level. I’m passing on this position for now and will wait for a confirmation to search for a short trigger after the price stabilizes below this zone.
❌ Disclaimer ❌
Trading futures is highly risky and dangerous. If you're not an expert, these triggers may not be suitable for you. You should first learn risk and capital management. You can also use the educational content from this channel.
Finally, these triggers reflect my personal opinions on price action, and the market may move completely against this analysis. So, do your own research before opening any position.

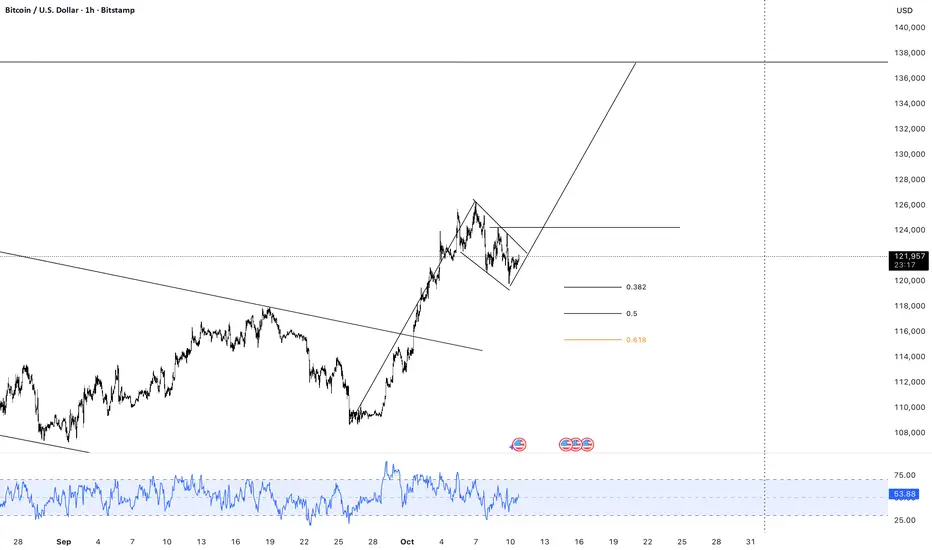
BTCUSDBTCUSD has dropped heavily last week and could be potentially completing triangle for another push to start very soon.
Disclosure: We are part of Trade Nation's Influencer program and receive a monthly fee for using their TradingView charts in our analysis.

Bitcoin Another Bounce Coming?Bitcoin is currently retesting its 50-week Simple Moving Average (SMA) — a historically significant support zone that has acted as a launchpad for multiple bullish continuations throughout previous markets.
Each time BTC has interacted with this moving average since mid-2023, it has managed to rebound strongly, confirming it as a key dynamic support level during this bull phase.
🔶If BTC holds above the 50-week SMA, it may indicate another healthy correction within an ongoing uptrend, potentially setting the stage for the next leg higher.
🔶A clean weekly close below the 50 SMA could suggest a trend weakening and open the door for deeper retracements toward the $90K–$95K region.
Cheers
Hexa

$BTC - What’s Next for Crypto?In the most recent dump, roughly $19 billion worth of leveraged crypto positions were liquidated within 24 hours, with around $17 billion coming from longs. Shorts accounted for a much smaller portion.
The liquidation cascade tore through the market, forcing positions to close en masse. It wasn’t just a typical sell-off — it was a violent, systemic deleveraging. A complete reset. All that excessive, unstable leverage that had made the market so fragile was flushed out in one brutal move, a classic liquidation flush and rebalance.
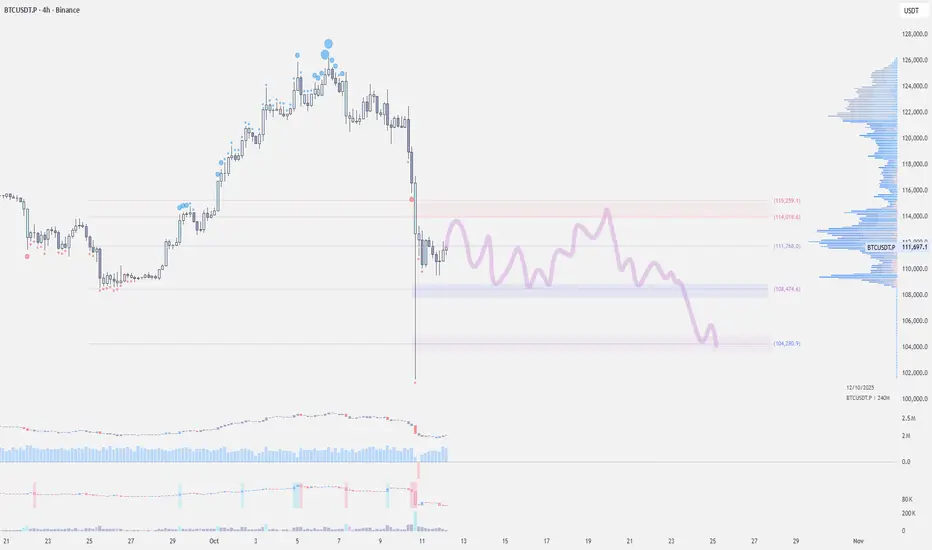
Now that the dust is finally settling, the big question is: what’s next for crypto?
I’m expecting price action to move sideways for a while as the market rebalances. It could take about a month before a new, clear trend starts to emerge.
We could see price filling imbalances up to the 114–115k zone, then ping-ponging back down to 108–107k. That said, I’m leaning toward the likelihood of a pullback to around 104k.
BTC likely scenario is to re-test the 120K USD BTC will likely restest the upper trend line (~120k) while ETH will make a new All time High in
coming 2/3 weeks.
NOTE: the longer BTC hang 110k range the stronger will be the ALT season.
Scenario1:
BTC will likely establish itself above 120k (for 2 week) we will se a three week ALT season.
Scenario2:
If BTC get rejected at 120k ETH will consolidate at 4000-5000 range while other ALT have to wait for ALT season or ALT will rise for momentarily only.
BTC: 145,000-170000$ would be a good exit
ETH: 8000-14000$
ADA: 7-13$
NOTE: MISAKENLY wrote 20k on chart, Correction it is 120k

BTC: Oscillating to build a bottomOver the weekend, after a sharp decline in the early stage, the Bitcoin price is currently in a shock - bottoming phase. In the early stage, the short - selling force was strong, pushing the price down rapidly. However, over the weekend, the price fluctuation range gradually narrowed, indicating that the strength of the long and short sides tends to be balanced in the competition, and the market is looking for a short - term direction.
Although Bitcoin rose in oscillations today, it encountered resistance near 112,500 and failed to break through after several attempts. This position has gathered a certain number of trapped orders and active sell orders, forming a short - term resistance range. If the bulls can gather enough strength to break through the 112,500 with increased volume, the upward space will be opened, and the price may further challenge the resistance levels of 115,000 or even 120,000. However, due to the sharp decline in the early stage, the market sentiment is still relatively fragile, and investors are generally cautious. From a technical point of view, Bitcoin is likely to continue to oscillate and consolidate in the range of 108,000 - 115,000 today, and the long and short sides compete around key levels.
Buy 108000 - 110000
TP 113000 - 115000
SL 106000
Daily-updated accurate signals are at your disposal. If you run into any problems while trading, these signals serve as a reliable reference—don’t hesitate to use them! I truly hope they bring you significant assistance
ElDoradoFx PREMIUM 2.0 – WEEKEND BTCUSD ANALYSISBTC is trading around 111,600, recovering after last week’s sharp correction from 126,000.
Price is forming higher lows from 109,500, suggesting a short-term bullish correction while overall structure remains bearish.
⸻
🔍 Technical Outlook
Daily Structure (1D):
BTC is holding above the 200 EMA / major demand zone (107,700–108,800).
Momentum indicators (MACD + RSI) show early recovery — buyers stepping in after the deep retracement.
Trend is still bearish, but a clean push above 112,500–113,000 would confirm a short-term CHoCH bullish shift.
The Fibonacci retracement (126,000 → 107,200) marks the Golden Zone at 116,600–118,400, still the ideal swing-sell region.
Intraday (1H + 15M + 5M):
Charts show a clear bullish order block (OB) around 110,200–111,000 and a bearish OB above 112,800–113,200.
Fair Value Gaps (FVGs) remain unfilled near 112,400–113,000, likely short-term targets.
Market structure: forming Higher Lows (HLs) with momentum building on the MACD and RSI across lower timeframes.
Short-term bias: bullish correction until resistance confirms rejection.
⸻
📌 Breakout Levels to Continue Trend
Bullish continuation:
• Break above 111,800, retest 111,400–111,600 → upside path 112,400 → 113,200 → 114,000
• If price continues, next resistance aligns at 116,600–118,400 (Golden Zone)
Bearish continuation:
• Break below 110,200, retest 110,400–110,600 → downside path 109,200 → 108,000 → 106,800
• Clean close below 108,800 confirms daily bearish trend resumption
⸻
📅 Fundamental Watch
No major weekend data.
Sunday CME gap (109k–111k) could attract liquidity before Monday’s open.
Upcoming U.S. CPI next week will define the next strong directional move in BTC and risk assets.
⸻
⚠ Key Levels to Monitor
Resistance zones:
111,800 / 112,400 / 113,200 / 116,600 / 118,400
Support zones:
110,200 / 109,200 / 108,000 / 107,700 / 106,800
⸻
✅ Summary
BTC is consolidating inside a bullish order block, with momentum building toward 112.8k–113.2k, where a major bearish OB + FVG confluence exists.
A break and retest above 111,800 could extend the recovery to 113k–114k, while failure below 110,200 would reopen the path to 108k–106.8k.
Main trend remains bearish, but short-term correction likely continues before sellers regain control near the Golden Zone (116.6k–118.4k).
— ElDoradoFx PREMIUM 2.0 Team

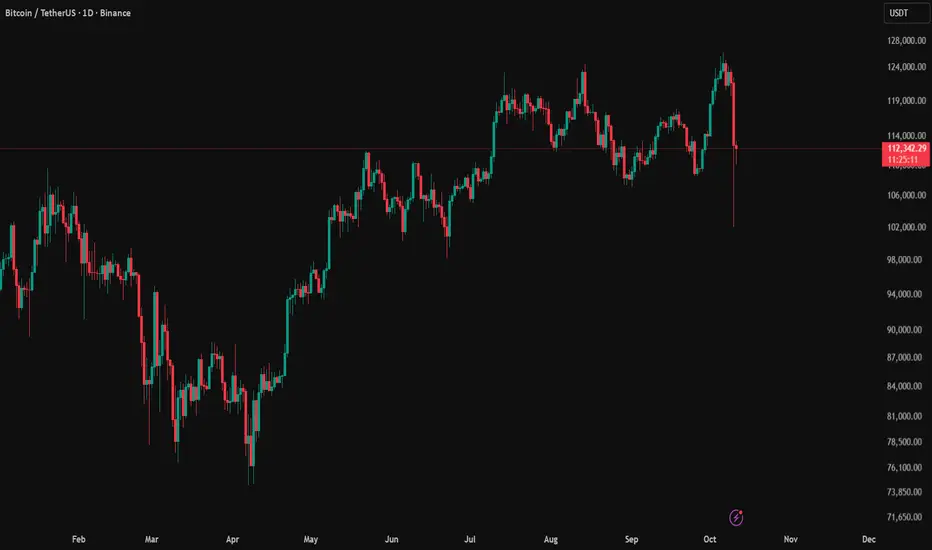
Bitcoin (BTC/USDT) – Daily Chart Analysis !!Bitcoin (BTC/USDT)
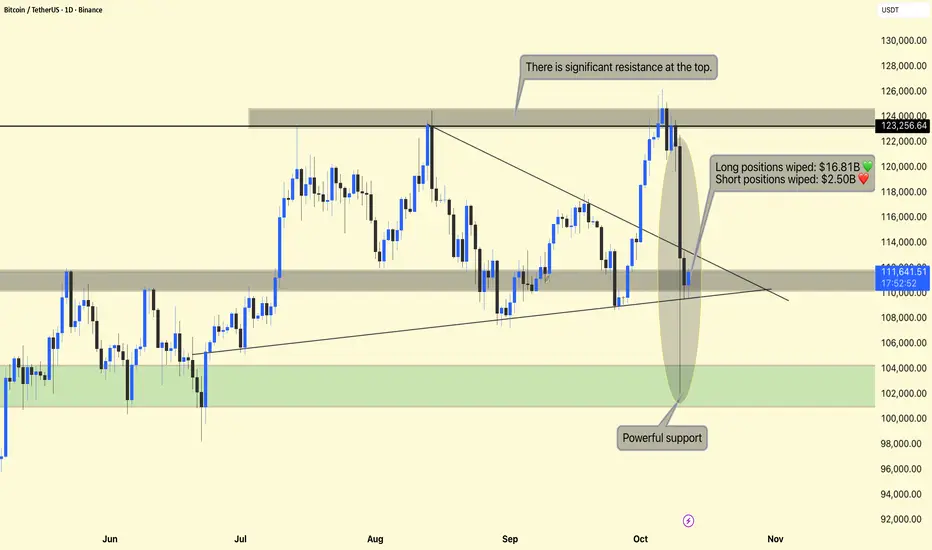
The chart shows a sharp correction from the $124,000 resistance zone, followed by a major liquidation event that wiped out:
Long positions: $16.81B
Short positions: $2.50B
This represents one of the most volatile 24-hour periods in recent months — aligning with the Fear & Greed Index drop to Extreme Fear (24).
$123,000 – $124,000 Major Resistance Strong supply area — multiple rejections in past rallies.
$111,000 – $110,000 Current Support Zone Price is currently consolidating here after the crash.
$102,000 – $104,000 Powerful Support Historical accumulation zone — where buyers previously stepped in aggressively.
Resistance Rejection
At the top of the range ($123,000–$124,000), BTC encountered heavy resistance, triggering large-scale profit-taking and the liquidation of overleveraged long positions.
This area has acted as a strong rejection zone several times since August, indicating sellers are defending it aggressively.
Breakdown and Liquidations
After the breakdown of the descending triangle, cascading liquidations forced a steep drop.
This led to a high-volume candle (highlighted area) where:
Liquidity was cleared both above and below key support levels.
Market sentiment flipped rapidly from Greed → Extreme Fear.
This kind of liquidation sweep often signals a short-term capitulation — a flush before possible recovery.
Support & Market Structure
Price bounced from near $110,000, a previous structure support level.
If BTC maintains above $110,000, it may attempt to stabilize and retest mid-range resistance around $115,000–$116,000.
However, if price breaks below $110,000, we could see a retest of the $102,000–$104,000 demand zone, which is marked as “Powerful Support” — a key area where long-term buyers might re-enter.
DYOR | NFA
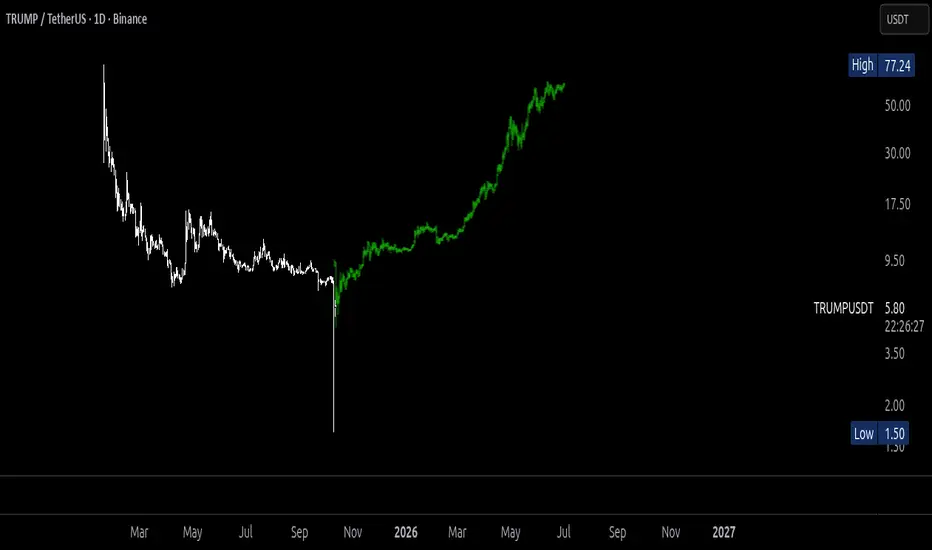
OFFICIAL TRUMP TO 700! ITS GONNA EXPLODE SOON!After the massive drop in cryptocurrencies in general, it seems similar to what happened during the COVID era. I expect the market to react explosively, and TRUMPUSDT should reach or approach BNB's level, reaching $700+.
JUST BUY AND HOLD!
Selling prices... 80, 150, 300, 600, 700.
BITCOIN – THE REAL REASON BEHIND THE FALLWhen I started trading someone told me something I’ll never forget: “If you can predict tomorrow’s newspaper headline, you understand the market.”
He didn’t mean I should chase news. He meant I should read structure so well that I know what kind of headline the market is already writing, before the mass even see it.
And now, looking around online, I see the complete opposite. Everywhere you look, there’s another “confluencer” talking about crypto with big words and zero understanding.
People selling dreams, memberships, and indicators, while they don’t even know what open interest or CVD means.
I’m not here to sell anything. I’m here to help people actually learn how to read data and see through the noise. Because what most of these so-called experts call “analysis” is just emotional guessing wrapped in confidence.
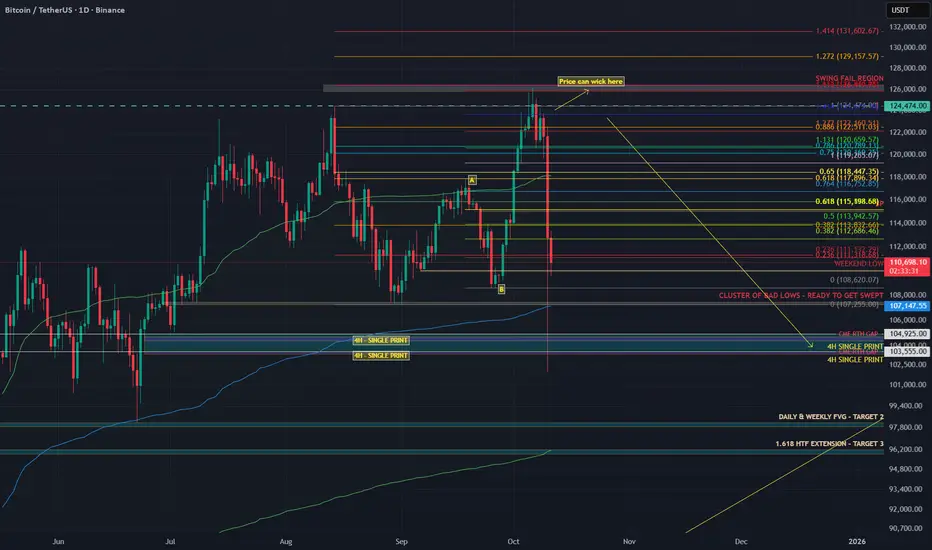
What I called and what happened
Last week I posted my “Big Dump” thesis.
I said Bitcoin would swing fail above the highs, then drop into the 104K region. That is exactly what happened.
Price ran the sweep into 126K, trapped the late buyers, and dumped straight into 104K.
People blamed tariffs. The tariff headline was the spark. The fuel was crypto’s own positioning.
Why the structure was ready to snap
Before the crash, the data told the story clearly.
Stablecoin OI went from 257K to 285K contracts (+10.9%). That is new leveraged exposure.
Coin-margined OI dropped during the breakout, then rose again near the highs. Shorts were fading strength.
Spot CVD stayed flat to slightly negative. Real buyers were missing.
The long/short ratio fell from 2.05 to 1.02 even while price kept climbing.
That’s what distribution looks like. Buyers on leverage pushing price up while stronger hands sell into them. No real spot demand, just futures exposure.
You don’t need a macro event to fall. You only need a reason for those leveraged buyers to stop bidding. Think of it like a crowded elevator. Everyone keeps piling in as it moves up, feeling safe because it hasn’t stopped yet. But the moment one person hesitates, the weight shifts. When the next person panics, the whole thing drops.
That’s what happens when a market is driven by leverage instead of conviction. You don’t need bad news, you just need hesitation.
Look back at similar events.
In May 2021, funding rates were insane, perps overloaded, and spot volume thin. Elon Musk tweeted about Bitcoin’s energy use. That tweet didn’t cause the dump. It just made leveraged longs pause. The bids disappeared and the cascade started.
In August 2023, Evergrande headlines hit. Bitcoin was sitting at resistance with flat spot CVD and rising OI. Equities wobbled, crypto longs hesitated, and the structure collapsed within hours.
In March 2020, when COVID panic hit, Bitcoin had already been stretched thin. Funding was high, leverage was heavy, and liquidity was weak. The virus didn’t break the market, leverage did.
Leverage creates confidence until it doesn’t. Price doesn’t fall because people start selling. It falls because nobody steps in to buy. Headlines decide when the drop starts. Structure decides how far it goes.
Why 104K was my first target
I didn’t pick 104K out of thin air. That level was built on confluence.
1) AVWAP from the April 7 auction
That swing low kicked off with massive volume. When a move starts with that kind of participation, the anchored VWAP becomes a key reference for institutional flow. It represents the average cost of that whole auction, and when extended forward, it acts as a dynamic area where liquidity and algorithms interact.
That blue AVWAP line from April has been running right through the 104K region.
It’s not that price revisited that auction, it’s that the anchored VWAP from that event still marks the fair value area for that entire move.When price traded back down into that region, it met that same volume-weighted anchor, creating a major confluence zone that algos and larger players watch closely.
2) The June 22 breakout left an LVN
A new auction started on June 22 and pushed higher, leaving a Low Volume Node behind.
An LVN is a thin zone on the volume profile where the market moved quickly with little trade.
Markets often revisit these thin areas later to find balance or test unfinished business.
3) HTF Fibonacci cluster
Multiple higher timeframe Fibonacci retracements and extensions overlapped near the same 104K area. When several fib levels align with structure, that’s a strong confluence zone watched by both human traders and algorithms.
The 104K region was where the AVWAP line, LVN, and fib cluster all met. That’s not a random target. It’s a structurally defined area where liquidity concentrates and where markets tend to react sharply. And that’s exactly what happened.
The spark versus the structure
The tariff headline didn’t cause the drop. It triggered it.
The structure was already unstable. Leverage was maxed. Spot demand was flat. Funding was positive and rising. When the tariff news hit, traditional markets pulled back and crypto followed instantly. It wasn’t correlation, it was liquidity contagion.
Traders managing multiple books de-risk across assets when volatility spikes. That creates a gap in liquidity. When the bids vanish, the market falls into the first real pool of resting orders — in this case, the 104K zone.
You saw the same mechanics during the March 2020 crash and the 2021 deleverage. External shocks trigger internal liquidation cascades. That’s why saying “this had nothing to do with crypto is completely wrong.
This had everything to do with crypto. It’s like blaming the thunder for breaking a window when the glass was already cracked. Or saying the iceberg sank the Titanic when the captain was already steering through a sea of warnings.
Crypto was structurally weak. Leverage was stretched, spot demand was gone, and funding was positive. When the headline hit, it didn’t cause the collapse. It just gave the market permission to do what it was already set up to do — unwind.
Crypto is built on leverage.
Perpetual futures dominate volume.
Stablecoin collateral drives exposure.
When external risk events change funding conditions or risk appetite, the crypto market reacts instantly because its structure is fragile by design.
Example:
When yields spike, the dollar strengthens and funding costs rise. Leveraged longs become more expensive to hold, so traders unwind positions.
When equities dump, cross-asset desks reduce risk globally, which pulls liquidity out of crypto perps too.
Intermarket correlation always matters. Macro sets the mood. But the speed and violence of crypto moves always come from leverage inside the system.
How you can spot it next time
Compare Spot CVD vs Stablecoin CVD. If stablecoin CVD rises while spot stays flat or negative, the rally is leverage-driven.
Track Open Interest vs Price. Both rising together usually means exposure is building. Confirm with spot flow.
Watch the Long/Short ratio. If it drops while price rises, shorts are entering and the move may be getting absorbed.
Anchor VWAPs to real pivots like swing lows, breakouts, or liquidation spikes. Those levels attract institutional flow.
Study Volume Profiles. LVNs are thin and often retested. HVNs are balance zones that attract price.
Map HTF fib clusters for confluence. Reactions are stronger when multiple timeframes agree.
Note single prints and thin brackets on TPO or volume profiles. These often act as magnets.
When these factors line up, you don’t need to predict headlines.
You’ll already most likely know which headline will break the market.
TLDR
The rally was leverage-driven: Stablecoin OI up 10.9%, Spot CVD flat, Long/Short ratio down from 2.05 to 1.02
The swing fail at 126K was the final liquidity grab
104K was the target due to AVWAP + LVN + HTF fib cluster
The tariff headline was the spark, not the cause
The crash was caused by leverage and missing spot demand
Crypto didn’t fall because of politics. It fell because the market was already begging for an excuse to reset.
The data showed it clearly weeks before the drop.
If this helped you see the market a little clearer or made you think differently about how price really moves, please leave a like and drop a reaction. It keeps me motivated to keep posting real analysis, not the copy-paste bullshit hype that floods your feed every day.
Check the Order Flow Data from 6 October here: ibb.co
Bitcoin 130,000 – Correction AheadBitcoin
Around the $130,000 level, there is a possibility of a deep correction toward the $74,000 zone.
Do not panic, and do not get carried away by emotions.
This is the market — it plays with your psychology.
The market is geometric. BYBIT:BTCUSDT

2 year Bitcoin roadmapThis is the way.
In time, you will understand the power of simple lines and the cyclical nature of markets across time. It all repeats, whether it is algorithms or human action; 80% of things follow patterns.
Randomness and outliers are always a minority.

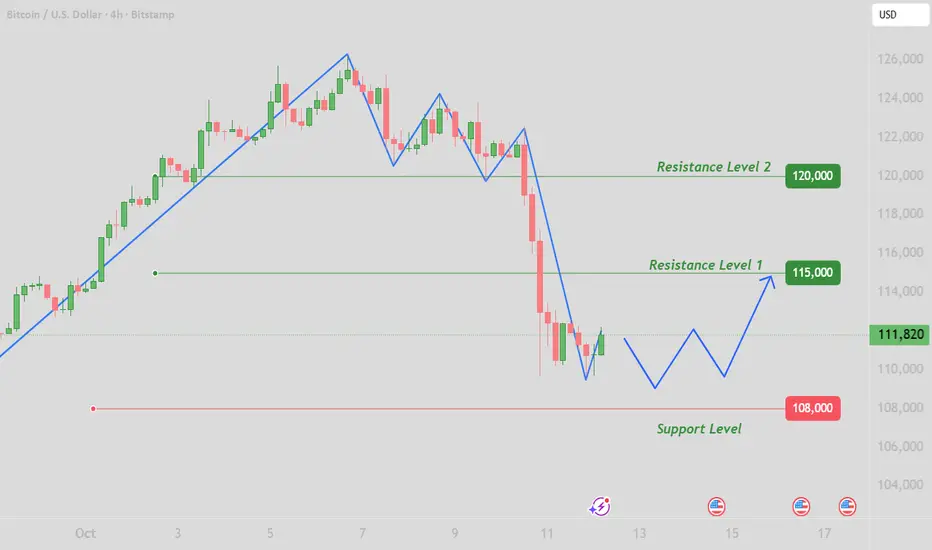
After a strong downward movement, the price has formed a base anAfter a strong downward movement, the price has formed a base and is now showing signs of upward momentum. The chart suggests a long trade setup, with clear targets at 113,052 (Target 1) and 114,037 (Target 2), while maintaining a stop loss around 111,000.

Bitcoin Breakdown | BPR Rejection Could Trigger Deep Sell-OffHello Billionaires!!
We All know that BTCUSD is showing classic Smart Money Distribution after a clean BPR rejection in the premium zone.
Price swept the Buy Side Liquidity (TS) and tapped into the BPR, confirming bearish order flow. Now, we’re likely to see a continuation down toward the FVG & OB below 106K–102K, targeting the SSL zone.
📉 Smart Money Storyline:
BSL taken ✅
BPR tapped (Premium Delivery) ✅
Bearish continuation setup forming 🔥
Possible drawdown into FVG & OB before new accumulation
💡 If BTC holds below the BPR zone, expect strong downside liquidity runs in the coming days.
#BTCUSD #AliyanFX #SmartMoneyConcepts #ICT #PriceAction #Liquidity #BPR #OB #FVG #Forex #TradingViewIdeas #CryptoAnalysis

TradeCityPro | Bitcoin Daily Analysis #193👋 Welcome to TradeCity Pro!
Let’s analyze Bitcoin, yesterday, a phenomenon called a Flash Crash occurred, and the market experienced a massive drop. Let’s review what happened and where the market stands now.
⏳ 4-Hour Timeframe
Before diving into the chart, let’s first understand what happened in the broader market.
🔍 Yesterday, the U.S. restricted the sale of certain computer chips to China,
and in response, China halted exports of five rare elements to the U.S.
📰 Then, the U.S. reimposed heavy tariffs on China, and China raised duties on American ships.
✨ These escalating tensions severely impacted global markets — and we witnessed the largest Flash Crash in Bitcoin’s history.
📉 A total of $19 billion worth of positions were liquidated, marking the highest figure ever recorded in crypto history.
To put that into perspective, during the COVID crash, only about $3 billion was liquidated — a massive difference.
🔔 Interestingly, Bitcoin dropped less compared to most altcoins and managed to recover partially.
However, altcoins like TON, AVAX, ARB, and SUI (each with their own networks) saw brutal crashes, many with wicks of 60–70% downward.
📊 Now, looking at the chart, yesterday, Bitcoin was ranging above the $120,835 zone.
🧮 Once the geopolitical tension began, the price started a strong downward move, breaking below its key support.
🔽 After two large red candles and a close below support, the third candle formed a 12% wick, dropping as low as $102,000.
✔️ Following that, the price quickly recovered and is now consolidating above the $109,000 support zone.
💡 At the moment, in such a highly volatile environment, finding valid triggers and opening new positions isn’t ideal.
🔑 The price action has been driven mostly by news and panic, so it’s best to wait until the market stabilizes and the effects of these developments fade away.
❌ Disclaimer ❌
Trading futures is highly risky and dangerous. If you're not an expert, these triggers may not be suitable for you. You should first learn risk and capital management. You can also use the educational content from this channel.
Finally, these triggers reflect my personal opinions on price action, and the market may move completely against this analysis. So, do your own research before opening any position.

BTC:Flash crashToday Bitcoin suffered a "flash crash", plummeting by over 13% in the early hours and falling below the $110,000 mark, which triggered forced liquidations for more than 1.6 million traders.
The core market situation can be summarized as leverage-driven cascading liquidations led by policy negatives. While short-term volatility has intensified, long-term key factors remain unchanged. Before the crash, Bitcoin’s leverage ratio soared to 50x, and high-leverage trading was prevalent among retail investors. Price fluctuations triggered forced liquidations, amplifying the decline.
We judge that the 103,000 level and the psychological threshold of 110,000 serve as crucial short-term support levels. If the price breaks below 100,000, a deeper correction may be triggered.
The Federal Reserve’s October interest rate decision, the progress of the U.S. government shutdown, and the follow-up developments of Trump’s trade policies will become core variables in the next phase.

Descriptions about the market! Read the caption!Given Mr. Trump's remarks and the unprecedented crash in cryptocurrencies, I must say this individual significantly harms markets, especially investors. Imposing a 100% tariff on Chinese goods essentially means "we want no trade with you," which is fundamentally unfeasible. The United States and China will undoubtedly negotiate. However, our main focus here is the financial market collapse. This decline isn’t merely about falling prices—it goes beyond that. The core issue is the loss of market trust and credibility. Once confidence is broken, it is difficult to restore and may take a long time.
In any case, I felt it was my duty to bring this up and remind you to stay composed. Never forget to use stop-losses in your trades and practice proper capital management.
If needed, you can always message me on this platform for advice.
NOTE: This post is This post is educational.
BTC 1D Analysis - Key Triggers Ahead | Day 54☃️ Welcome to the cryptos winter , I hope you’ve started your day well.
⏰ We’re analyzing BTC on the 1-Day timeframe .
👀 After the start of the trade war between the United States and China, news was released about a 100% tariff imposed by the United States on China. The crypto market experienced an unbelievable heavy drop (flash crash) last night, which from a technical point of view was completely unexpected and caused the biggest financial loss in the history of crypto.
👍 On the Bitcoin chart and in the daily timeframe, we can see that it is inside a very strong ascending channel, which even with last night’s drop has not closed below its channel body. Currently, Bitcoin is ranging with support at the bottom of the channel, and since it’s the weekend, the market volume has decreased sharply, and we are in a state of uncertainty until the new week’s open.
💡 Note that Bitcoin has not yet entered a trend reversal for the start of its heavy drop. The reversal zone that I specified in the analysis is between $108,960 and $107,521. With a break and confirmation below this zone, Bitcoin can experience a deeper correction and end its long-term primary trend and enter a secondary trend. We can also consider this zone as a distribution area.
Also note that Bitcoin’s return inside the channel has been supported by strong buyers, which has caused this uncertainty. In summary, Bitcoin has a very important resistance in the $114,351 zone, and with a break and confirmation above this area, it can move upward and turn the flash crash into a continuation move. In the continuation of the analysis, we will also use indicators and volume to reach the best conclusion.
🧮 In the RSI oscillator, we can see that after the selling pressure and increase in volatility, it moved downward and easily crossed the 50 zone. We have now defined two key RSI zones:
Zone 50 can be our long trigger area.
Zone 37, where if volatility passes below this level, Bitcoin can move toward the oversold area in its daily timeframe and experience a deeper correction.
🕯 First, let’s talk about volume — the selling pressure was so strong that it pushed the Bitcoin price near $102,000, and then it faced support from buyer makers (those who buy with market-type orders), which brought the price back above $110,000. The size of Bitcoin’s recent candle has been very strong and large, showing the great power of the sellers. With the increase in selling volume and continuation of the tariff war, the market can enter a risk-off state in higher timeframes, and investors may sell their Bitcoins, putting more selling pressure on BTC.
🧠 With the intensification of the tariff war between the U.S. and China, Bitcoin may start its secondary trend after weeks and months of bullish movement, but we still can’t make a definite decision about this issue. So we are waiting for the break of the defined zones in the analysis to make the best decision. Last night’s event was truly painful — a big experience and lesson for all of us that if we can manage our capital, we can have the best results relative to the market. However, last night will be remembered as the biggest financial loss in crypto history.
❤️ Disclaimer : This analysis is purely based on my personal opinion and I only trade if the stated triggers are activated .

Bitcoin Ready to Fly! Harmonic ABCD Pattern
Bitcoin is currently active in the trading market, forming a harmonic ABCD pattern.
Price has retraced around 30% to a key Fibonacci level.
This zone may act as a potential reversal area if buyers hold the level.
RSI shows bullish divergence, indicating weakening bearish momentum.
Risk–Reward Ratio (RRR): 1:2
BTC:Performance Recap for the weekThis week, the Bitcoin market witnessed an extreme price movement characterized by "a frenzy-driven rally – panic-induced volatility – a cliff-like crash", with a weekly volatility of 21.3%, marking the most drastic fluctuation record since 2025. Market sentiment oscillated repeatedly between greed and fear, and the trend can be specifically divided into three phases:
Monday: A momentum-driven rally to a phased peak
Tuesday to Wednesday: The first pullback after hitting a new high
Thursday to Friday: A black swan event triggering a crash-like decline
We judge that the 103,000 level (this week’s low) and the psychological threshold of 110,000 serve as crucial short-term support levels. If the price breaks below 100,000, a deeper correction may be triggered. The Federal Reserve’s October interest rate decision, the progress of the U.S. government shutdown, and the follow-up developments of Trump’s trade policies will become core variables in the next phase. Uncertainties surrounding geopolitics and macro policies may continue to intensify market volatility.

#BTC #BTCUSD #BTCUSDT #BITCOIN #Analysis #Eddy#BTC #BTCUSD #BTCUSDT #BITCOIN #Analysis #Eddy
I have identified the important supply and demand zones of the higher timeframe for you.
This analysis is based on a combination of different styles, including the volume style with the ict style.
Based on your strategy and style, get the necessary confirmations for this analysis to enter the trade.
Don't forget about risk and capital management.
The responsibility for the transaction is yours and I have no responsibility for your failure to comply with your risk and capital management.
💬 Note: This is just a possibility And this analysis, like many other analyses, may be violated. Given the specific circumstances of Bitcoin, it is not possible to say with certainty that this will happen, and this is just a view based on the ICT style and strategy with other analytical styles, including the liquidity style. (( The fall of Bitcoin may not change the trend of altcoins and money will move out of Bitcoin and into altcoins, and we will see altcoins grow. ))
Be successful and profitable.

A good and hopeful piece of news for Bitcoin !!Despite the sharp price drop, fortunately, our descending wedge has not yet broken, which could be encouraging and may push the price up slightly.
PREVIOUS ANALYSIS
