BTCUSDT Analysis: Breakout and Potential Growth👋Hello everyone, what do you think about BINANCE:BTCUSDT ?
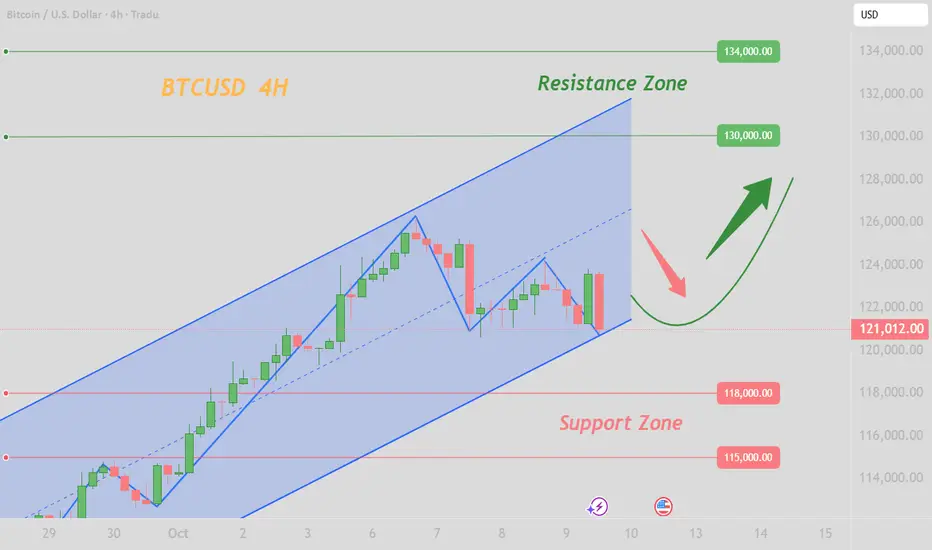
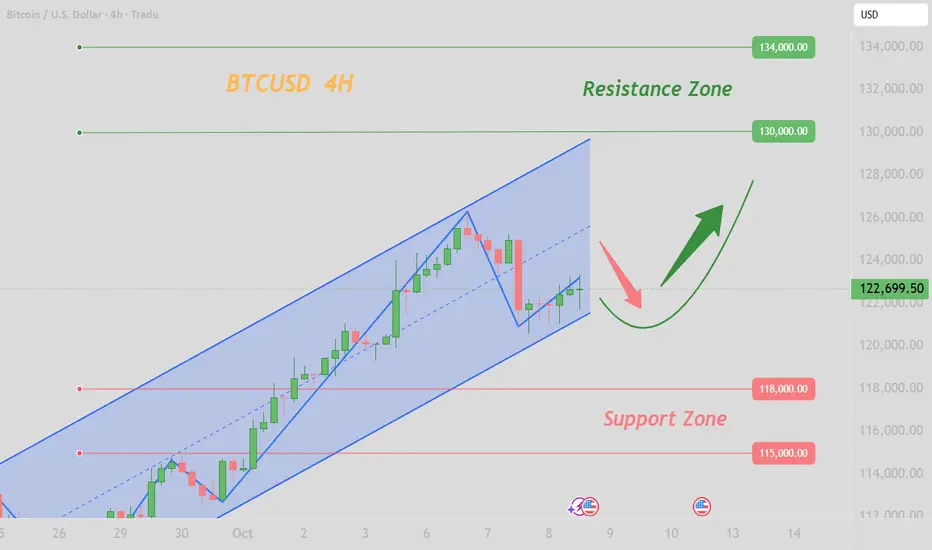
Based on technical analysis, BTCUSDT has made a strong breakout from the descending channel. Currently, Bitcoin is facing strong resistance near the 124,000 USD level. After reaching the peak, the price may correct back to Fibonacci support levels (0.5 - 0.618) before potentially continuing its upward movement.
The next target for BTC is to reach 130,000 USD if the bullish trend continues. The key to achieving this target is for the newly established support to hold, along with a clear confirmation of a candle close above the current resistance zone.
As for me, I remain optimistic. What about you? 💬What do you think about the trend of BTCUSDT? Feel free to leave your thoughts in the comments below.
Good luck!
BTCUSDT

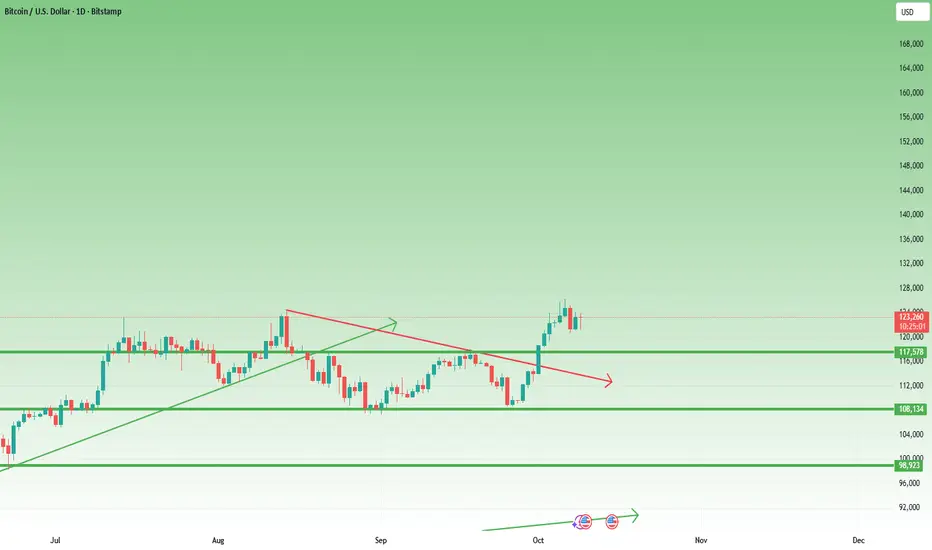
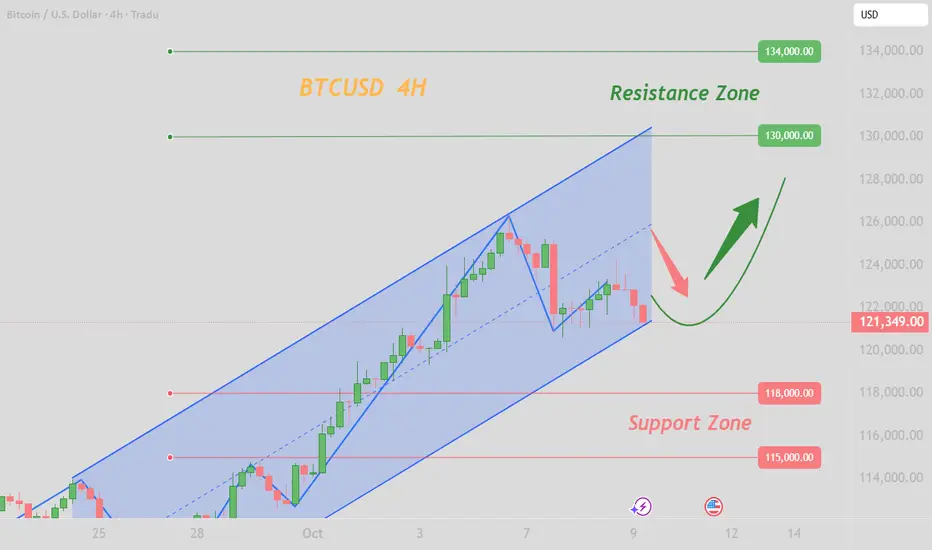
BTCUSD NEXT POSSIBLE MOVE Bitcoin is consolidating near a strong support area where buyers are gradually stepping in. If the price continues to respect this zone, a bullish breakout can be expected.
Market structure remains positive above support, indicating that buyers may soon regain control.

Bitcoin Roadmap Before FOMC Minutes – Correction or New ATH?Today, we have one of the most important macro events — the FOMC Meeting Minutes
Let’s quickly understand what it is and why it could shake the crypto market
What are FOMC Minutes?
They’re the detailed notes from the last Federal Reserve meeting, showing what members discussed about interest rates, inflation, and the economy.
Markets carefully read every line to find hints about future rate cuts or continued tightening.
Why does it matter for Bitcoin?
When the Fed turns dovish (hinting at lower rates), risk assets like Bitcoin usually rally But when the tone is hawkish (worried about inflation), investors move to cash or bonds, causing crypto to dip.
Let’s take a look at Bitcoin ( BINANCE:BTCUSDT ) on the 4-hour timeframe .
Before analyzing the chart, let’s quickly review what defines a strong uptrend :
1-Higher Lows(HL):
Each new low should form above the previous one, showing that buyers are stepping in earlier each time.
2-Higher Highs(HH):
Each new high should be higher than the last, confirming that bullish momentum is still in control.
3-Structure Respect:
The new low should not break below the previous high — if it does, it doesn’t necessarily mean the trend is over, but it indicates a weakening of the bullish structure.
Based on the points above, Bitcoin failed to form a new Higher Low(HL) during the past 24 hours, and the previous high was retested .
These signals indicate a loss of bullish momentum, suggesting that we might see at least a short-term correction from a technical perspective.
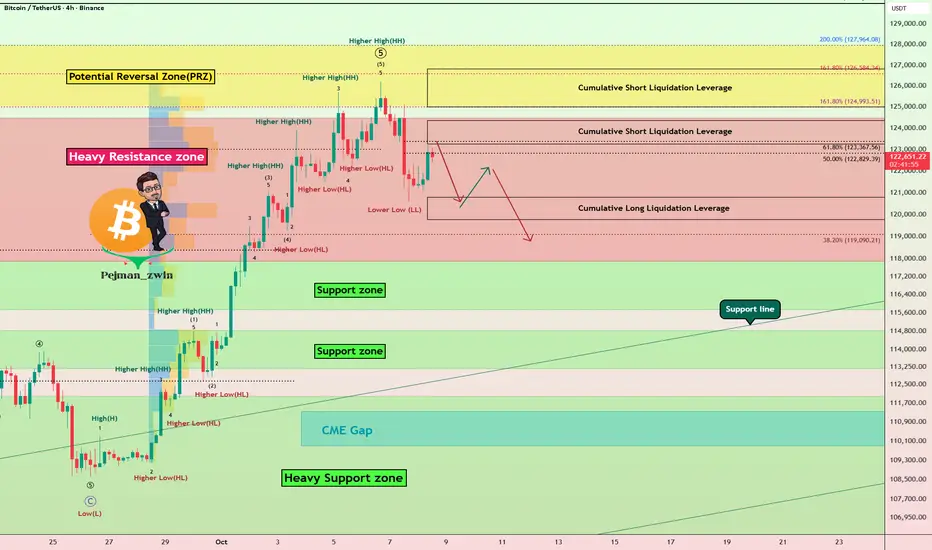
Bitcoin has already started to bounce back nicely from the Potential Reversal Zone (PRZ) and is currently trading in a Heavy Resistance zone($124,474-$117,900) .
In terms of Elliott Wave theory , it seems that with the formation of a Lower Low(LL) , Bitcoin has completed at least a series of impulsive waves , and we can now expect corrective waves .
I expect Bitcoin to drop to at least Cumulative Long Liquidation Leverage($120,779-$119,957) before the FOMC Meeting Minutes start and could continue to rise or correct depending on the tone of the FOMC Meeting Minutes .
Note: You should note that these days, Bitcoin has a higher correlation with the SPX500( SP:SPX ) index than before, so if there is a sudden movement in Bitcoin, one of the reasons could be a sudden movement in the SPX500.
Do you think this bullish move could lead to a new all-time high (ATH) for Bitcoin again!?
Cumulative Short Liquidation Leverage: $124,350-$123,244
Cumulative Short Liquidation Leverage: $126,813-$125,000
CME Gap: $111,355-$109,915
Please respect each other's ideas and express them politely if you agree or disagree.
Bitcoin Analysis (BTCUSDT), 4-hour time frame.
Be sure to follow the updated ideas.
Do not forget to put a Stop loss for your positions (For every position you want to open).
Please follow your strategy and updates; this is just my Idea, and I will gladly see your ideas in this post.
Please do not forget the ✅' like '✅ button 🙏😊 & Share it with your friends; thanks, and Trade safe.
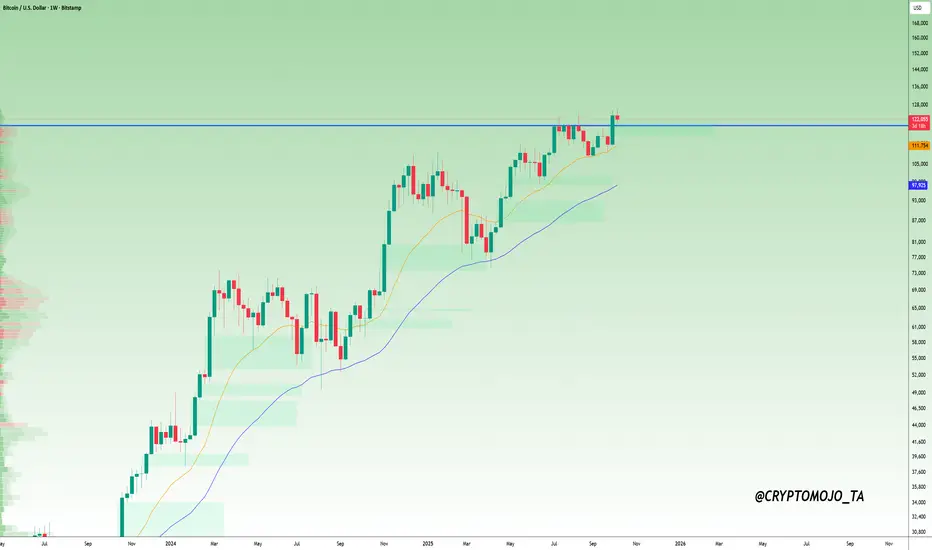
Bitcoin STRONG Weekly Bounce - What's Next?Hello BTC Watchers 📈
📢 Bitcoin was trading right on top of a crucial support zone. But the price has successfully bounced in the weekly and made a strong comeback from the support zone.
The weekly moving averages
The daily moving averages
This is telling for a number of reasons. In the weekly we see a strong bounce above the moving averages as well as in the daily, and in the daily we had just bounced back from a correction which took us to the 100d MA (which is the general zone for a correction, or at least a wick towards that area. This indicate that in the short and longer term, the chart is looking up and bulls are in control.
What are you thoughts, new ATH or just a fakeout?

TradeCityPro | Bitcoin Daily Analysis #191👋 Welcome to TradeCity Pro!
Let’s get into Bitcoin analysis. The market is still in a ranging phase, so let’s take a look at today’s triggers together.
⌛️ 1-Hour Timeframe
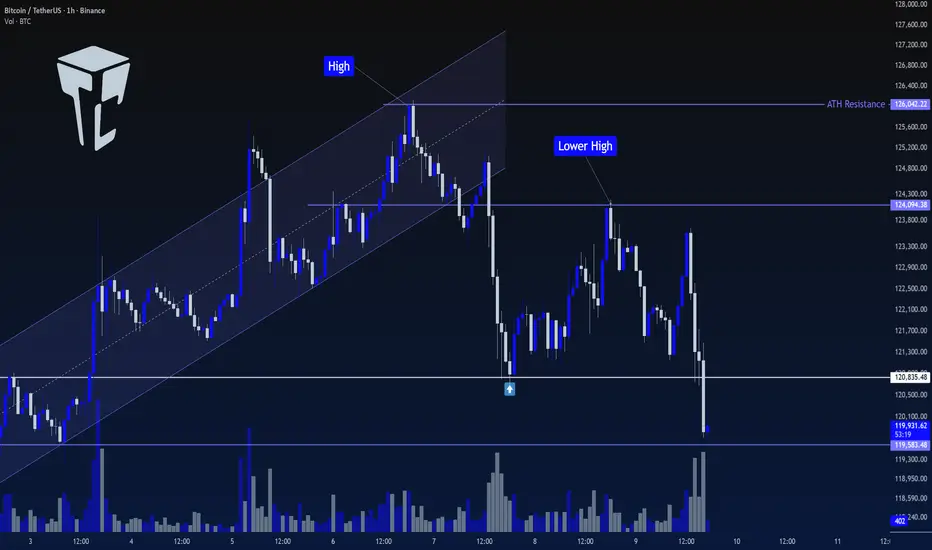
In this timeframe, Bitcoin is still consolidating and has formed a new range high around 124,094.
✔️ Right now, the price is near the bottom of the range box it has created and is on the verge of breaking below it.
✨ If the bottom of the box breaks, price could move toward lower levels.
📊 If selling volume continues to increase, the downward move could extend further, and Bitcoin may correct to even deeper zones.
🎲 However, if this move turns out to be a fake breakdown, and we see reversal structures such as a V-pattern, we could look for a long trigger.
🔑 I still don’t see Bitcoin as being in a downtrend. In my view, every correction the market makes is still healthy and supports the continuation of the broader bullish structure, helping maintain the strength of upcoming legs.
⭐ For now, since momentum has turned bearish on the lower cycles, I don’t have any new triggers to give based on my strategy. In this phase of the market, I prefer to wait until price builds more structure.
❌ Disclaimer ❌
Trading futures is highly risky and dangerous. If you're not an expert, these triggers may not be suitable for you. You should first learn risk and capital management. You can also use the educational content from this channel.
Finally, these triggers reflect my personal opinions on price action, and the market may move completely against this analysis. So, do your own research before opening any position.
BTC: In a weak consolidationCurrently, BTC is in a weak consolidation phase following a pullback. After touching an intraday low of 120,804.39, it rebounded sharply, indicating that the 120,800-121,000 range has short-term buying support. This level is close to the upper edge of the previous consolidation platform at 120,500 and forms a joint support zone with the key concentrated price level of 120,000 in the options market. However, the current price of 121,000 is still on the edge of the support level, and no clear stabilization signal has been formed yet.
Buy 120000 - 120500
TP 121000 - 121500 - 122000
SL 119500
Daily-updated accurate signals are at your disposal. If you run into any problems while trading, these signals serve as a reliable reference—don’t hesitate to use them! I truly hope they bring you significant assistance
Bitcoin Outlook: Structure Intact, 140K Still on the TableIn my previous BTC analysis, I mentioned that a new all-time high was almost a certainty, with potential for a new leg up toward 140K–150K.
Indeed, BTC delivered — printing a fresh ATH, followed by a short and healthy correction.
At the time of writing, the price has reversed from just above 120K, showing strong demand.
Today’s daily candle displays a long lower tail, a clear sign of buying pressure, and could easily close as a continuation Pin Bar — signaling that bulls are still in control.
Key Zone to Watch
118K support – remains the line in the sand.
As long as this level holds, bulls have no reason for concern and the “buy the dips” strategy stays valid.
Outlook
Momentum remains bullish, structure remains intact, and the path toward 140K stays open — until proven otherwise. 🚀
$BTC is heading towards a parabolic expansion phase.Bitcoin once again formed a “higher low” (HL) in its long-term uptrend, showing a strong reaction from the demand zone.
It tested the last supply zone at $124,5k and was rejected. Sustained movement above this zone will trigger the start of a parabolic expansion phase.
The trend's direction is clear higher lows, higher highs.

BTCUSDT.P SHORTBTCUSDT.P SHORT
The market has the potential for an downtrend
Price: 121264.0 $
Main target 119632.0 $
SL 124299.0

BTC: Three-stage trajectorToday's BTC market shows a pattern of high-level consolidation with a pullback, characterized by a three-stage "surge - retracement - consolidation" trajectory. In the early session, it attempted to break through the 124,000 resistance level but failed. Subsequently, it pulled back to around 121,000 to seek support, and later, a bull-bear tug-of-war unfolded within the 122,000 range.
Close attention should be paid to the October 15 deadline for the U.S. government shutdown (Polymarket predicts a 56% probability of it lasting until that date). If the shutdown is extended, leading to further delays in ETF approval, Bitcoin may retrace below 120,000, and in extreme cases, test the support level at 118,000.
The current market is suitable for a "low-leverage + position-splitting strategy": Holders can set 121,000 as the trailing stop level. Given that the current support level has moved upward and trading volume has not contracted, the stop-loss range can be appropriately widened. On the other hand, observers may wait for the price to stabilize above 123,600 or for signs of stabilization with reduced volume after retracing below 120,500 before considering entry, avoiding chasing gains or selling in a panic within the consolidation range.
Buy 121000 - 121500
TP 122000 - 122500 - 122300
SL 120000
Daily-updated accurate signals are at your disposal. If you run into any problems while trading, these signals serve as a reliable reference—don’t hesitate to use them! I truly hope they bring you significant assistance
#Bitcoin Weekly Update !!#BTC UPDATE
#Bitcoin has printed a new weekly high, confirming the ongoing strength of the broader uptrend. Both the 21 EMA (yellow) and the 55 EMA (green) are trending upward, indicating that medium-term momentum remains bullish.
The key structural level to focus on is the former weekly resistance around $120,000, which Bitcoin has successfully broken above. As long as the price holds above this level on a closing basis, the bullish bias will remain intact.
If the breakout holds, the next potential target lies in the mid-$130K range.
However, if Bitcoin closes below $120,000, the move would be neutralized, potentially opening the door for a retest of the EMAs in the $112K–$114K zone.
For now, both the trend structure and EMAs suggest that the continuation of this bullish trend is likely.
Trading Psychology Bias Lesson: BTCUSD 1D ATR Position SizeSummary
Bias shifts judgment under stress and often decides outcomes before the order ticket. This idea converts trading psychology into rules you can apply on BTCUSD now. It uses fixed ATR stops, pre defined entries and exits, a written disconfirming note before any order, and decision grades based on rule adherence. The goal is tighter drawdowns and consistent execution across regimes.
Live context
Price 123,102
SMA 50 114,314
EMA 200 106,289
ATR 14 daily 2,882.52 which is 2.34% of price
Distance to SMA 50 is 8,788 which is 7.14%
Distance to EMA 200 is 16,813 which is 13.66%
2 x ATR equals 5,765.04 which is 4.68%
Why psychology decides the trade before entry
Real trading includes noise, limited attention, and emotion. The result is bias, a stable tendency that pulls choices away from the written rule. Bias creeps into 4 moments: setup definition, entry trigger, position size, exit and review. The fix is structure. Use 5 blocks: a 1 sentence setup, entry and stop and trail defined with ATR, a written disconfirming note, a higher timeframe check, and a post trade grade by rule adherence rather than outcome.
Theory. Core biases you must neutralize
Loss aversion . Loss pain exceeds gain pleasure and leads to widening stops or cutting winners early. Fix . Initial stop equals 2 x ATR. Trail equals 1 x ATR or a close through a moving reference. Never widen stops.
Confirmation bias . You search for evidence that agrees with your idea. Fix . Write 1 disconfirming fact before any order. Check the next higher timeframe. If it disagrees, cut size by 50% or skip.
Anchoring . You fixate on entry or a round level. Fix . Define exits on structure with ATR or a moving average close. Name the anchor in notes to reduce its pull.
Recency and availability . You overweight the last 1 to 3 candles. Fix . Use a 20 bar context rule and a weekly system review.
Overconfidence . After a win trade count and size increase without any change in edge. Fix . Cool down 2 minutes after every exit and halve next size after a large winner.
Herd and gambler’s fallacy . Late entries on wide candles and belief that streaks must continue or must reverse. Fix . Only take trades with projected reward to risk at least 2 to 1 at the planned stop and avoid high impact events.
Hindsight and outcome bias . You judge by result and rewrite rules after 1 loss. Fix . Save entry and exit screenshots and grade by rule adherence.
Status quo and endowment . You sit in positions you already own while better setups exist. Fix . Monthly retest of every holding against current rules.
Three guardrail rules for BTCUSD
Stop discipline. Initial stop equals 2 x ATR. Trail winners by 1 x ATR or by a daily close through SMA 50. Do not widen stops.
Decision hygiene. Before every order write 1 disconfirming fact and check the next higher timeframe. If the higher timeframe disagrees, cut size by 50% or skip.
Quality floor. Projected reward to risk is at least 2 to 1 at the initial stop distance.
BTCUSD 1D continuation plan with exact math
This plan assumes a breakout continuation and uses your live ATR 14. All digits are based on ATR 2,882.52 and a price above SMA 50 and EMA 200.
Setup in 1 sentence . Trend continuation long on a daily close above the recent swing with SMA 50 rising and 20 bar context bullish.
Entry trigger . Close above 124,200 confirms continuation.
Initial risk . 2 x ATR equals 5,765.04. Stop equals entry minus 5,765.04. For 124,200 the stop is 118,434.96.
Targets . 1R target equals entry plus 5,765.04 which is 129,965.04. 2R target equals entry plus 11,530.08 which is 135,730.08.
Sizing example . Equity 20,000. Risk per trade 1% equals 200. Position size equals risk divided by stop distance which is 200 ÷ 5,765.04 equals 0.0347 BTC. Notional at 124,200 is about 4,308.
Management . Trail by 1 x ATR which is 2,882.52. Move the stop only with the trail. Ignore the first single red candle to reduce recency effects.
Exit logic . Exit on a daily close below the 1 x ATR trail or use a time stop after 12 bars if 2R is not reached.
Journal cue . Before entry write 1 disconfirming fact. After exit save 2 screenshots and grade by rule adherence.
Why each step neutralizes bias in real time
Loss aversion is capped because the stop distance is fixed by ATR and never widened. The trail is mechanical.
Confirmation is checked by the written disconfirming fact and the higher timeframe review that can force a skip or a 50% position cut.
Anchoring is reduced because exits reference ATR and structure instead of entry or round numbers.
Recency is filtered by the 20 bar rule and by a weekly system review that ignores single outcomes.
Overconfidence is constrained by a 2 minute cool down and 50% next size after a large winner.
Mean reversion companion inside an uptrend
Use this only while SMA 50 and EMA 200 slope up and price trades above both averages.
Context . Pullback forms inside the 20 bar range toward short term support while SMA 50 rises above EMA 200.
Entry . Bullish rejection from a prior swing zone or a daily close back above the intraday pivot after a 2 to 3 day pause.
Risk . Initial stop equals 1.5 x ATR which is 4,323.78.
Sizing . Risk per trade 1%. Position size equals risk divided by 4,323.78. With equity 20,000 and risk 200 the size equals 0.0463 BTC.
Exit . First scale at 1.5 R. Stop to break even only after a daily close above SMA 50. Final exit at 2 R or on a daily close back into the pullback range.
Bias note . Write 1 anchor you feel and 1 disconfirming fact that would cancel the setup.
Decision checklist to paste into chart notes
Setup in 1 sentence written before entry
Entry level, initial stop, trail method defined
1 disconfirming fact written and verified
Higher timeframe checked and size adjusted if needed
Projected reward to risk is at least 2 to 1
Screenshots saved at entry and exit
Decision grade recorded by rule adherence
Position size rule you can audit weekly
Account equity E. Risk per trade equals 1% of E by default.
Stop distance equals the ATR multiple from the plan.
Position size equals risk divided by stop distance. If required size is not tradable, skip the trade.
Bias symptoms you will see on the BTCUSD chart and the fix
Loss aversion . Stops drift lower while price falls. Winners are cut early. Fix . 2 x ATR hard stop and 1 x ATR trail.
Confirmation . Indicators are added until they agree with your view. Fix . 1 written disconfirming note and a higher timeframe check.
Anchoring . Waiting to exit when price returns to entry or to a round level. Fix . Structure based exits and naming the anchor in notes.
Recency . Judgment based on the last 2 candles. Fix . 20 bar context rule and a weekly system review.
Overconfidence . Trade count jumps after a win. Fix . 2 minute cool down and 50% next size after a large winner.
Herd and gambler’s fallacy . Late entries on wide candles and streak thinking. Fix . 2 to 1 minimum reward to risk and a news ban during known high impact windows.
Hindsight and outcome bias . Rewriting rules after 1 result. Fix . Grade by rule adherence and keep entry plus exit screenshots.
Status quo and endowment . Sitting in flat positions you already own. Fix . Monthly retest of every holding against current rules.
Worked example with our numbers
Assuming a daily close above 124,200 triggers the continuation. Initial stop equals 2 x ATR which is 5,765.04. Stop equals 118,434.96. 1R target equals 129,965.04. 2R target equals 135,730.08. Equity equals 20,000. Risk equals 200. Position size equals 0.0347 BTC. As price advances you trail by 1 x ATR which is 2,882.52 and you move the stop only when the trail shifts. If the trail is hit you exit. If 12 bars pass without the 2R target you exit on time and log the decision. You do not widen the stop. You do not add size after a win. You grade the decision by rule adherence.
If momentum stalls
If a daily close rotates down toward 121,000 to 121,500 and momentum weakens, shift to neutral. Wait for a fresh setup that passes the 2 to 1 test at the planned stop.
Do not react to a single candle. The plan lives on the daily chart.
Comparator and scorecard
Use simple Buy and Hold on BTCUSD as the baseline. Score the plan by Return divided by Drawdown, Max Drawdown, and percent of trades executed exactly as written. A smaller drawdown with steady execution beats a higher raw return with poor adherence. Your best forward indicator is the discipline metric you log each week.
Education and analytics only. Not investment advice. Test any rule with historical data before risking capital.

BTC Short-Term 1H🔹 General Context
On the chart, we see that Bitcoin:
Has broken the local downtrend line (yellow line), suggesting an attempt to change the short-term trend.
It is currently consolidating just above the 50/200 EMA, which is a positive sign for bulls.
We also see a MACD crossover in the positive zone and an RSI rising, but not yet overloaded (around 52–60).
🔸 Key Technical Levels
Support:
122.460 USDT – strong local support, aligned with previous lows and the 200 EMA.
121.900 USDT – next support, also marked by the blue 200 EMA.
120.600 USDT – deeper support, recent significant low.
Resistance:
123,700 – 123,900 USDT – resistance zone where the price is currently stalling (there was a reaction after the trendline breakout).
124,700 USDT – next resistance level (local high).
125,700 USDT – strong resistance resulting from previous swing highs.
🔸 Technical Indicators
📈 EMA 50/200 (golden cross on 1 hour):
The 50 EMA is breaking below the 200 EMA – a classic bullish signal (Golden Cross).
Confirmation requires the price to stay above 122,800 USDT for several H1 candles.
📊 MACD:
The histogram has turned positive, the MACD line is breaking above the signal line – momentum is increasing.
There is no strong negative divergence yet, so the signal is clear.
💪 RSI:
Value ~52–60 – moderately bullish.
It is not overbought yet, so there is potential for further upward movement.
🔹 Scenarios
✅ Bullish Scenario:
Sustainability above 122,800 USDT.
A breakout and retest of the 123,700–123,900 USDT resistance could open the way to 124,700 USDT and then 125,700 USDT.
The MACD and RSI support this scenario.
❌ Bearish Scenario:
A reversal from the current level and a decline below 122,400 USDT.
A retest of 121,900 USDT and a possible deepening correction to 120,600 USDT is possible.

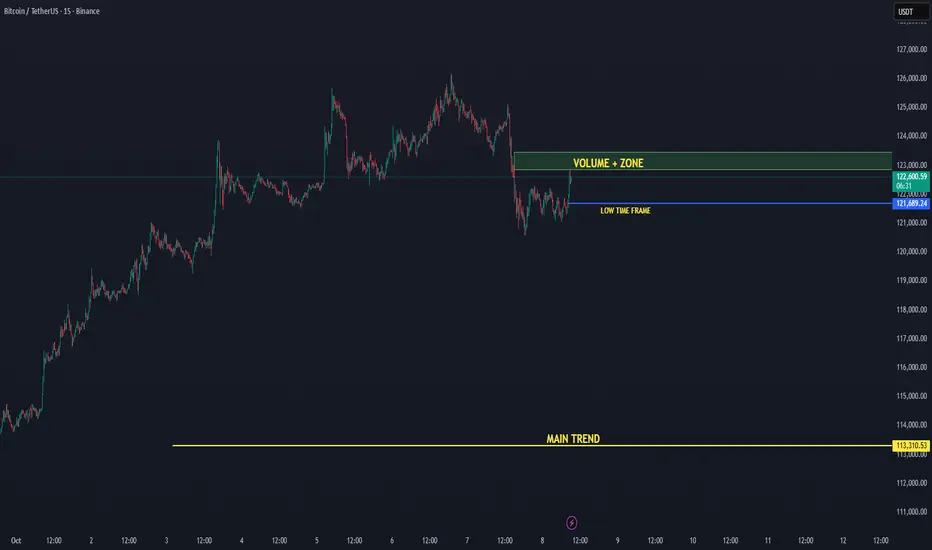
BTC/USDT — Low Time Frame Recovered, Eyes on Volume 08-10-2025Bitcoin has reclaimed its low time frame level near $121.6K, signaling renewed short-term strength. Price is now pushing upward toward the +Volume Zone, an area where increased buying activity could trigger a breakout continuation.
📈 Low Time Frame Reclaimed: BTC has stabilized above the local structure, confirming short-term bullish momentum.
🔊 Volume Zone Target: The next resistance sits around $123K, where increased trading activity could accelerate a move higher.
🟢 Main Trend Active: The primary uptrend remains strong as long as BTC holds above the $113K main trend support.
Technical Levels:
🟢 Main Trend Support: $113K
🟡 Low Time Frame Support: $121.6K
🔊 Volume Zone Resistance: $123K
🎯 Next Target: $125–$126K
Outlook:
Bitcoin is showing healthy recovery momentum, reclaiming short-term structure and heading into the Volume Zone. If it sustains above $121.6K and breaks $123K with volume confirmation, a continuation toward $125K+ becomes likely.
📊 Bias: Bullish continuation
📈 Focus: Volume reaction at $123K

TradeCityPro | Bitcoin Daily Analysis #190👋 Welcome to TradeCity Pro!
Let’s dive into today’s Bitcoin analysis. The market, after experiencing a decline, is now ready to resume its primary bullish trend.
⏳ 1-Hour Timeframe
Yesterday, after Bitcoin confirmed a break below the channel, it retested the channel and activated the trigger at 123493, leading to a brief bearish movement.
📊 The first support zone was 122574, but the price didn't react to it, resulting in a break below. The next key support zone was 120835, where the price reacted and formed a low.
✨ After the price found support at 120835, a peak formed at 122084, creating a compression between 120835 and 122084.
📈 Currently, after breaking above the compression range, a bullish movement has started, and the price has reached back above 123491.
⚡️ The good thing about the correction to 120835 is that many long positions that hadn’t taken profit were now closed, reducing selling pressure in the market. This provides Bitcoin a chance to continue its bullish trend with a more structured approach.
🚀 However, if the price fails to break the previous high of 126042, a lower high would form, which is a sign of weakness in the bullish trend.
🎲 If that happens, and if the price stabilizes below 120835, we’ll get confirmation of a bearish shift in this timeframe. But for now, this hasn’t happened, and the market momentum remains bullish.
🔍 For a new position, if you haven’t opened a position after breaking 122084, there is no valid trigger at the moment, and we should wait for the market to create a proper structure for entry. Otherwise, the only trigger we have right now is breaking 126042.
🔽 For a short position, I am waiting for the trend change scenario to unfold before considering any short triggers.
❌ Disclaimer ❌
Trading futures is highly risky and dangerous. If you're not an expert, these triggers may not be suitable for you. You should first learn risk and capital management. You can also use the educational content from this channel.
Finally, these triggers reflect my personal opinions on price action, and the market may move completely against this analysis. So, do your own research before opening any position.

Bitcoin Cup and Handle Pattern!BTCUSDT technical analysis update
BTC is forming a cup and handle pattern on the weekly chart. The price is currently forming the handle, which could take 1-2 months to complete. Once the price breaks the neckline, we can expect a significant bullish move in BTC.
Regards
Hexa

BTC:Caution should be exercisedIn early trading today, Bitcoin briefly surged to a high level before plunging sharply, and finally stabilized with fluctuations around the 122000 mark.
The 125000-126000 range is a cluster of previous highs, is rife with a large number of trapped positions and profit-taking positions. Sustained expanded trading volume is required to achieve an effective breakthrough, and it will be quite challenging to break through in the short term.
Caution should be exercised regarding the impact of factors such as a leverage liquidation wave, a policy shift at the Federal Reserve's December FOMC meeting, and increased volatility amid the high valuation of global cryptocurrencies on the trend.
Buy 121100 - 121500 TP 122000 - 122500 - 123000
Daily-updated accurate signals are at your disposal. If you run into any problems while trading, these signals serve as a reliable reference—don’t hesitate to use them! I truly hope they bring you significant assistance
Elliott Wave + Gartley Harmonic: Why Bitcoin May Correct Soon!?Bitcoin( BINANCE:BTCUSDT ) has shown strong bullish momentum over the past week, climbing nearly +10% and testing key resistance zones . Several fundamental and technical factors fueled this rally.
Key Drivers of the Rise:
ETF inflows – Significant net inflows into spot Bitcoin ETFs boosted demand.
Macro uncertainty – U.S. government shutdown risk and weaker job data supported risk assets.
Monetary policy – Expectations of softer Fed policy improved market sentiment.
Derivatives impact – Options expiry, high OI, and short squeezes added upward pressure.
Exchange outflows – Lower BTC supply on exchanges signaled accumulation.
Positive sentiment – “Uptober” narrative and bullish analyst targets lifted confidence.
-------------------------------------------
Now, if we look at the Bitcoin chart in the above timeframes from a technical analysis perspective , we can see the following:
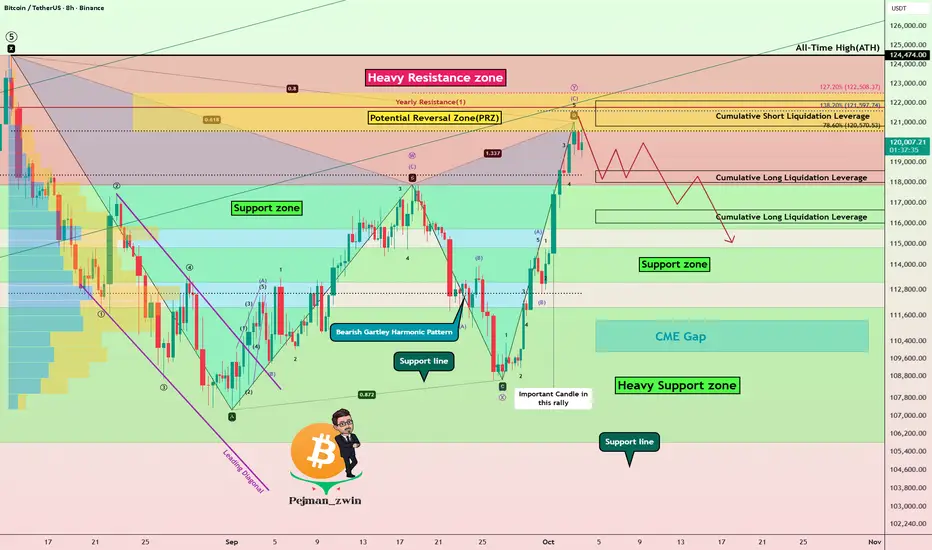
First of all, let me say that the rally that Bitcoin has had over the past 7 days has NOT been accompanied by high volume, and this is not good news for Bitcoin to create a new All-Time High(ATH) .
Bitcoin is entering a Heavy Resistance zone($124,474(ATH)-$117,900) and is moving near the Potential Reversal Zone (PRZ) and Cumulative Short Liquidation Leverage($122,120-$120,823) .
In terms of Elliott Wave theory , Bitcoin appears to be completing a microwave C of the main wave Y . One of the reasons I saw the waves as corrective , other than the microwaves, was the low volume of Bitcoin in the past 7-day rally .
If we look at the Bitcoin chart from a pattern perspective , the important Bearish Gartley Harmonic Pattern is also well and standardly defined on the chart, such that point D in the PRZ can be completed. The Gartley Harmonic Pattern is the most important pattern among the harmonic patterns .
I DO NOT expect a new ATH formation for Bitcoin in this rally due to the above reasons, and I expect it to at least decline to the Support zone($114,820-$113,180) .
Note: Important prices to watch for if Bitcoin reverses (in order of importance of volume): $118,400-$112,700
Note: You should note that these days, Bitcoin has a higher correlation with the SPX500( SP:SPX ) index than before, so if there is a sudden movement in Bitcoin, one of the reasons could be a sudden movement in the SPX500.
Educational Tip : The volume of each candle is considered to be the identity and credibility of that candle, and you can find these candles with the help of volume candle charts.
Cumulative Long Liquidation Leverage: $118,583-$118,000
Cumulative Long Liquidation Leverage: $116,652-$116,000
CME Gap: $111,355-$109,915
Stop Loss(SL): $125,00(Worst)
Please respect each other's ideas and express them politely if you agree or disagree.
Bitcoin Analysis (BTCUSDT), 8-hour time frame.
Be sure to follow the updated ideas.
Do not forget to put a Stop loss for your positions (For every position you want to open).
Please follow your strategy and updates; this is just my Idea, and I will gladly see your ideas in this post.
Please do not forget the ✅' like '✅ button 🙏😊 & Share it with your friends; thanks, and Trade safe.
Bitcoin has only just begun its new run.CRYPTOCAP:BTC is repeating its upward cycle once again on the weekly chart.
The structure that brings rises exceeding 90% at every major momentum shift is becoming active again.
The current +17% level is only the first step of similar phases in the past.
The rhythm is the same, the energy is reawakening.

Join me for a big profit by buying the GBPNZD.
Hi desrs
What a great time to be looking at the GBPNZD chart. It's just the beginning of a big move. I think we should see the pound strengthen over the next two years.
If you like my analysis, just follow my page.


Bitcoin Strategic Outlook: Macro and Technical SummaryMacroeconomic Context
Global liquidity is rising again. Over 50 rate cuts across G-20 economies, combined with China’s multi-trillion-yuan stimulus, have added roughly US $5 trillion to global liquidity this year. The world has entered an easing cycle, supporting risk assets.
The U.S. Federal Reserve has started cutting rates but remains cautious: strong fiscal spending on AI infrastructure and tight labor markets could reignite inflation. Analysts expect a pause in early 2026 if price pressures return. Real rates and Fed communication remain the key variables for traders.
Early-Cycle Momentum & Dollar Weakness
Global growth sits in an early-cycle phase. Manufacturing softness contrasts with steady service demand, while fiscal dominance—large government spending—keeps nominal growth near 3 %. Liquidity injections from China and other markets stabilize collateral values and suppress volatility. The U.S. dollar has weakened as capital rotates globally; historically, Bitcoin outperforms during dollar downtrends and post-geopolitical shocks, adding a macro tailwind.
Institutional Demand
U.S. spot ETFs continue to reshape supply. BlackRock’s IBIT surpassed US $15 billion in six months, while corporate holders of Bitcoin doubled to 134 firms. ETF and treasury accumulation now absorb most new issuance, muting volatility and creating a structural floor. Exchange outflows are at two-year highs, confirming long-term accumulation by whales and institutions.
Regulation & Policy Clarity
The GENIUS Act (2025) established a U.S. stablecoin framework, and FASB now requires fair-value accounting for crypto. Together with SEC listing standards, these changes reduce uncertainty for large investors. The U.S. shift toward clarity has improved confidence and should sustain institutional inflows.
Technical Overview
After eight months of consolidation, Bitcoin broke to new highs above $100 k. June’s monthly candle formed a bullish pin bar, confirming demand near $102 k. Indicators remain neutral with balanced funding rates.
Key technical levels:
• Resistance $125 k – major sell zone; breakout opens $130 k–$135 k.
• Intermediate $104 k–$100 k – psychological support.
• Strong support $95 k–$90 k – 200-day EMA zone.
Losing $90 k risks a correction toward $82 k–$74 k.
On-Chain and Sentiment
Glassnode data show whales accumulating and exchange balances shrinking. Bitwise and Fidelity both note that ETFs and corporations now hold enough BTC to reduce daily float meaningfully. Market sentiment is bullish but measured—investors expect high volatility yet maintain multi-year confidence.
Expert Consensus
Standard Chartered, Tom Lee, and ARK Invest project $150 k–$200 k by end-2025, citing liquidity growth and adoption. VanEck and long-term macro investors place decade-end targets above $500 k–$1 million. RBC Capital Markets warns that inflation shocks could pause rate cuts; traders should watch CPI and real-yield trends closely.
Strategic Outlook
1–3 months: Range trading $112 k–$125 k. Break above $125 k → $130 k–$135 k target. Below $116 k → test $112 k support.
6–12 months: Liquidity expansion and ETF inflows point to $150 k–$200 k. Best opportunities likely on pullbacks to $95 k–$100 k.
3–5 years: Fixed supply, corporate adoption, and de-dollarization support an upward bias; structural forecasts $500 k–$1 million remain plausible.
Key Takeaways
Global liquidity is the dominant driver—monitor rate cuts and USD trends.
Institutional accumulation provides downside protection.
$125 k resistance defines near-term risk/reward.
Macro risks: renewed inflation, Fed policy reversals, geopolitical shocks.
Conclusion
Bitcoin enters Q4 2025 with a supportive macro backdrop, rising institutional demand, and technically strong structure. The path is volatile, but the long-term narrative of Bitcoin as a scarce, non-sovereign asset remains intact.