BTC long, because ... why not?BTC is "THE" asset against monetary expansion and Powell kind of gave the green light, not for more rate cuts, but he acknowledged that Trump might be "irght" about cutting rates.
Market still price 2 or 3 rate cuts by EOY.
there is no reason BTC does not trade above 120k soon, and why not 144k when we are at it?
H12 200 MA/EMA as a nice inflection point here.
BTCUSDT

Bitcoin’s Next Big Move: Buy the Dip Before $138K!Hello guys!
Bitcoin is once again at a critical stage, and the chart is giving us a clear roadmap for the next move. Let’s break it down:
Current Setup
Price is holding above $108K–109K and has shown strength around the $103K support zone.
The structure remains bullish as long as BTC trades above $100K.
Strategy
1- Entry zones for buying:
Current market price (~$109K)
Support zone around $103K (a good second chance for buyers).
2- Stop-loss: Around $99K, just below the psychological and structural support of $100K.
3- Target: Upside potential points toward $138K , which aligns with the next major resistance zone.
⚠️ Risk Factor
If BTC breaks below $100K, the bullish phase ends, and we should expect a bearish shift in momentum. In that case, caution and defensive trading will be the smarter play.
📌 Conclusion
For now, the play is simple:
👉 Stay bullish and buy dips while BTC is above $100K.
👉 Watch the $103K zone for re-entries.
👉 Protect your capital with a $99K stop-loss.
👉 Aim high-> the next big target sits around $138K.

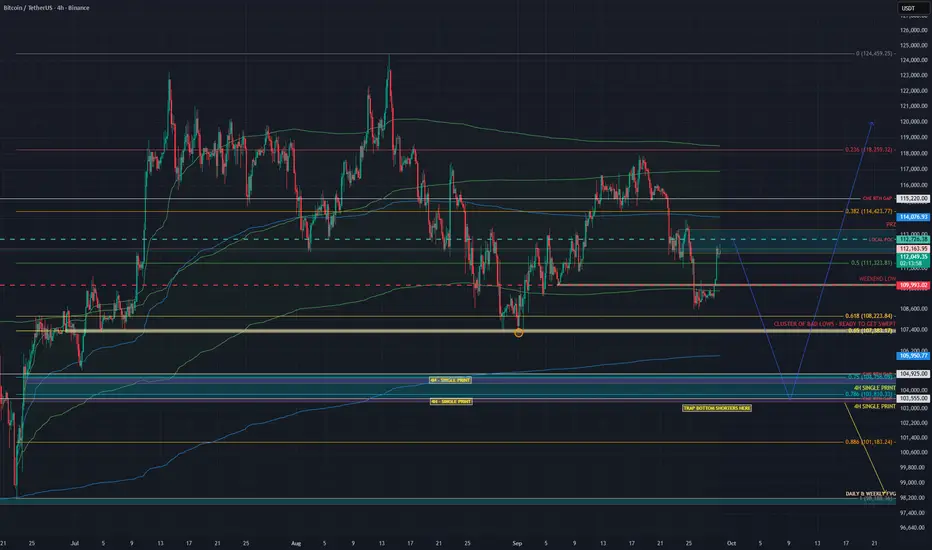
SHORT BITCOIN – THE TRAP IS BELOW, NOT ABOVE!Traders,
From the current levels around $112.8K–$113K, I believe Bitcoin is setting up for another leg down into the $104K region.
Why? Because at current levels we already have multiple Anchored VWAPs (AVWAPs) lining up from different swing high → low auctions, which makes this area heavy resistance.
That means the probability of retracing higher is limited, and instead, the market is more likely to drop into $104K — where there’s significant unfinished business — before a proper bounce can occur.
🔮 Hypothesis
From current levels ($112.8K–$113K), price will reject and move down toward $104K.
Retracement higher than $113K is unlikely given AVWAP confluence + resistance stack.
The $104K region will act as a bounce zone, potentially with a Swing Failure Pattern (SFP) wick.
📊 Data & Confluence
🔻 Why $104K Is a Magnet
HTF Point of Control (POC): The high-volume node where markets naturally seek equilibrium.
HTF AVWAP: Anchored VWAP from major pivots aligns here, marking fair value.
4H TPO Single Prints + Fib Retracements (0.75–0.786): Gaps in auction structure converge with key Fibonacci levels.
CME Gap: The $104K CME RTH gap still needs filling — markets often return here for balance.
Sept 1st Low (Weekly TPO): Poor excess signals unfinished auction business, pulling price back down.
🔼 Why Current Levels Won’t Hold
Clustered AVWAPs (different swing high → low auctions): Acting as strong dynamic resistance.
Multiple POCs at current zone: Volume saturation suggests exhaustion.
Fibonacci confluence + harmonic pattern: Pointing to lower continuation.
💵 Macro Flows
USDT Dominance (USDT.D): Breaking higher → capital shifting to stablecoins → bearish BTC.
Aggregated CVD: Spot CVD drifting slightly higher, but futures CVD flat with no OI expansion.
→ No real demand behind the move.
📌 My Take
Bitcoin is most likely to:
Reject from current AVWAP resistance ($112.8K–$113K).
Drop into $104K, clearing imbalances and luring in shorts below the 0.786 fib.
Trigger a wick/squeeze move up (Swing Failure Pattern) to trap those late shorters.
⚠️ If $104K fails to hold, next target is the imbalance zone around $98.5K.
✅ Conclusion
The market is loaded with resistance at current levels. Until that’s broken with conviction, the path of least resistance is down into $104K.
That’s where the real battle will be.
Trade safe, manage risk, and don’t get trapped on the wrong side of the wick.
Mvrk/usdtGATEIO:MVRKUSDT
### **Support (Demand) Zones**
* **0.0737 – 0.0740** → First strong support (red circle + dotted line).
* **0.0660 – 0.0661** → Secondary support (red dotted line).
* **0.0581 – 0.0600** → Major demand zone (blue box at bottom).
### **Resistance (Supply) Zones**
* **0.0890 – 0.0923** → Nearest supply zone (red dotted lines, multiple rejections).
* **0.1040 – 0.1050** → Stronger resistance (black dashed line).
📌 Quick view:
* Bulls must defend **0.073–0.074** to keep structure intact.
* Breaking **0.089–0.092** could trigger a push toward **0.105**.
Disclaimer : Not Financial Advice

Bitcoin top not is in. We can see that no local peak has yet been observed in terms of the cyclical logarithmic nature of Bitcoin.

$BTC - LTF PlayCRYPTOCAP:BTC | 1h
If we can hold 111k during New York session, I think we can still tag 113.5k (swing point)
We could see a rejection around 113.2-113.5k, though I'm still looking to tag 114.5-114.8k to rebalance (bearish imbalance)

BTC/USDT - BREAKOUT Or BREAKDOWN AHEADThe price is currently trading around the 112,112 USDT level with slight intraday fluctuations. The chart highlights a key horizontal support and resistance (S/R) structure with two red horizontal lines marking these zones.
1. Resistance (R) Zone
The upper red horizontal line, marked as “R,” is acting as a resistance level around the 112,400 USDT region. Price has tested this level multiple times in the recent sessions. A clear breakout above this resistance could signal further bullish continuation.
2. Support (S) Zone
The lower red horizontal line, marked as “S,” is situated around the 111,600 USDT level. This zone has provided a strong demand base for buyers. If the price retraces, this level will act as a critical support.
3. Current Price Action
At the time of observation, Bitcoin is consolidating right above the resistance zone, suggesting a possible breakout attempt. The candlesticks indicate bullish momentum leading into the resistance, with a series of higher lows forming before the test of resistance. This pattern reflects increasing buying pressure.
4. Possible Scenarios
• Bullish Scenario: If the price successfully breaks and holds above the resistance zone (R), it may trigger a move towards the next target to the upside, projected around the 112,800 – 113,200 USDT region. The structure suggests the possibility of forming a bullish continuation pattern, with traders targeting higher resistance levels.
• Bearish Scenario: If the breakout attempt fails and Bitcoin gets rejected at resistance, price could retrace downward. A move below the support zone (S) at 111,600 USDT would likely signal bearish momentum, with the next target projected around the 111,200 – 110,800 USDT range.
5. Market Sentiment
The price action is consolidating in a range-bound structure between support and resistance. This often reflects market indecision before a breakout. A breakout from this range, either above resistance or below support, will provide a clearer directional bias.
⸻
Conclusion:
The BTC/USDT 15-minute chart is currently at a critical juncture. Traders should closely monitor whether Bitcoin sustains above the 112,400 resistance to confirm a bullish breakout, or if it fails and drops back below support at 111,600, signaling bearish continuation. Patience and confirmation of breakout direction are key before entering new trades.

BTCUSDT.P SHORTBTCUSDT.P SHORT
The market has the potential for an downtrend
Price: 111658.3 $
Main target 110156.0 $
SL 114334.0 $

BTCUSDT Review September 29 2025Short-term price movement ideas.
The price reached a weekly Break of Structure (BtS), which was later confirmed on the daily chart, initiating a bearish Order Flow (OF). At the moment, we’ve seen an aggressive bullish reaction that brought price into a daily zone of interest. If this zone receives confirmation on the 4H chart, we can then consider opening short positions with the target of updating the previous low.
Be flexible, adapt to the market, and the results will come quickly. Good luck to everyone.

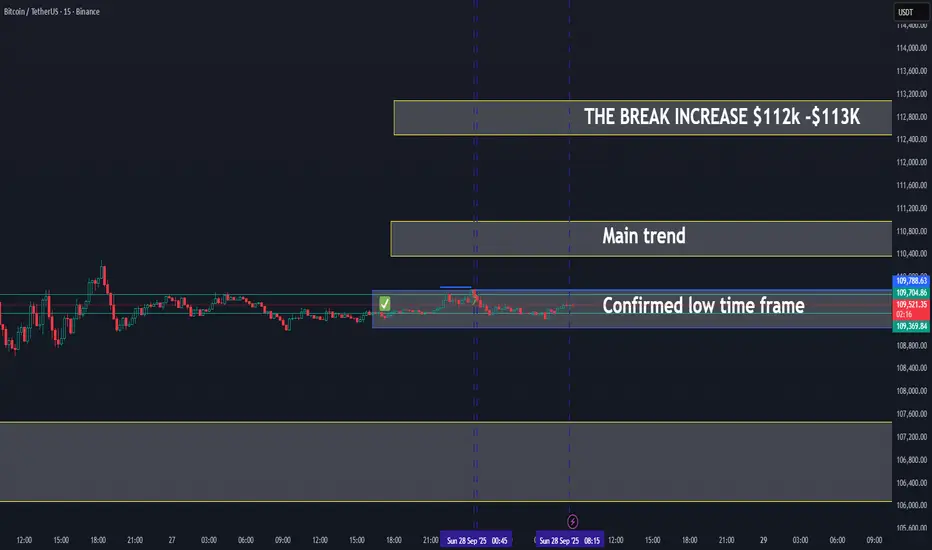
BITCOIN ON WAY TO MAINTREND - UPDATE 28-09-2025📊BTC/USDT Trading Update
✅ Low time frame confirmed: Bitcoin has established support in the $109.3K – $109.7K zone, which now acts as a strong base.
📈 Price is moving toward the main trend zone ($110.8K – $111.5K). This will be the key resistance area to watch.
🔑 Breakout potential:
If BTC clears the main trend zone, momentum could accelerate with the next target around $112K – $113K.
This would confirm a stronger continuation of the short-term uptrend.
Scenarios:
Bullish case: Hold above $109.3K and break $111.5K → expansion toward $112K – $113K.
Bearish case: Failure to break the main trend could lead to sideways action or retest of $109K support.
📌 Summary:
BTC has confirmed its low time frame breakout and is now targeting the main trend zone. A break above this range will likely fuel a push toward $112K – $113K.
#BTCUSDT.P (15m Chart)#BTCUSDT.P
(15m Chart)
🔹️ Bitcoin Futures Analysis 🔹️
✅ Entry Zone: 109,800 – 109,500
❌ Stop Loss: 108,000
🎯 Targets:
🔰 Target 1: 111,000
🔰 Target 2: 111,800
🔰 Target 3: 112,400
🔰 Target 4: 113,600
🔰 Target 5: 114,500
📌 Based on the current conditions of Bitcoin and USDT dominance, I expect a bullish move in the market this week.
📍 This is the setup I expect to play out for Bitcoin.
⚠️ Important Notes:
Keep leverage below 10.
Follow risk management strictly.
Do not place pending orders. I’m monitoring the market myself, and if the entry zone is reached and conditions look good, I’ll announce the entry.
🆔 @Rasoolahmadi

BTCUSDBTCUSD needs sideways for few more days within this month and then will start a push up end of this month or early net month.
Disclosure: We are part of Trade Nation's Influencer program and receive a monthly fee for using their TradingView charts in our analysis.

TradeCityPro | Bitcoin Daily Analysis #182👋 Welcome to TradeCity Pro!
Let’s move on to Bitcoin analysis. Today the weekly candle closes, and from tomorrow the market can start moving again.
⌛️ 4-Hour Timeframe
On the 4-hour chart, Bitcoin has started a downward move from the 117,570 high, dropping in two bearish legs down to the 108,750 zone.
✨ After reaching this area, volume began to decrease—both because the market is ranging and because it’s the weekend.
✔️ Yesterday, in my analysis, I highlighted a range box on the 1-hour chart. This same box is still visible now on the 1-hour timeframe, spanning 108,750 to 109,890.
🧩 Today’s New York session is very important, since this session often drives weekend market moves. So watch the market carefully,our triggers might get activated.
🔑 If strong volume enters today and 108,750 breaks, we can look to open a short position. However, keep in mind there’s an important support area just below this level that could prompt a reaction and halt further decline.
⭐ For a long position, the first trigger we have is a breakout of 109,890. But note that the short-term trend is still bearish, so it’s better to wait for bullish confirmation first. A clean break of 109,890, followed by a higher high and higher low above this level, would be a solid confirmation for a potential upward move.
❌ Disclaimer ❌
Trading futures is highly risky and dangerous. If you're not an expert, these triggers may not be suitable for you. You should first learn risk and capital management. You can also use the educational content from this channel.
Finally, these triggers reflect my personal opinions on price action, and the market may move completely against this analysis. So, do your own research before opening any position.

BTCUSD | Wedge Pattern | 1D🔺 Price Structure: Rising wedge formation unfolding in Elliott Wave count.
🔄 Current Phase: Wave (iv) correction → retesting wedge support.
📍 Demand Zone: $100K – $104K (blue box) = key accumulation area.
📈 Bullish Outlook: Holding support = launchpad for wave (v) rally.
🎯 Target Zone: $140K – $160K (potential ATH breakout).
⚠️ Invalidation: Breakdown below wedge base = structure compromised.
🧠 Mindset: Patience. Precision. Profit.

Bitcoins future...Been playing around and we could be in trouble here if the bottom line of the rising wedge ends up broken.
We could see price levels as low as 1500-2k in worst case scenarios!
Most likely we will go down and test 60k area based on trendlines and resists.
The circles shows a zone/area we can go up and fill to complete the rising wedge.
These times are so exciting so much money can be made if you're watching it closely!

BTC Market Update📊 BTC Market Update
BTC is forming a contracting pattern — price is getting tighter ⚡
This usually means a big move is coming soon 🚀📉
Breakout could happen up or down — stay ready and wait for confirmation before entering.

How to Turn Others Fear and Greed Into your ProfitHave you ever felt opportunities slip away when others sell in fear or buy in greed?
The crypto market is full of emotional moves that can create big profits.
In this analysis, we will learn how to read crowd behavior and benefit from it.
Hello✌️
Spend 2 minutes ⏰ reading this educational material.
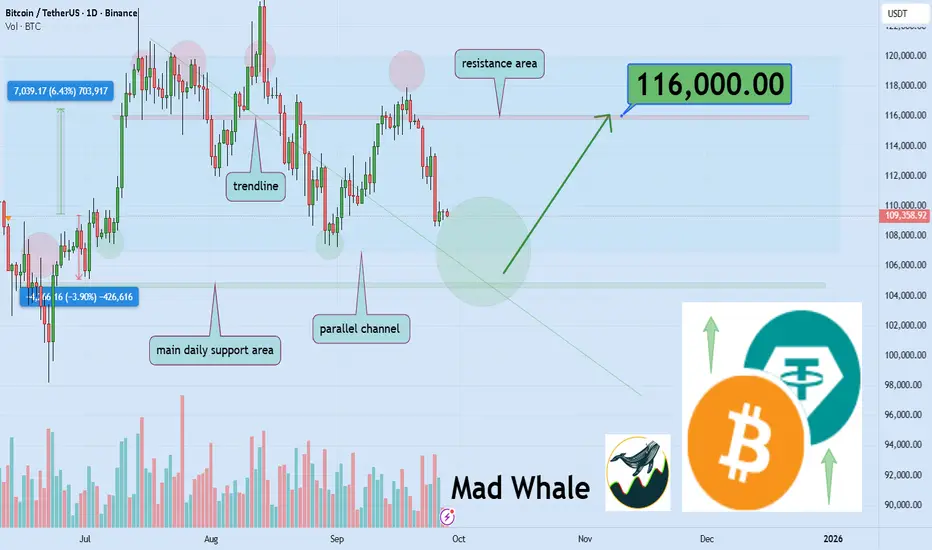
🎯 Analytical Insight on Bitcoin:
Bitcoin is approaching a key daily support and a reliable trendline within a parallel channel, holding which could set up a 6% rally toward 116,000$. Traders should watch this level closely for a potential bounce. 📈🔍
Now , let's dive into the educational section,
🔮 Market Psychology and Crowd Behavior
Crypto is heavily influenced by collective emotions.
FOMO leads to impulsive and irrational buying.
FUD and negative news create fear, pushing prices down.
Recognizing these behaviors reveals trading opportunities.
The goal is to use collective emotions to your advantage.
💡 Practical Tips to Profit from Fear and Greed
Always monitor volume and key indicators.
Use classic patterns like Double Bottom and Bullish Engulfing.
Wait for short-term emotions to settle and the market to stabilize.
Never forget risk management; reserve some capital for market swings.
Avoid making decisions based on crowd emotions alone.
🧠 Individual Psychology and Greed
Understanding your own emotional weaknesses improves decisions.
Success means aligning with crowd behavior without falling victim to emotion.
Others’ fear and greed can become powerful tools for smart profit.
Focused, logical decisions are essential in volatile conditions.
Learning emotional control is the key to long-term success.
📊 TradingView Tools and Indicator
Volume: High volume in a downtrend signals potential buying opportunity.
RSI (Relative Strength Index): Oversold range signals possible price reversal.
Order Book and Level 2 Data: Reveal market pressure from fear or greed.
Sentiment Indicators: Analyze market mood for smarter decision-making.
Moving Averages: Identify strong trends and entry/exit points.
Alerts: Set alerts on critical levels to never miss opportunities.
Drawing Tools: Mark support, resistance, and channels for clarity.
Custom Scripts: Use simple scripts to detect emotional patterns.
📈 Practical Application
When strong market emotions coincide with indicator signals,
Allocate part of your capital for smart profit opportunities.
Simultaneously, manage risk and control your own emotions.
📝 Summary
Others’ fear and greed create golden opportunities.
Analyzing indicators and managing emotions is the key to success.
🌟 3 Powerful Recommendations
Always confirm signals with multiple indicators before acting.
Base decisions on analysis of crowd behavior, not on emotions.
Reserve capital for volatile opportunities while managing risk.
Continuous practice of emotional control is your most important market skill.
✨ Need a little love!
We pour love into every post your support keeps us inspired! 💛 Don’t be shy, we’d love to hear from you on comments. Big thanks , Mad Whale 🐋
📜Please make sure to do your own research before investing, and review the disclaimer provided at the end of each post.
The Bitcoin run isn't over yet. Bitcoin, which began its rise after breaking through the MA7 on a cyclical basis, has continued to experience sharp increases as long as it remains above the MA7, and this trend is still ongoing.

BTCUSDT Bullish or Bearish ?Bitcoin has been consolidating around this level for about three days, forming a potential converging triangle. We won’t predict the direction — if it breaks upward, we’ll go long; if it breaks downward, we’ll go short.
No prediction, just follow.

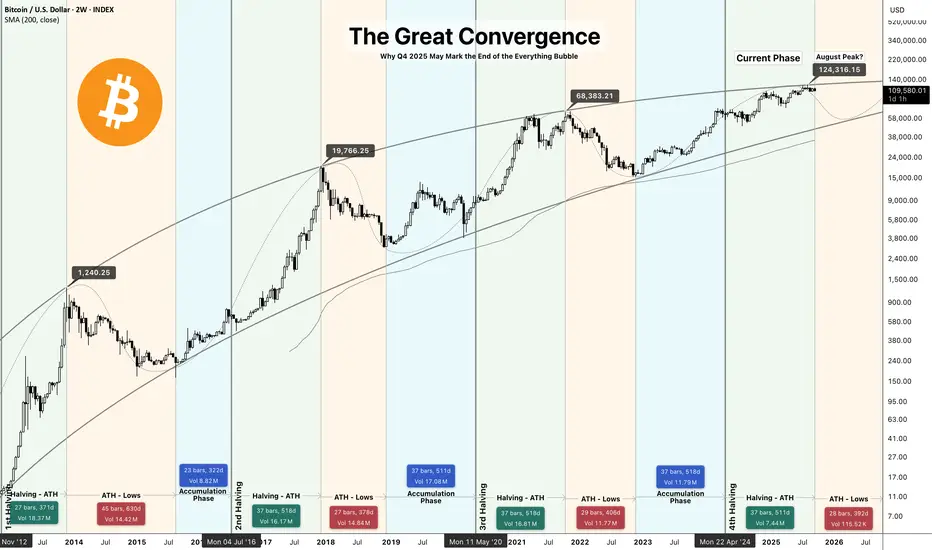
The Great Convergence: End of the Everything BubbleThe Great Convergence: Why Q4 2025 May Mark the End of the Everything Bubble
A Multi-Asset Analysis of Bitcoin, S&P 500, and Gold at Critical Junctures
Hello Traders, After analyzing 25 years of market data across three major financial crises, I've identified a dangerous convergence of signals suggesting we're approaching a significant market inflection point. The simultaneous peaks in IG:BITCOIN (~$124K), SP:SPX (6,700), and TVC:GOLD ($3,790) combined with deteriorating macroeconomic indicators mirror patterns that preceded both the 2000 and 2008 crises.
Key Thesis: We are potentially entering a liquidity crisis that could result in a 30-50% correction across risk assets by Q4 2026.
Part I: The Bitcoin Halving Cycle - End of the Fourth Epoch
Historical Pattern Recognition
CRYPTO:BTCUSD price action has followed a remarkably consistent 4-year cycle tied to its halving events:
2012 Halving → 2013 Peak (1 year delay): +8,000% rise, -85% crash
2016 Halving → 2017 Peak (1.5 years delay): +2,800% rise, -84% crash
2020 Halving → 2021 Peak (1.5 years delay): +700% rise, -77% crash
2024 Halving → 2025 Peak (1.5 years delay): +450% rise, -75% crash projected
Current Technical Indicators
RSI Divergence: Weekly RSI showing lower highs while price makes higher highs - classic exhaustion signal present at 2013, 2021 previous cycle tops.
Volume Profile: Declining volume on recent rallies indicates weakening conviction
On-chain Metrics: Long-term holder distribution accelerating, similar to previous cycle tops
Price Targets
Current Level: $109,498
Proposed Peak: $124,000 (By halving cycle theory this was fulfilled last month August)
Initial Support: $69,000 (previous cycle ATH)
Crisis Target: $25,000-30,000 (75% drawdown from peak by Q6 2026)
Part II: The Macro Crisis Trigger - SPX SP:SPX / Unemployment Rate ECONOMICS:USUR / Fed Rate Correlation ECONOMICS:USINTR
The Historical Precedent
Every major crisis follows a predictable sequence:
2000 Dot-Com Bubble:
CBOE:SPX at ATH (1,550) ✓
Unemployment begins rising from 3.9% ✓
Fed initiates rate cuts ✓
→ 49% crash over 2.5 years
2008 Financial Crisis:
TVC:SPX at ATH (1,576) ✓
Unemployment rises from 4.4% ✓
Fed cuts rates aggressively ✓
→ 57% crash over 1.5 years
2025 AI/Everything Bubble:
TVC:SPX at ATH (6,700) ✓
Unemployment rising from 3.4% ✓
Fed just initiated cuts (Sept 2025) ✓
→ Projected 35-45% correction over 1.5 years
The Unemployment-Rate Cut Death Cross
Since 1970, whenever the Fed has cut rates while unemployment is rising from cycle lows:
12/12 times resulted in recession within 12 months
Average equity drawdown: 35%
Average duration: 18 months
Current Labor Market Dynamics - The AI Disruption Factor
Unlike previous cycles, we face structural unemployment pressure from AI adoption:
Customer service: 2M jobs at risk
Software development: 500K jobs transitioning
Logistics/Transport: 3M jobs being automated
Administrative: 4M jobs under pressure
This isn't temporary cyclical unemployment - it's structural displacement requiring economic reorganization.
Part III: Gold's Crisis Pattern - The Liquidation Before the Flight
Historical TVC:GOLD Behavior in Crisis
Contrary to popular belief, FX:XAUUSD can and does suffer fast flushes during systemic liquidity panics despite its long-term hedge role; with gold near ATH, combined liquidity and profit-taking risk could produce a 15–25% correction ahead of any later safe-haven rally:
2000 Crisis:
Pre-crisis peak: $326
Initial drop: -21%
Bottom-to-recovery: +650% over 11 years
2008 Crisis:
Pre-crisis peak: $1,033
Initial drop: -34%
Bottom-to-recovery: +180% over 3 years
Covid-19 Pandemic:
Pre-pandemic peak: $1,696
Initial drop: -15%
Bottom-to-recovery: +43% over 2 years and 160% over 5 years
Some will point to 2020, when gold rallied during the COVID crash. But that was a unique exogenous shock: the selloff lasted only weeks before unprecedented stimulus and collapsing real yields drove gold to new highs. In contrast, financial‑system crises like 2000 and 2008 forced gold into a year‑long correction before its hedge role reasserted. The 2025 setup looks far closer to those financial crises than to 2020’s pandemic shock.
2025 Projection:
Current peak: $3,790
Expected initial drop: -20 to -25%
Target bottom: $3,000-$2,800
Long-term recovery target: $6,500+ by 2030
Why Gold Falls Initially
During liquidity crises, investors sell everything to meet margin calls and raise cash - even safe havens. Only after the acute phase does gold fulfill its hedge role.
Part IV: The Convergence - Why This Time Is Particularly Dangerous
Unique Risk Factors in 2025
1. Unprecedented Valuations Across All Assets
Total global asset values: $450 trillion (4.5x global GDP)
Buffett Indicator: 195% (highest ever)
Shiller CAPE: 38 (higher than 1929)
2. Leverage and Derivatives
Total derivatives notional: $700 trillion
Margin debt: $935 billion (record high)
Corporate debt/GDP: 85% (record high)
3. Geopolitical Tensions
Active conflicts affecting supply chains
De-dollarization accelerating
Energy market fragmentation
4. Cryptocurrency Systemic Risk
$2.5 trillion COINBASE:BTCUSD and over $4T gross crypto CRYPTOCAP:TOTAL asset class that didn't exist in 2008
Interconnected with traditional finance via ETFs
Untested in true liquidity crisis
Part V: The Three-Stage Crisis Model
Stage 1: The Warning Shot (Now - Q4 2025)
Timeline: Next 1-3 months
Characteristics:
Deteriorating breadth (fewer stocks making highs)
Defensive rotation begins
TVC:VIX creeping higher
First 10% correction dismissed as "healthy"
Stage 2: The Liquidity Cascade (Q4 2025 - Q2 2026)
Timeline: 6-9 months
Characteristics:
Multiple failed rallies
"Buy the dip" mentality breaks
Margin calls cascade
All correlations go to 1
Targets:
TVC:SPX : 5,000-5,500
CRYPTO:BTCUSD : $50,000-70,000
TVC:GOLD : $2,200-2,400
Stage 3: Capitulation and Reset (Q2 2026 - Q4 2026)
Timeline: 6-12 months
Characteristics:
Forced selling exhaustion
Government intervention
Market clearing prices reached
Final Targets:
TVC:SPX : 3,700-4,500
CRYPTO:BTCUSD : $25,000-35,000
TVC:GOLD : Begins new bull market from $2,800
My Risk Management Framework
Position Sizing
Current Risk Asset Exposure: Reduce to 30% of portfolio
Cash: 50%
Precious Metals (Physical): 10%
Strategic Shorts: 10% (via puts and/or inverse ETFs)
Key Indicators to Monitor
Weekly Unemployment Claims: ECONOMICS:USUR Sustained moves above 250K
Credit Spreads: HYG/TLT ratio breaking below 4.5
Dollar Strength: TVC:DXY above 110 signals global stress
IG:BITCOIN Dominance: Below 45% indicates alt-coin capitulation
TVC:VIX Term Structure: Inversion signals immediate stress
Invalidation Scenarios
This bearish thesis would be invalidated if:
Unemployment reverses below 4%
Fed pivots to QE without crisis
Fiscal stimulus exceeds $2 trillion
AI productivity gains offset job losses faster than expected
Conclusion: Probability-Weighted Scenarios
Based on historical precedent and current conditions, I assign the following probabilities:
60% Probability: Significant correction (20-30% drawdown) beginning Q4 2025
25% Probability: Major crisis (40-50% drawdown) rivaling 2008
15% Probability: Continued melt-up through 2026 (Fed intervention success)
The risk/reward severely favors defensive positioning. After a 15-year bull market across all assets, the convergence of deteriorating fundamentals, extreme valuations, and historical crisis patterns suggests we're approaching a critical inflection point.
Remember: Markets can remain irrational longer than you can remain solvent. This analysis presents probabilities , not certainties. Always manage risk appropriately and never invest more than you can afford to lose.
Disclaimer: This analysis is for educational purposes only and should not be considered financial advice. Past performance does not guarantee future results. Always conduct your own research and consult with financial professionals before making investment decisions.
Follow for updates as this thesis develops. Key milestones to watch:
October NFP report
November FOMC meeting
Q4 earnings season
Year-end positioning
BTCUSD ShortAs you see in the chart, I see many reasons that we can see BTC to the level of 85,000$ by end of the year. So the reasons are:
Head&Shoulder pattern
Started the downtrend channel
The bold blue trendline is what the price is expected to touch.

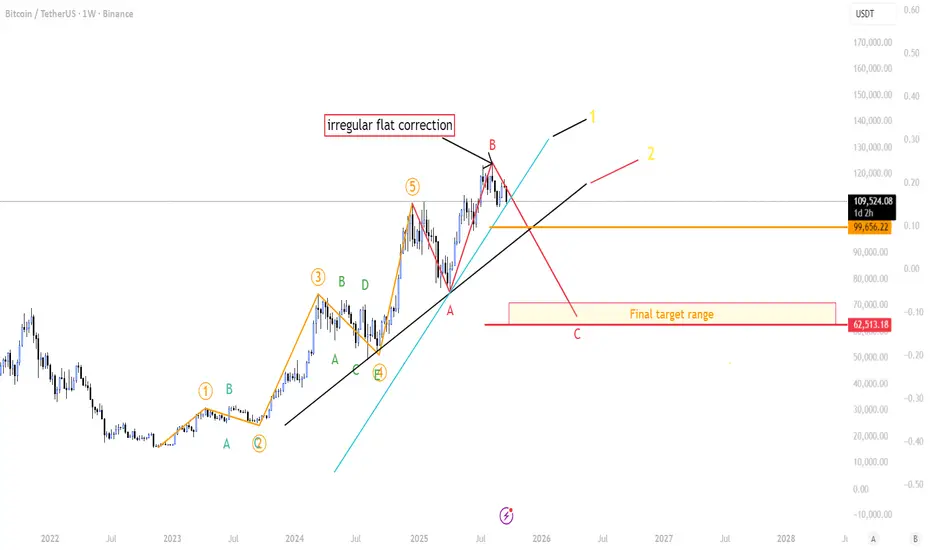
BTC at a Crossroad: Path to 62.5k Is Conditional-Pick Your PlayI’m sharing a possible irregular flat correction that could pull BTC toward ~62,513—only if two key trend supports break.
Note: This Elliott count differs from my main count. It’s my secondary scenario—lower conviction, but it deserves close attention because the structure is developing cleanly. This does not mean BTC is going down (it's just a watch out scenario)
The story so far
From the Nov 22, 2022 low, BTC ran a full 5-wave impulse.
Wave 3 was the extended one.
Wave 4 formed a triangle.
Wave 5 ran hotter than expected (roughly the size of Wave 3). That’s unusual, likely fueled by extreme Bollinger Band Width compression before the final push.
Why this matters: when Wave 3 extends, Wave 5 is usually shorter. It isn’t a hard rule—just a guideline—so this count stays on the board, but it’s not a high-conviction setup.
What I think is happening now
The drop and bounce look like an expanded (irregular) flat: (A) down, (B) up which was our All time high, C down.
If the pattern completes, C could target ~62,513.
Quick pattern note (irregular flat): It’s a 3–3–5 structure — A = 3 waves, B = 3 waves (often pokes above the prior high), and C = 5 waves. On this chart, A and B already printed as 3 + 3. The setup isn’t confirmed until we see C unfold as a clear 5-wave move (1-2-3-4-5). No five-wave C = no completed irregular flat.
What would confirm it (the “if/then”)
Lose the first rising trend support (≈ 109k).
Then lose the second, deeper trend support.
If both break, the path toward ~62.5k could be opening up.
Between those two lines: BTC can go sideways for a weeks—that “range box” is important.
Why the range box matters (Altseason meter)
Altcoins usually need steady BTC to fly:
BTC sideways (not spiking up or dumping).
TOTAL2 (alt mkt cap) breaks ATH.
BTC.D rolls over (dominance falls).
If these three line up, we’ve got a real altseason setup. If not, it’s noise.
Bottom line
This is a watchlist scenario, not gospel.
I’ll respect the levels: no break = no bear target.
If we range between supports, I’ll look for alt strength while BTC stays calm.
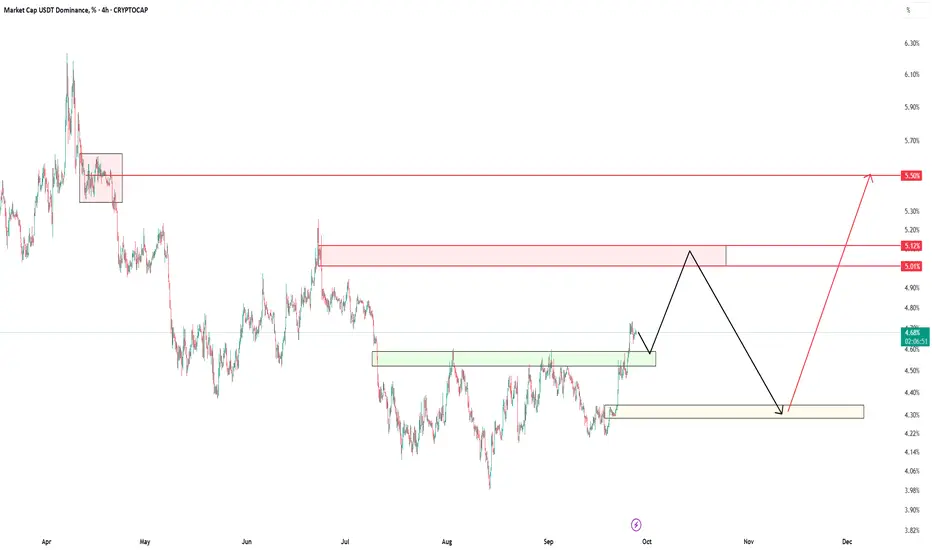
#USDT.D (4H Chart)#USDT.D
(4H Chart)
🔹️ USDT Dominance Analysis 🔹️
USDT dominance usually moves in the opposite direction of Bitcoin — when Bitcoin rises, this index tends to fall, and vice versa.
🟢 Green Box (Current Support)
The current support level for USDT dominance is in the green box: 4.60 – 4.50%.
We expect the price to move toward this level first, and after touching it, head toward the red box.
🟥 Red Box (Main Resistance)
The red box is at 5.00 – 5.12%.
This is the first and most important resistance level ahead.
After reaching this level, a correction is expected back toward the yellow box.
🟡 Yellow Box (Key Support)
The yellow box sits at 4.30%, which is a strong support area.
Once this level is tested, a major bullish move in USDT dominance is expected, targeting around 5.50%.
🎯 Final Target
When USDT dominance reaches 5.50%, the crypto market will likely be near its price bottoms.
💡 These bottoms could approximately align with Bitcoin around $85,000 and Ethereum around $3,000.
🆔 @RasoolAhmadi