BTCUSDTHello Traders! 👋
What are your thoughts on BITCOIN?
Bitcoin is still moving inside an upward channel.
After its strong rally, the price has entered a corrective phase and is now positioned around the midline of the channel.
We expect the correction to extend toward the support zone and the lower boundary of the channel after some short-term fluctuations.
From that area, a potential rebound could trigger the next bullish wave.
If support holds, Bitcoin is likely to resume its upward movement toward the upper boundary of the channel.
As long as the price stays above the key support area, the medium-term outlook remains bullish.
What do you think? Will Bitcoin bounce from the channel bottom and head for the top again?
Don’t forget to like and share your thoughts in the comments! ❤️
BTCUSDT

TradeCityPro | Bitcoin Daily Analysis #181👋 Welcome to TradeCity Pro!
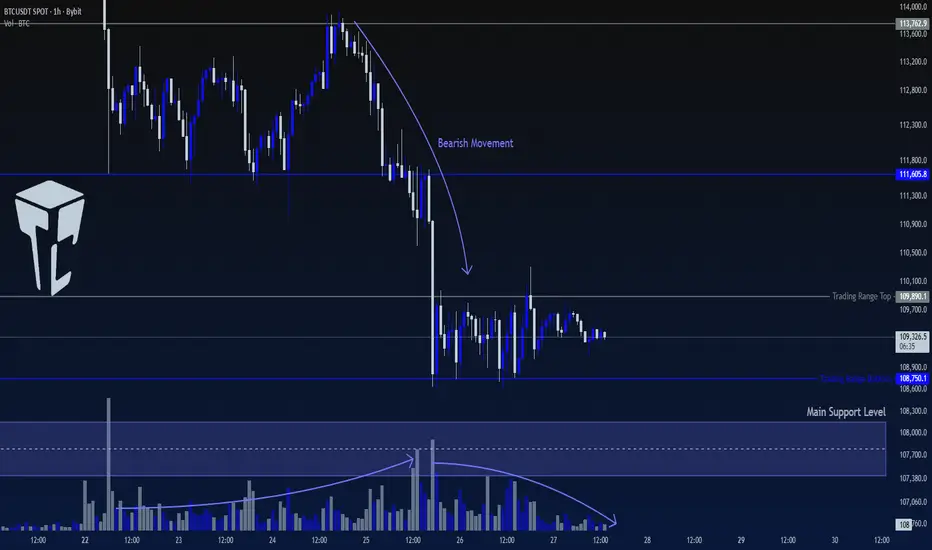
Let's dive into Bitcoin analysis, today is Saturday, and it's part of the weekend, so the market is relatively quiet. Bitcoin has shown some bearish movement, and now is a critical moment for decision-making.
⏳ 1-Hour Timeframe
After breaking 111,605, Bitcoin dropped and reached 108,750.
✔️ During the downward move, volume increased, indicating strong selling pressure. However, as the price reached the 108,750 support and formed a range box, volume decreased, and with the start of the Saturday candle, the volume has dropped to its lowest level.
🎲 This box is formed above a very important support level, so breaking this box is crucial.
🔔 If the price breaks the box to the downside, the likelihood of breaking the support increases. However, one important thing to note is that shorting after breaking 108,750 is not an ideal trigger because the price might bounce from the support, causing a stop-loss.
📊 On the other hand, if the box breaks to the upside, we can assume that the price is correcting the downward move and could potentially retrace back to 111,605.
💥 If the price stabilizes above 111,605 or forms a higher high and low above 109,890, we can take this as the first sign of a bullish reversal.
🧩 Overall, neither shorting nor longing seems ideal at the moment, so I believe the best choice is to wait and see if the price either stabilizes below the support and moves downward or moves upward again, in which case we can consider entering a long position.
❌ Disclaimer ❌
Trading futures is highly risky and dangerous. If you're not an expert, these triggers may not be suitable for you. You should first learn risk and capital management. You can also use the educational content from this channel.
Finally, these triggers reflect my personal opinions on price action, and the market may move completely against this analysis. So, do your own research before opening any position.
BTC 1H Analysis - Key Triggers Ahead | Day 48❄️ Welcome to the cryptos winter , I hope you’ve started your day well.
⏰ We’re analyzing BINANCE:BTCUSDT on the 1-Hour timeframe .
👀 On the 1-hour timeframe, Bitcoin previously formed a consolidation box at a higher range. After breaking the bottom of that box, it moved down to its support area around $108,800. Since the start of the weekend, price has been ranging in this zone, forming a new consolidation structure. The bottom of this range overlaps with the Tether Dominance resistance, creating a key confluence level. Candle size has been shrinking, signaling an incoming decision point for the next move.
A break above the range high at $109,755 could trigger upward momentum. An important detail here is the fakeout at the top of the range, where buyers failed to push higher and sellers drove price back down.
🧮 The RSI oscillator shows two key levels:
52: Slightly above the 50 baseline, acting as momentum resistance.
30: At the oversold boundary, where a breakdown could start a stronger move.
The previous fakeout at the range high was aligned with a rejection from the RSI resistance around 52, which reinforces the validity of this level. A momentum breakout through this zone could support a long setup.
🕯 Candle size and volume have significantly decreased due to consolidation and the weekend lull. With increased volume at the start of the new week, we can expect stronger candles. It doesn't matter which direction initiates the move — the breakout from this range will likely occur through a whale candle that clears the orderbook in one direction.
💵 From earlier Tether Dominance analysis, a break below 4.46% could inject bullish volume into the market and allow Bitcoin to break its range high and begin a new upward leg. However, a break above 4.72% on Tether Dominance could trigger deeper correction in Bitcoin, pushing it toward lower supports.
🧠 Two main scenarios for Bitcoin positions are currently in play:
1️⃣ Long Setup :
Wait for multiple rejections to complete and for Tether Dominance to lose the 4.46% support. A small green indecision candle before the breakout on Bitcoin would offer a clean entry with a tight stop. As volume increases and confirmation appears, the long position can be held to a suitable reward target. This setup can be taken in inverse correlation to Tether Dominance, using bearish candles there as confirmation.
2️⃣ Short Setup :
If Tether Dominance breaks above resistance and Bitcoin loses its current range support — combined with RSI dropping below 30 and price stabilizing under current support, ideally with a red indecision candle — a short setup becomes valid. However, note that Bitcoin demand is currently rising, and upward movement could occur at any moment. Personally, you prefer not to take short positions here.
❤️ Disclaimer : This analysis is purely based on my personal opinion and I only trade if the stated triggers are activated .

BTC SCENARIOS TODAY | BTCUSD BEARISH TREND | SEP.271. Main Trend
The market is still in a downtrend (clear bearish trendline + multiple BOS to the downside).
Current moves are just retracements within the bearish trend.
2. Key Zones
Sell Zone (priority – trend-following):
110,200 – 110,800 (confluence of FVG + Fib 0.5–0.618).
If price retraces here, look for short setups.
SL: above 111,200.
TP1: 109,000.
TP2: 108,200 (nearest support).
Buy Zone (countertrend – higher risk):
108,000 – 108,500 (strong support with previous bullish reaction).
Only consider short-term buys if a clear bullish confirmation appears.
TP: 109,500 – 110,000.
SL: below 107,700.
3. Scenarios
Most likely: Price pulls back to 110,200 – 110,800 → rejection → short opportunity.
If 108,000 breaks: Downtrend continues, potential extension toward 106,500.
If strong breakout above 111,200: Market may form a major CHoCH, shifting bias to bullish.
👉 Summary:
Main strategy: Sell at 110,200 – 110,800.
Alternative strategy: Short-term buy at 108,000 – 108,500.

Do you think I'm joking ???Bitcoin, as you can see, is within a descending wedge. If it breaks down, the price could drop below $100k, but we should wait for the breakout confirmation.

Hold the line bitcoin.Bitcoin is transitioning to a healthy correction phase after a major rally, and people's comments that it's dead and gone are not really a situation to be taken seriously. Corrections fuel the next major rally. The major uptrend continues.
S&P500 CHART UPDATE !!S&P 500 Analysis
The S&P 500 is trading near 6,650, moving strongly within its ascending channel.
Support: 6,400 – key level to hold for bullish momentum.
Resistance: 6,800 – a breakout could open the door toward 7,200.
The trend remains bullish, and staying above the midline keeps upside potential intact.
A breakdown below 6,400 may signal a short-term correction.

BTCUSD: Bearish Reversal on the Horizon?👋Hello everyone, what do you think about BITSTAMP:BTCUSD ?
Bitcoin is showing signs of a bearish reversal as it tests the lower boundary of its rising channel, with the likelihood of a breakdown below the trendline increasing. The diamond pattern also seems to be completing, signaling further downside potential.
Market sentiment remains cautious due to the recent rate hike by the Fed and a stronger dollar, both putting pressure on risk assets like Bitcoin.
A decisive move below the channel's support could trigger a sharp decline, targeting the $100,000 level. Keep an eye on these levels for trend confirmation.
💬What are your thoughts on BTCUSD’s outlook? Feel free to leave your comments below!
Good luck!

Bullish marketI set a stop loss (SL) and take profit (TP) for my trade. If the price hits the SL, there's a chance it could bounce back afterward. The chance is red support zone .

Bitcoin hesitating at previous low.BTC is reacting at the previous low, but a reaction is not enough, particularly one that offers little to no edge other than RR. 1D is almost oversold, which is usually where the majority of the dip comes in, resulting in the best buy-the-dip opportunities. Just be prepared for good opportunities
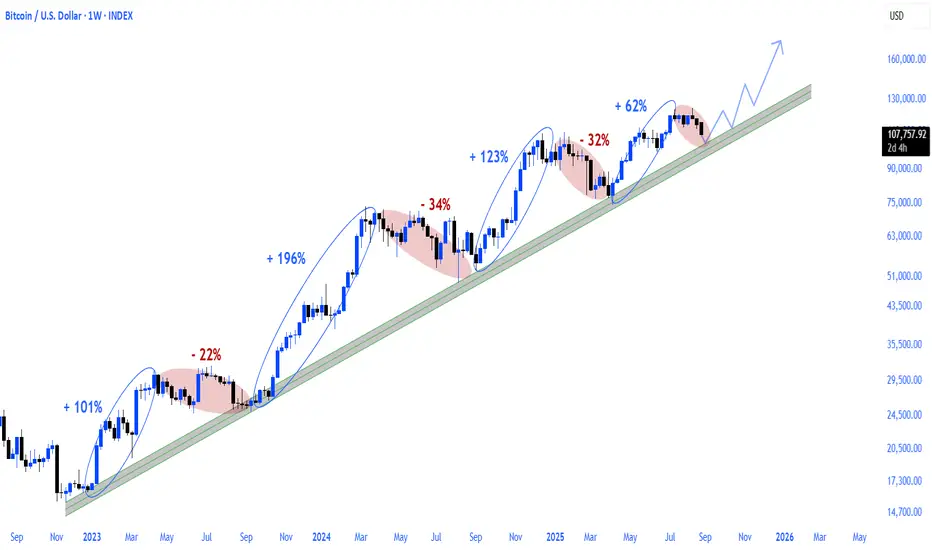
Bitcoin Weekly Elliott Wave & Fibonacci ZonesThis chart presents a comprehensive weekly analysis of Bitcoin (BTCUSD) at a critical juncture following a completed 1-2-3-4-5 Elliott Wave impulsive sequence. The structure now transitions into an ABC corrective phase, with particular focus on the positioning of Wave C in relation to Fibonacci retracement zones.
Elliott Wave Structure: The main bullish cycle is clearly mapped out, beginning from the Wave 2 support low and culminating at the Wave 5 peak. The ABC corrective move is forecast to target classical retracement levels, consistent with historical BTC cycle behavior.
Fibonacci Retracement: Key support zones are defined at the 38.2%, 50%, and 61.8% levels ($95,604; $86,747; $77,890), selected using the Wave 2 low as the anchor for maximal relevance. These levels represent statistically dominant retracement targets for the final stage of corrective pullbacks before blow-off tops historically observed in Bitcoin macro cycles.
Volume Profile and Indicators: The chart incorporates volume spikes and momentum measures (MACD, RSI), validating cycle peaks and inflection points. RSI currently hovers near neutral, supporting the thesis of a corrective move without signaling complete oversold conditions. Accumulation/Distribution remains positive, but fading momentum confirms the need for a reset.
Scenario Outlook:
This analysis anticipates a standardized corrective process in line with Bitcoin’s history, where the C wave of ABC retracement is highly likely to resolve within one of the highlighted Fibonacci zones, most commonly between 38.2% and 61.8% retracement. Technical confluence across price structure and indicators suggests these areas as optimal watchpoints for buyers and macro cycle accumulation. Upon completion of this corrective leg, BTC is statistically favored to embark on a renewed impulsive rally, reinforcing strategic accumulation for the next leg toward new ATH.
The chart is designed as an actionable reference for traders and investors aiming to navigate potential volatility and anticipate high-probability reversal zones consistent with previous bull market cycles.

BTC 15M Analysis - Key Triggers Ahead | Day 47❄️ Welcome to the cryptos winter , I hope you’ve started your day well.
⏰ We’re analyzing BTC on the 15-Minutes timeframe .
👀 After several days of decline from the zones we previously identified, we are back to analyze Bitcoin for you. On the 15-minute timeframe, Bitcoin is consolidating above the $108,800 support level, with the upper boundary of this consolidation at $109,760. A breakout above this level could signal the beginning of a new structure and trend. A breakdown below support, however, seems less convincing for a short position, as many traders who feel they missed out are now stepping in to buy. Current support zones are acting as both maker and taker buy levels. Bitcoin requires increased volume to confirm either a breakout or breakdown. With the upcoming weekend, however, risks must be carefully managed due to typically lower market activity.
🧮 Looking at the RSI oscillator, it is currently holding above the 50 level but facing resistance around 59. A breakout above 59 could enable Bitcoin to break consolidation resistance and push higher. On the other hand, a key zone lies near the oversold boundary; if Bitcoin enters this area, selling pressure could intensify and trigger a deeper correction.
🕯 Candle size and volume on the 15-minute chart remain within a range. We must wait for significant volume inflow—either upward or downward—to confirm direction. Bitcoin is shaping a new structure for the upcoming week, so patience is required until a breakout with decisive green or red candles occurs.
🧠 Trading outlook: It is preferable to wait for market structure to mature, with multiple tests of both support and resistance. The candlestick type used for entry is crucial, along with momentum confirmation at key RSI levels. A breakout above $109,766 combined with RSI surpassing 59 could provide a long setup. A breakdown below $108,795 combined with RSI falling below 30 and stronger selling pressure could trigger a short setup. Keep in mind that weekend trading usually comes with lower volume, which may result in indecisive structures—unless an unexpected global event sparks volatility.
❤️ Disclaimer : This analysis is purely based on my personal opinion and I only trade if the stated triggers are activated .
The ABCD Pattern: The Market’s Favorite Alphabet TrickIf the markets had a secret language, the ABCD pattern would probably be one of the first letters you’d learn. Clean, geometric, and surprisingly common, this formation has been studied for decades. In abcd pattern trading, it’s not about spelling words. It’s about spotting balance, symmetry, and rhythm in price movements.
📐 What Is the ABCD Pattern?
Think of the ABCD pattern like a zigzag that markets often draw. It’s one of the simplest chart patterns in technical analysis because it shows how price usually moves in waves, not straight lines. Here’s how it works:
A → B (Impulse Move):
This is the first strong move, either up or down. In trading terms, it’s called an impulse leg — the market pushes in one direction with momentum.
B → C (Correction):
After a big push, the price takes a breather. This is the corrective leg. It doesn’t usually erase the whole move, just part of it.
C → D (Continuation Move):
Here’s the key: the price often makes another move, similar in size and angle to A → B. That’s why people say the ABCD has “symmetry.”
So, when you connect the dots A-B-C-D, you get a neat geometric shape that traders call the ABCD trading pattern. ⚠️ But a warning straight away: no matter how perfect an ABCD looks on paper, it cannot be read in isolation. Without confirmation from other tools — volume, momentum indicators, or broader market context — it’s just a geometric doodle on your chart.
🟩 Bullish and Bearish Variants
Like most patterns, ABCD has two moods. The bullish ABCD pattern shows up after a down-move, hinting that the market might be ready for a rebound. The bearish sibling often forms after an up-move, suggesting exhaustion.
The structure doesn’t change — it’s always AB, BC, and CD — but the meaning depends on where it forms. In a bullish ABCD, sellers push the price down twice before running out of strength, and that’s when buyers often step in. In a bearish ABCD, buyers push the price up twice, but eventually lose momentum, giving sellers a chance to take over. So when you see an ABCD chart pattern, you’re not just connecting dots — you’re watching how buyers and sellers take turns, and where one side might finally give up control.
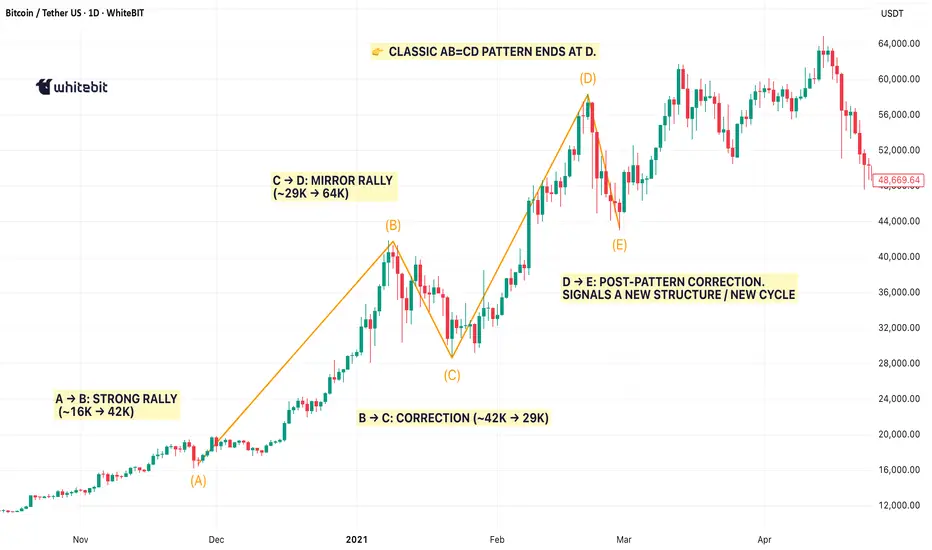
📊 Real Market Example
Take Bitcoin in early 2021. After a powerful rally from around ~$14K to ~$42K, BTC corrected back to ~$29K before surging again to new highs near ~$64K. This sequence mapped cleanly into a textbook ABCD pattern:
A → B: The rally into the ~$42K peak.
B → C: The correction down to the ~$29K zone.
C → D: A rebound to ~$64K, completing the mirrored leg.
It wasn’t a trading signal on its own — far from it. However, when combined with fading momentum and volume divergence, the ABCD chart pattern provided a visual anchor for identifying exhaustion in what was becoming an overheated market.
🧩 Why the ABCD Pattern Still Matters
The appeal of the abcd trading pattern lies in its simplicity. Markets are noisy, messy, and emotional. The ABCD strips that down to a geometric rhythm that even a beginner can spot. But here’s the catch: if you lean only on it, you’ll miss the bigger story. Professional analysts stress this constantly: the ABCD pattern works best as part of a toolkit. Pair it with Fibonacci retracements, moving averages, or support/resistance zones, and you’ll see how it fits into the wider puzzle. Alone, it’s just half a sentence. Together with other tools, it becomes part of the market’s story.
🎯 Final Thoughts
So, what is the ABCD pattern? It’s not magic, not a guarantee, but a visual lens. Think of it as one of the market’s favorite ways of whispering: “Something’s happening here.” The trick is listening carefully and comparing it with the rest of the orchestra. Because in trading, and especially in crypto, a single instrument never plays the whole song.
Bitcoin Roadmap: Can BTC Hold the $108K Before Next Big move!?Bitcoin( BINANCE:BTCUSDT ) managed to break the Support zone($110,920-$109,900) and Support lines yesterday with the help of a Bearish Marubozu Candle(the Marubozu candle volume was acceptable).
Bitcoin is still moving in the Heavy Support zone($112,000-$105,800) and near the important Support line, Potential Reversal Zone(PRZ) , Cumulative Long Liquidation Leverage($108,165-$107,000).
In terms of Elliott Wave theory, Bitcoin appears to be completing microwave 5 of the main wave 3. Microwave 4 of the main wave 3 is of the Contracting Triangle type, and the main wave 3 is of the extended type.
I expect Bitcoin to start rising and attack the Resistance lines after completing the main wave 3 from the Potential Reversal Zone(PRZ) , Support zone($108,200-$107,240), and Important Support line.
Cumulative Short Liquidation Leverage: $110,624-$109,836
Note: If Bitcoin touches $106,800, we can expect a break of the Heavy Support zone($112,000-$105,800).
Note: If Bitcoin goes above $111,000, we can expect a renewed rise in Bitcoin.
---------------------------------------------
One of the indices that helps the Roadmap of Bitcoin and other tokens is the USDT.D%.
USDT.D% currently seems to have managed to break the heavy resistance zone and this is NOT good news for Bitcoin and other tokens, and perhaps a further correction in the crypto market is on the way.
USDT.D%’s roadmap for me is that it is almost in line with today’s analysis of Bitcoin.
---------------------------------------------
Please respect each other's ideas and express them politely if you agree or disagree.
Bitcoin Analysis (BTCUSDT), 1-hour time frame.
Be sure to follow the updated ideas.
Do not forget to put a Stop loss for your positions (For every position you want to open).
Please follow your strategy and updates; this is just my Idea, and I will gladly see your ideas in this post.
Please do not forget the ✅' like '✅ button 🙏😊 & Share it with your friends; thanks, and Trade safe.

BTCUSDT at resistance ? What's next ??#BTCUSDT.. market just broke his supporting area and now it will turned into resistance.
Keep close and stay short until holds.
Good lucktrade wisley
$BTC market update.CRYPTOCAP:BTC Market Update
CRYPTOCAP:BTC is currently ranging between $120K and $106K.
If you didn’t enter near the bottom of this range, be cautious—there’s still a strong chance of rejection since the 1W consolidation isn’t finished yet.
The recent liquidity grab was expected, and with the CME gap nearly filled, the market is now at a decision point.
What’s next?
We’re sitting in the middle of the range:
If rejected, we could revisit the bottom around $106K, which would offer a stronger entry for the next leg up.
If momentum continues, the next target is the top of the channel at $120K.
The rejection scenario looks more likely since this push wasn’t impulsive—it was news-driven and unfolded slowly over a week, suggesting market makers may be buying to trigger short liquidations.
Indicators:
RSI → Each time it overheats, a cooldown follows. A better entry may be lower since this move seems topped.
MACD → Still ranging, offering clear buy/sell zones.
Stochastic RSI → Pointing toward a cooldown, reinforcing the rejection case.
Bearish divergence → If it is forming now, it would validate this idea further. Keep and eye on it.
Always remember: DYOR (Do Your Own Research).

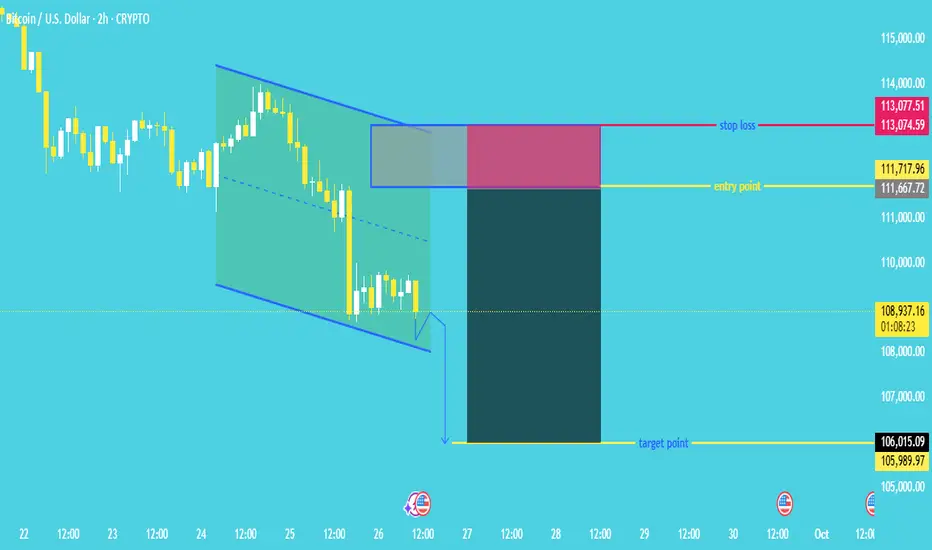
"Bitcoin Bearish Continuation Pattern: Short Entry on Retest"Chart Pattern
The price is moving within a descending channel (highlighted in blue and green), which typically signals continuation of the current downtrend.
A breakout to the downside of the channel seems to be forming (small breakout candle drawn outside the channel).
🔽 Trade Setup: Short Position
This is a short trade setup, meaning the trader expects the price to go down.
🔸 Entry Point
Entry Zone: Between 111,667.72 and 111,717.96 USD
This is above the current price, suggesting a pullback entry (waiting for a slight retracement before shorting).
🔹 Stop Loss
Stop Loss Zone: Between 113,074.59 and 113,077.51 USD
Placed above the channel and the entry point to protect against invalidation.
🟢 Target Point (Take Profit)
Target Zone: Between 105,989.97 and 106,015.09 USD
The expected price move is based on a measured move or projected breakdown from the channel.
🧮 Risk to Reward Ratio
The risk/reward box (red for risk, green for reward) shows a positive risk-reward ratio, likely around 1:2 or better, which is favorable in trading.
✅ Analysis Summary
Trend: Bearish (descending channel, lower highs and lower lows).
Setup: Short position on pullback into resistance zone.
Target: 106,000 area.
Stop: 113,000 area.
Current Price: Around 108,905.09 USD.
📌 Final Thoughts
The setup assumes the breakdown from the channel is valid.
A retest of the breakdown zone (entry point) is anticipated before continuation downward.
Be mindful of potential false breakouts or sudden bullish reversals.
BTC 110K IS A NEW UPTREND FOR LOW TIME FRAME UPDATE 26/09/2025BTC/USDT Update
On the low time frame, BTC is still in a breakdown structure, trading around 109.5K – 109.7K.
However, the market is now approaching a key reversal zone where a new uptrend could start.
Key levels:
110K → first confirmation level. A strong reclaim and close above this would be the first signal for a potential uptrend after more than a day under pressure.
113,296 – 113,892 → main trend resistance zone. Only a breakout and confirmation above this range would flip the structure fully bullish again.
Upside scenario: A move back above 110K confirms low time frame strength, opening the path to test 113K+.
Downside risk: Failure to reclaim 110K keeps BTC under bearish momentum, with risk of continuation toward 108K or lower.
📌 Summary
BTC remains in breakdown mode but is close to reversal territory.
Above 110K → first low time frame uptrend confirmation.
Above 113K+ → stronger trend reversal back into bullish cycle.
Below 110K → downside risk stays active.

btc run itEvery correction in Bitcoin bull run is the preparation for a new parabolic rise.
CRYPTOCAP:BTC

BTC Breakdown: Watching 112.6K-113.5K for Rejection Toward 109kHello guys!
Trend Structure:
The price was moving in a clear ascending channel, but recently broke down below the lower boundary with strong bearish momentum. This confirms a structural shift from bullish to bearish sentiment.
Current Price Action:
After the breakdown, BTC attempted a relief rally but is now struggling around the 112,682 – 113,581 resistance zone (marked in blue). This area was previously support inside the channel and is now acting as resistance (role reversal).
Scenarios (Entries):
Rejection at 112,682 zone:
If BTC fails to break above this resistance, sellers could step in and push the price lower. A clean rejection here would open the way toward 109,884 (next major support).
Deeper pullback to 113,581:
If bulls manage to push higher, the 113,581 level becomes the last line of resistance. A rejection here would be a high-probability short entry, also targeting 109,884.
Target Zone:
Both rejection scenarios point to 109,884 as the key downside target. A break below that level would increase bearish momentum toward 108,000 and possibly lower.

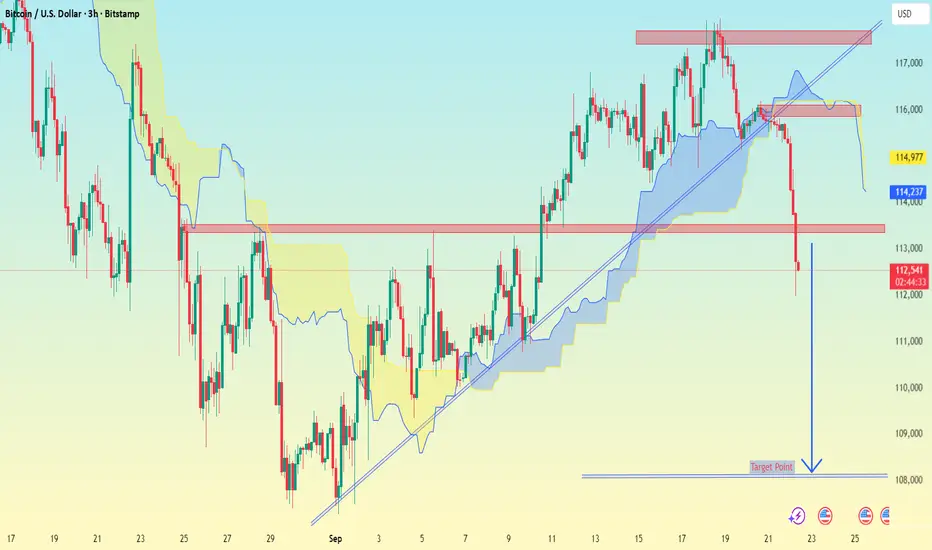
BTCUSD (Bitcoin / USD) chart on the 3H timeframe:BTCUSD (Bitcoin / USD) chart on the 3H timeframe:
Current price: 112,663.
BTC has broken below the trendline and Ichimoku cloud, confirming strong bearish momentum.
A major support at 113,000 has been broken.
The chart clearly marks a downside target.
📉 Target: Around 108,000 – 108,200 (as per your chart’s marked “Target Point”).
⚠ Key zones to watch:
Resistance (turned from support): 113,000 – 114,500.
If BTC retests this zone and fails, the move toward 108,000 becomes more likely.
If BTC closes back above 115,000, it could invalidate the bearish move.
👉 So my chart’s main target = 108,000 zone.
BTC/USDT — Bull Flag Formation: Continuation Rally or Breakdown?📝 Full Analysis
Bitcoin is currently forming a classic Bull Flag pattern. This setup appears after a strong impulsive rally (flagpole), followed by a corrective consolidation within a descending channel (the flag). Technically, a bull flag often indicates a bullish continuation, suggesting the market is taking a breather before resuming its upward trend.
🔍 Bull Flag Characteristics on the Chart
Flagpole: The sharp rally that pushed BTC up to 124,474.
Flag: A descending parallel channel where price consolidates with lower volatility and reduced volume.
Key Support (~109k): This level acts as the foundation of the flag. As long as BTC holds above it, the bull flag remains valid.
---
📈 Bullish Scenario (Bull Flag Confirmation)
Price holds above 109k and bounces higher.
A valid breakout above the upper flag trendline with a strong 2D candle close and higher volume would confirm the bull flag.
Upside targets:
Immediate Resistance: 117k → 120k.
Retest of Previous High: 124.4k.
Theoretical Bull Flag Target: potentially extending toward 130k+ in the mid-term.
---
📉 Bearish Scenario (Invalidation of Bull Flag)
If BTC fails to sustain above 109k, the bull flag risks invalidation.
A breakdown of this key level could drag price back to 103k, with extended downside risk toward 74.5k if selling pressure intensifies.
In this case, the flag turns into a failed continuation setup, shifting market sentiment bearish.
---
⚖️ Conclusion
The chart currently reflects a textbook Bull Flag: impulsive rally → corrective descending channel.
As long as 109k holds, the bullish continuation bias remains intact.
A breakdown below 109k, however, opens the door to a deeper correction.
---
📌 Trading Outlook (Not Financial Advice)
Bullish Plan: Enter on a confirmed breakout above the flag with strong volume. Targets: 117k → 120k → 124k+.
Bearish Plan: If breakdown occurs below 109k, short-term target ~103k, extended target ~74.5k.
---
#Bitcoin #BTC #BTCUSDT #BullFlag #Crypto #TechnicalAnalysis #ChartPattern #BullishContinuation #Breakout

Bitcoin Below $109K, Correction or Buying Opportunity?On September 25, 2025 , Bitcoin dropped below $109,000, the lowest point in the past three weeks. The $22 billion options expiration at the end of the month could create short-term selling pressure, but it may also present a recovery opportunity once this pressure eases.
BTCUSDT is trading within a clear downward channel, with lower highs and lower lows . Notably, the price has just faced strong resistance at $109,900, which also aligns with the downtrend line connecting previous highs.
If BTCUSDT cannot break through $109,900, we may see a strong correction towards the nearest support level at $106,000.
With a combination of news and technical analysis, BTCUSDT could continue its downward trend in the near future. Stay prepared and take advantage of the trading opportunities!
