BITCOIN Looks Bullihs (4H)Based on the price structure, which has formed a bullish trend through small corrections, and also the lack of rejection from the resistances that have just been tested, along with a bullish CH and the formation of a supportive trendline, it is expected that Bitcoin will move close to its ATH or register a new ATH, and then enter a correction phase.
Considering the Tether dominance chart we published a few minutes ago, we expect Bitcoin to remain bullish until it reaches the specified red zone.
For risk management, please don't forget stop loss and capital management
When we reach the first target, save some profit and then change the stop to entry
Comment if you have any questions
Thank You
BTCUSDT

BTC: Compressing under 116k – Awaiting the Next BreakoutHi everyone,
On the H4 chart, BINANCE:BTCUSDT is compressing just below the 116.2–116.5k zone, maintaining a higher-low structure and holding above the Ichimoku cloud. Key support levels include 115.0–114.8k, 114.0–113.8k, and deeper 113.0–112.6k; any dip into these zones mainly gathers liquidity without breaking the trend.
The 116.2–116.5k zone holds many short stops, and an H4 close above this typically propels price toward 117.3–118.0k. Buy-the-dip remains dominant, with rising volume on advances and declining volume on pullbacks, showing strong buying pressure.
From a news perspective, August PPI was soft, jobless claims surged, CPI edged higher, 10Y yields and DXY softened → fostering a risk-on sentiment for crypto. ETF inflows into BTC respond positively, and upcoming US macro data (Retail Sales, Michigan sentiment, Fed commentary) may create short-term swings: soft data supports a break of 116k, while hotter prints could pull price back to support FVG zones.
My bias remains bullish as long as BTC holds 114.8–115.0k, waiting for an H4 close above 116.2–116.5k to target 117.3–118.0k; only a close below 113.8k would change the outlook.
Comment below if you’re watching the 116k zone like I am!

BTCUSD 4h- Bearish SetupBITSTAMP:BTCUSD is showing early signs of exhaustion after its recent push into the $116K zone. Multiple bearish confluences are aligning:
Price has rejected near the upper resistance band, signaling potential short-term weakness.
The last few candles show strong wicks to the upside, indicating selling pressure.
Current structure sits below the short-term resistance block, with buyers struggling to maintain momentum.
🔑 Fibonacci Retracement Targets (from recent swing move):
38.2% → $115,503
61.8% → $114,390
100% → $112,589
If downside momentum builds, these levels may act as supports and potential take-profit zones for shorts. Confirmation of rejection from the resistance zone could open the path lower toward the 61.8% and 100% retracement levels.
⚠️ Invalidation: A strong close above $117,305 would negate this bearish setup and reopen bullish continuation potential.

BTCUSDBTCUSD needs a correction or impulse here to the downside playing between 116-114K.
Disclosure: We are part of Trade Nation's Influencer program and receive a monthly fee for using their TradingView charts in our analysis.

TradeCityPro | Bitcoin Daily Analysis #176👋 Welcome to TradeCity Pro!
Let’s go for a different kind of Bitcoin analysis today. I’ve used a new color theme on the chart—let me know in the comments whether you like this theme or prefer the previous one.
⌛️ 4-Hour Timeframe
In the 4-hour timeframe, Bitcoin had formed a descending channel, moving lower with a bearish structure of lower highs and lower lows toward the 107,000 support zone.
✔️ After reacting to this support, price climbed toward the channel’s top. Following one false breakout, it managed to break the channel on the next attempt and moved toward the channel trigger at 113,222.
💥 This move came with rising volume, which boosted bullish momentum and increased the likelihood of breaking 113,222.
✨ With the breakout of 113,222, Bitcoin’s main upward wave began, and price is now heading toward the next resistance at 116,960, which it is already approaching.
🧩 Over the last few candles, volume has dropped significantly, mainly because it’s the weekend. If volume starts to pick up with the new week, the probability of breaking 116,960 will increase.
🔑 A breakout above 116,960 could serve as the next long trigger, while Bitcoin’s key major resistance remains at 121,188.
❌ Disclaimer ❌
Trading futures is highly risky and dangerous. If you're not an expert, these triggers may not be suitable for you. You should first learn risk and capital management. You can also use the educational content from this channel.
Finally, these triggers reflect my personal opinions on price action, and the market may move completely against this analysis. So, do your own research before opening any position.

BTCUSD Weekly Analysis– Are Bulls Ready for the Next Leg Up?Bitcoin (BTCUSD) closed this week at $115,822, gaining 4,659 points from the previous week.
📊 Weekly High: $116,805 | Weekly Low: $110,624
🔑 Key Levels to Watch Next Week
✅ Bullish Scenario:
If BTCUSD sustains above $116,000, we could see an exciting move towards the strong resistance zone of $119,140 – $119,800. A breakout above this level could open doors to fresh all-time highs in the coming sessions.
❌ Bearish Scenario:
A 1-hour close below $115,480 could trigger selling pressure, taking Bitcoin down to test key support at $113,760 (just ~1.5% lower from current levels).
🎯 Trading Plan / Strategy
Aggressive Bulls: Look for sustained price action above $116K before entering fresh longs.
Smart Bears: Watch for signs of rejection near $119K zones for a possible short opportunity.
Swing Traders: Use the $115,480 level as a pivot — whichever side it breaks, follow the momentum.
🧠 My Take
Bitcoin is looking strong after this week’s breakout, but the next move depends on whether bulls can hold $116K. A failure here might just give dip buyers another golden entry near $113,760 support.
💬 Let’s Talk!
What’s your view – are we heading to $120K next or are we due for a healthy pullback?
👇 Drop your thoughts, charts, and strategies in the comments — I’ll review and share my take on interesting ideas!

#BTC/USDT options market is bullish.#BTC
The price is moving within a descending channel on the 1-hour frame and is expected to break and continue upward.
We have a trend to stabilize above the 100 moving average once again.
We have a downtrend on the RSI indicator that supports the upward break.
We have a support area at the lower boundary of the channel at 114650, acting as strong support from which the price can rebound.
We have a major support area in green that pushed the price upward at 114400.
Entry price: 115152.
First target: 115476.
Second target: 115990.
Third target: 116633.
To manage risk, don't forget stop loss and capital management.
When you reach the first target, save some profits and then change your stop order to an entry order.
For inquiries, please comment.
Thank you.

$WLFI Breakout Watch.$WLFI/USDT has just broken out of its downtrend and successfully retested the support zone.
If it holds this level, the next move could push it toward $0.2880, about 31% higher from here.
DYOR, NFA

BTC H1-Chart Analysis📢 NFX Market Update – BITSTAMP:BTCUSD
A bullish divergence has formed on the H1 timeframe around $115,400, suggesting the likelihood of a short-term retracement in the next few hours.
More importantly, this setup points to the possibility that the breakout below the ascending triangle was a bear trap.
A decisive break and candle close above the 50% Fibonacci retracement (~$116,300) would confirm bullish trend continuation.

Bitcoin Ready To Moon Or Crash Crowd Mindset DecidesIs now the time to buy, or should we run away?
Why do most traders make the wrong move at the most critical moment?
Bitcoin today is not just an asset, it’s a live psychology test of the entire crowd.
Hello✌️
Spend 2 minutes ⏰ reading this educational material.
🎯 Analytical Insight on Bitcoin:
Bitcoin has convincingly broken above its three-week resistance with strong bullish momentum 📈. Trading volume is exceptionally high, suggesting a continuation toward new highs. The first target indicates a potential 7% gain, while the next major level could reach $124,000 🚀.
Now , let's dive into the educational section,
🧠 Greed The Hidden Enemy of Traders
Greed often begins with a simple thought: “Let’s hold a little longer, maybe it goes higher.” That single idea has wiped out millions of dollars in this market. In bull runs, crypto is designed to trigger this feeling. Green candles in a row, optimistic news, and analysts calling for unrealistic targets all convince traders to keep holding.
😨 Fear The Trigger of Wrong Sells
If greed traps you at the top, fear traps you at the bottom. The moment screens turn red, fear dominates. Panic spreads through news headlines, social posts, and rumors. Your mind wants to escape pain, so you smash the sell button.
🐳 Whales and Their Psychological Games
Whales are the best psychologists in the market. They know how the crowd thinks, fears, and reacts. By injecting sudden buy or sell pressure, they create fake moves that trigger thousands of liquidations.
For example, in futures markets whales often manipulate price just enough to hit stop-loss clusters. Retail traders believe “the market is against me,” but in reality they are against themselves. The whales don’t move price randomly they move it exactly where the crowd’s emotions are most vulnerable.
🔍 Why Technical Analysis Alone Is Not Enough
Indicators are great, but they can’t explain why you panic at support or get greedy at resistance. A trendline won’t tell you why you exit right before a reversal. Technical analysis is only the map; trading requires controlling emotions while driving on that map.
That’s why two traders can look at the same chart and get completely different results: one profits because he manages his psychology, the other loses because he doesn’t.
🚀 Ready for Explosion or Collapse?
Right now Bitcoin stands at a turning point. Macro news, trading volumes, and the Fear and Greed Index all show a sensitive zone. A single spark could push BTC into new highs or deep corrections.
But the real driver won’t be candles or lines it will be the crowd’s reaction to them. If traders once again follow fear and greed blindly, the cycle repeats. If they finally learn to step aside from the crowd, they have a real chance to win.
📊 TradingView Tools and Market Psychology
When it comes to Bitcoin, nothing is more important than understanding crowd sentiment. The Fear and Greed Index is one of the best tools you can integrate into TradingView charts for a bigger picture. When this index shows extreme fear, it means the majority is selling and that’s exactly where big players step in. On the other hand, extreme greed often signals serious danger.
Another useful TradingView feature is the Volume Profile indicator. It shows where most trades occurred and in which zones traders are mentally trapped. When you combine this with the Fear and Greed Index, you get a clear vision of when the crowd is about to face either a massive breakout or a brutal sell-off.
You can also apply Sentiment Indicators and Social Volume Tools directly on TradingView charts to see how emotions reflect in real-time. For example, when social discussion around Bitcoin spikes while price stays flat, the market is quietly preparing for a major move. This makes your analysis more than just price action; it becomes a psychological guide for every trader reading it.
🎯 Conclusion
Bitcoin’s market is not just numbers and charts it’s a battlefield of emotions. With the right tools on TradingView, you can see crowd psychology more clearly and prepare ahead of the masses. The secret to survival is simple: manage your emotions before the market manages them for you.
💡 Five Golden Advices for Survival in This Market
Always define your exit plan before entering a trade, never after.
If everyone is buying with excitement, pause the market usually rewards those who wait.
In moments of extreme fear, don’t rush to sell; check volume and sentiment indicators on TradingView first.
Never risk all your capital on one position; proper risk management is your lifeline.
Treat your emotions as an indicator; if you feel extreme fear or excitement, that’s your signal to wait, not to act.
✨ Need a little love!
We pour love into every post your support keeps us inspired! 💛 Don’t be shy, we’d love to hear from you on comments. Big thanks, Mad Whale 🐋
📜Please make sure to do your own research before investing, and review the disclaimer provided at the end of each post.

BTCUSD Under Pressure! SELL!
My dear friends,
My technical analysis for BTCUSD is below:
The market is trading on 11678 pivot level.
Bias - Bearish
Technical Indicators: Both Super Trend & Pivot HL indicate a highly probable Bearish continuation.
Target - 11582
Recommended Stop Loss - 11735
About Used Indicators:
A pivot point is a technical analysis indicator, or calculations, used to determine the overall trend of the market over different time frames.
Disclosure: I am part of Trade Nation's Influencer program and receive a monthly fee for using their TradingView charts in my analysis.
———————————
WISH YOU ALL LUCK

TradeCityPro | Bitcoin Daily Analysis #175👋 Welcome to TradeCity Pro!
Let’s move on to Bitcoin analysis. I haven’t posted an update for the past two days, but starting today, let’s get back to the market and see what’s ahead.
⌛️ 4-Hour Timeframe
The U.S. CPI and PPI data, two key inflation indicators, were released and came in favorably for the market. As a result, Bitcoin has moved toward 117,048.
💥 At the moment, most of the positions we’ve opened are in profit. Because of this, taking some profit could be a smart option, since Bitcoin might enter a corrective phase once it reaches the 117,048 level.
📈 For new entries, a clean breakout above 117,048 would be a valid trigger. However, the chance of breaking this zone on the first attempt is low, and there’s a strong possibility that price will wait for Powell’s upcoming speech before making its next decisive move.
📊 We can also use RSI’s move into the overbought zone as a momentum confirmation. If that happens, it could set off a powerful bullish leg to the upside.
❌ Disclaimer ❌
Trading futures is highly risky and dangerous. If you're not an expert, these triggers may not be suitable for you. You should first learn risk and capital management. You can also use the educational content from this channel.
Finally, these triggers reflect my personal opinions on price action, and the market may move completely against this analysis. So, do your own research before opening any position.

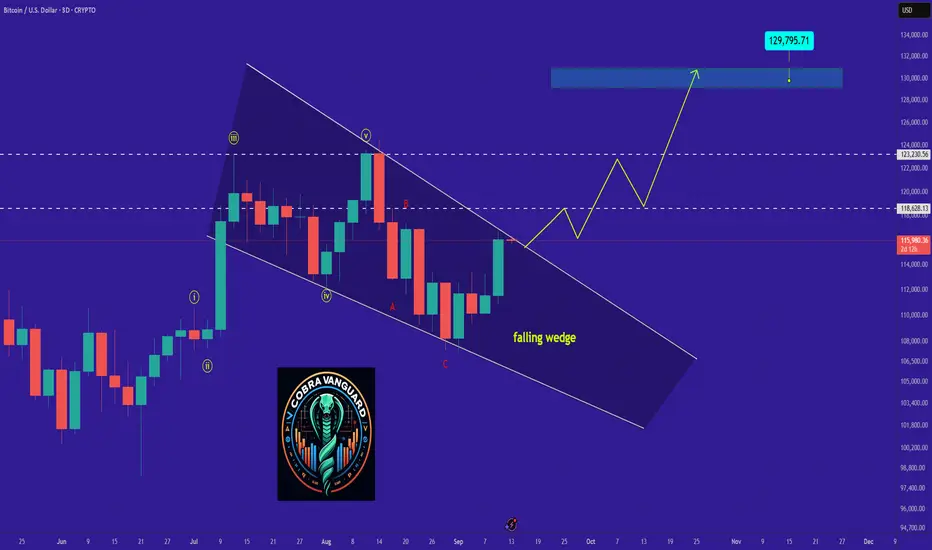
BTC is bullish now and many Traders don't see it !So if you pay attention to the BTC chart you can see that the price has formed a Ascending wedge which means it is expected to price move as equal as the measured price movement.( AB=CD )
NOTE: wait for break of the WEDGE .
Best regards CobraVanguard
BTC logaritmic regresion analysisThe red lines mark the hypothetical range of maximum for this cycle.
Until now, BTC has been behaving just as expected. The green box should mark the way up.
The gray zones represent the premium and the discount regions. Up and down respectively.
Follow your own plan. Greed and fear are never good advisors.
This is just an opinion, not an advice of any kind.
Market is the only master of its actions.

BTC ANALYSIS🔮 #BTC Analysis
🌟🚀 As we said earlier #BTC moved around 5%. Right now we would see a little retest and then a bullish movement will be seen soon
🔖 Current Price: $1,15,858
⏳ Target Price: $1,21,713
⁉️ What to do?
- We have marked crucial levels in the chart . We can trade according to the chart and make some profits. 🚀
#MKR #Cryptocurrency #Breakout #DYOR

bitcoin vs. ethereum 2017\2025Bitcoin and Ethereum literally mirrored 2017.
CRYPTOCAP:BTC to $200k \ CRYPTOCAP:ETH to $10k

BTC Trade Update - Hidden Divergence on 30M TF📢 NFX Market Update – BITSTAMP:BTCUSD
A hidden bearish divergence has formed on the 30M timeframe around $116,700. This signals the likelihood of a short-term retracement in the next few hours.
🔒 Lock in partial profits and trail stops to protect gains. The broader trend remains bullish, and I still expect continuation after this pullback.

BTCUSD set to cross 127,000?BTCUSD pulled back to $107,309 upon crossing $124,567 , monthly closed with a long bearish candle. With new candle opened, market started bounce back to the major direction of the trend with a confirmation of daily cross over of 20ema and 10ema price may bounce off the current resistance to create a new all time high!

$BTC – Immediate Support BINANCE:BTCUSDT | 6h
The CME gap at 116.8k has now been filled, with price stalling at 115k
At the moment, the key area I’m watching is 114k. If we can find support and bounce here, there’s room for price to make another leg higher. The first target would be a retest of 116k, but momentum could extend toward 117.3k. That 117.5k level has been the major line in the sand for some time — it’s the level that needs to be reclaimed in order to shift market structure away from the current bearish bias.
On the flip side, if price pushes into the 116–117k zone and gets rejected again, I’d like to see 112k hold firm. A solid base at 112k would provide a higher-low structure and set the stage for continuation to the upside. Losing 112k would open the door for a retracement back to 109k.


The big move UP is comingHave published this one in the mind section fews times.
Now you can keep track ot it.
The fractal is working quite well. Combined with the parallel channel you get a better picture of the key levels. Also my custom EMA indicator is confirming the downside shorterms with a good opportunity to buy around 2.5 level.
Good luck all.

PPI Shock Pushes Bitcoin Higher – Fake Pump Before Drop?Bitcoin ( BINANCE:BTCUSDT ) has been making high momentum Sharpe moves over the last few days , which has made it a little difficult to trade, which is why I am still sticking to my previous analysis , and this analysis is an update of targets and even new entry points .
Bitcoin is currently moving near the Resistance zone($114,720-$113,580) , Reversal Zone(PRZ) , Cumulative Short Liquidation Leverage($114,510-$113,771) , Monthly Pivot Point , and Resistance lines = a set of Resistances
A few minutes ago, the US Core PPI m/m and PPI m/m data were released, which triggered a pump in Bitcoin . In my view, we should wait for Bitcoin to digest this shock and then continue its real trend .
Do you agree with me?
In terms of Elliott Wave theory , it seems that Bitcoin has completed microwave 5 of microwave C of the main wave Y , and we can expect a downtrend .
I expect Bitcoin to drop again to at least $111,600(First Target) .
Second Target: $110,883
Third Target: $110,000 and more dumps.
Stop Loss(SL): $114,923(Worst)
CME Gap: $117,235-$113,800
Cumulative Long Liquidation Leverage: $110,822-$109,752
Note: Be sure to follow capital management and do not take risks.
Please respect each other's ideas and express them politely if you agree or disagree.
Bitcoin Analysis (BTCUSDT), 1-hour time frame.
Be sure to follow the updated ideas.
Do not forget to put a Stop loss for your positions (For every position you want to open).
Please follow your strategy and updates; this is just my Idea, and I will gladly see your ideas in this post.
Please do not forget the ✅' like '✅ button 🙏😊 & Share it with your friends; thanks, and Trade safe.

Precise Prediction and Forecast for BTCUSD MarketYesterday, we accurately predicted that BTC would rally to around 116,000 USD and face certain resistance. Today, after breaking through 116,000 USD as expected, the price retraced to hover around 115,000 USD.
Looking ahead, if BTC can stabilize near the 115,000 USD level, it is highly likely to continue its upward trajectory, with the potential to retest the 120,000 USD mark. For upper resistance, the focus remains on the 117,000–118,000 USD range
Buy 114000-114500
TP 115000-116000-1175000
Daily-updated accurate signals are at your disposal. If you run into any problems while trading, these signals serve as a reliable reference—don’t hesitate to use them! I truly hope they bring you significant assistance
