WILL POPCAT HAVE A NEW WHALE VOLUME?POPCAT seems interesting then never before, even with the last correction, are we going to see a new increase round by POPCAT? The time will show, the interest is here.
If this coin is able to make new confirmations, the updates will be below.
BTCUSDT

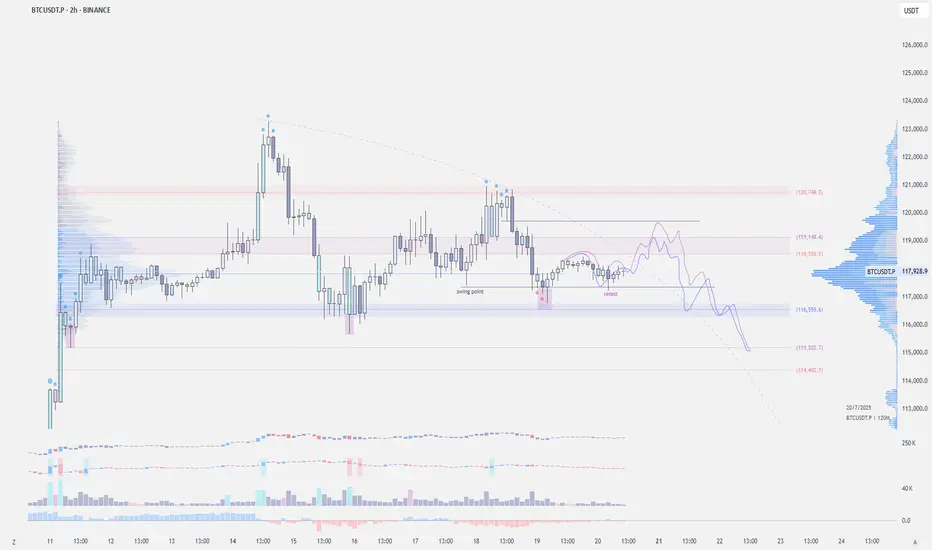
$BTC - Weekend LTF SetupCRYPTOCAP:BTC | 2h
Possible LTF setup:
We got the 2h swing point retest. If base support holds, I’m looking for a potential move back to 119k — possibly even a gap fill to 119.7k before taking out the local lows.
BTCUSD Technical Analysis | Smart Money Concept (SMC) BreakdownBTCUSD Technical Analysis | Smart Money Concept (SMC) Breakdown
🧠 Smart Money Market Structure Insight
📌 Key Elements Identified:
BOS (Break of Structure): Multiple BOS points indicate bullish intent early on. However, the latest BOS on July 14 followed by a significant drop signals a shift in momentum—possibly a distribution phase.
Liquidity Sweep: Price swept prior equal lows/liquidity before reversing, a typical Smart Money trap setup.
FVG (Fair Value Gap) / Imbalance: Identified around the mid-section of the chart—price filled partially but failed to hold, suggesting internal weakness.
Strong Support Zone (Demand Area): Marked between 115,000 - 114,640; this zone is anticipated to act as a springboard for bullish reversal.
📉 Current Price Action Observation:
BTCUSD is hovering around 118,152 - 118,560, moving sideways with lower highs indicating compression.
Price is projected to form a "W" pattern or double bottom in the shaded region.
Expected liquidity grab beneath 115,902 followed by potential bullish reaction targeting 121,562, as indicated by the white arrow.
🧩 Strategic Outlook & Potential Play:
🔻 Bearish Sweep First:
Market likely to sweep the support one more time, tapping into deeper liquidity pools between 115,000–114,640.
This is aligned with the concept of Smart Money hunting for retail stop-losses before reversing.
🔼 Bullish Recovery After Sweep:
Strong probability of bounce due to presence of:
Fair Value Gap (already tested),
Fresh demand zone,
Liquidity grab setup.
Projected Bullish Target: 121,562
Confirmation Needed: A strong bullish engulfing or BOS on lower timeframes near support.
🏷️ Conclusion:
This BTCUSD setup is a textbook Smart Money scenario: BOS ➝ Liquidity Grab ➝ FVG ➝ Reversal from Demand. Traders should wait for confirmation from the support region before entering long positions.

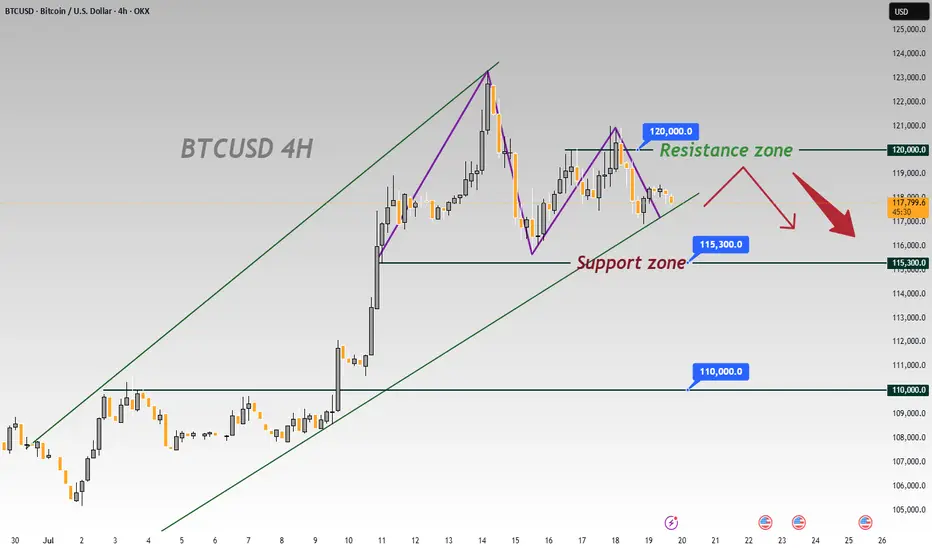
BTCUSD 4-Hour Chart Analysis: Range-Bound Trends & Key LevelsFrom the 4-hour chart of BTCUSD, the recent price movement shows obvious range-bound characteristics 📊. The upper zone around 120000 forms a key resistance level 🛑, where the bullish momentum has waned after encountering resistance 💨.
The lower level of 115300 is a significant support zone 🛡️. Previously, there was some buying support when the price retraced to this zone 👀. However, as the current price is pulling back from the resistance zone ↘️, if the bearish force takes the lead subsequently 🐻, the possibility of breaking below the 115300 support will increase ⬆️. Once it breaks below effectively 💥, the next key support level of 110000 will most likely become the target for the price to decline towards 🎯.
In terms of the short-term trend 📈, due to the obvious suppression from the resistance zone 🚧, the price will most likely continue the rhythm of testing the support downwards 🔽. In operation, one can pay attention to the breakdown situation of the support zone and layout trades accordingly 📝. Meanwhile, be alert to the possibility of a rebound after the price finds support in the support zone 🚀, and further confirmation of the direction needs to be combined with real-time K-line patterns 📊, trading volume 📈
🚀 Sell @119500 - 118500
🚀 TP 116500 - 115500
Accurate signals are updated every day 📈 If you encounter any problems during trading, these signals can serve as your reliable guide 🧭 Feel free to refer to them! I sincerely hope they'll be of great help to you 🌟 👇
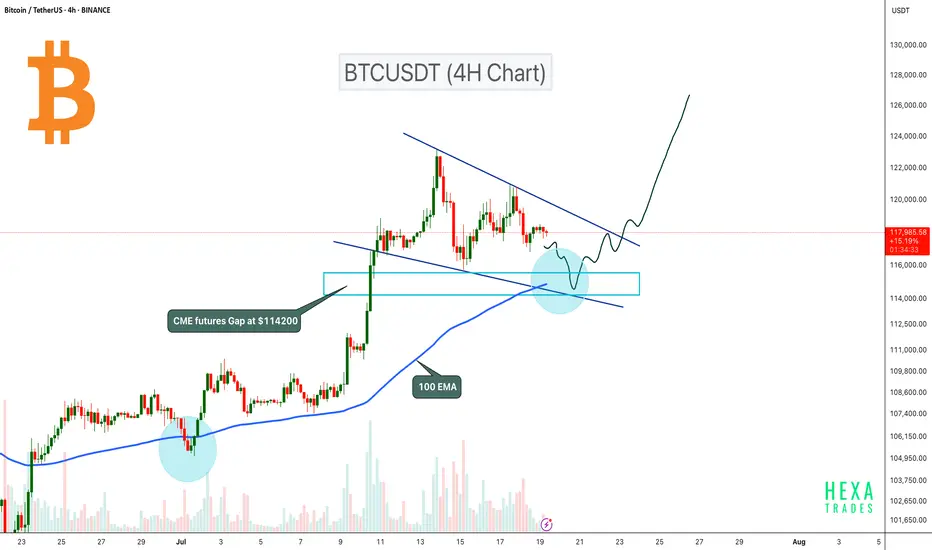
BTC Pullback Expected to $114K Before Next Leg Up!Bitcoin is currently consolidating inside a bullish flag pattern on the 4H timeframe. The price could retest the flag support, where the 100 EMA will act as dynamic support. Additionally, there is a CME futures gap at the $114,200 level, which also aligns with the 0.5 Fibonacci retracement level. Therefore, a retest to the $114,200 zone is likely before the next potential upward move.
A potential bullish reversal could occur if BTC retests this zone and confirms a bounce. A breakout from the bullish flag pattern could signal the next leg up.
Cheers
Hexa🧘♀️
BITSTAMP:BTCUSD CRYPTOCAP:BTC
BTCUSDTHello Traders! 👋
What are your thoughts on BITCOIN?
Bitcoin has recently posted a new all-time high and is now undergoing a healthy correction. This pullback is expected to extend toward a key support zone, which aligns with both the previous breakout level and the bottom of the ascending channel.
Once the correction is completed near the channel support / previous high, we anticipate a bullish continuation.
The next leg higher could take Bitcoin toward the upper boundary of the current channel.
As long as price remains above the key support area, the overall structure stays bullish and this correction is likely to be a buy-the-dip opportunity within a broader uptrend.
Will Bitcoin use this pullback as a launchpad for new highs? Share your view in the comments! 🤔👇
Don’t forget to like and share your thoughts in the comments! ❤️

LINK START...Hello friends🙌
📈As you can see, the upward trend has started, and the power is in the hands of buyers, and here we have an opportunity to enter a buy trade with risk and capital management to move with the specified goals.
🔥Follow us for more signals🔥
*Trade safely with us*

Bitcoin Interesting Fractal And Timing! GOING STRAIGHT UP!I noticed that the timing and pattern of how this is playing out in 2025 in Bitcoin is very similar to that of 2017. This fractal is not identical but its damn close. In 2017 there were approximately 15 million people in crypto, very few leverage exchanges, and trading was no where near what it is today. Now we have exchanges everywhere, hundreds of them most with leverage which we didn't really have before. Also not to mention that now we have big players getting in and they aren't buying and selling on the daily, they are buying it all and holding it, hence why we aren't seeing the typical "Alt season". The sloshing effect we had in the early days when traders would rotate out of Bitcoin into alts is not happening as it used to.
In 2017 Trump took office and in the end of March the bull run started in full swing. Something very similar is also happening now that we are in March and these fractals are lining up. Let see how this plays out. I think we are on the cusp of a giant mega bull run like you've seen before.
Crypto traders last year made mega profits cashing out multiple billions in capital gains. Once the selling stops around the end of March and beginning of April from people selling to pay taxes I think its on. This is not financial advice this is just my opinion. Lets see how this chart ages. Thank you for reading.

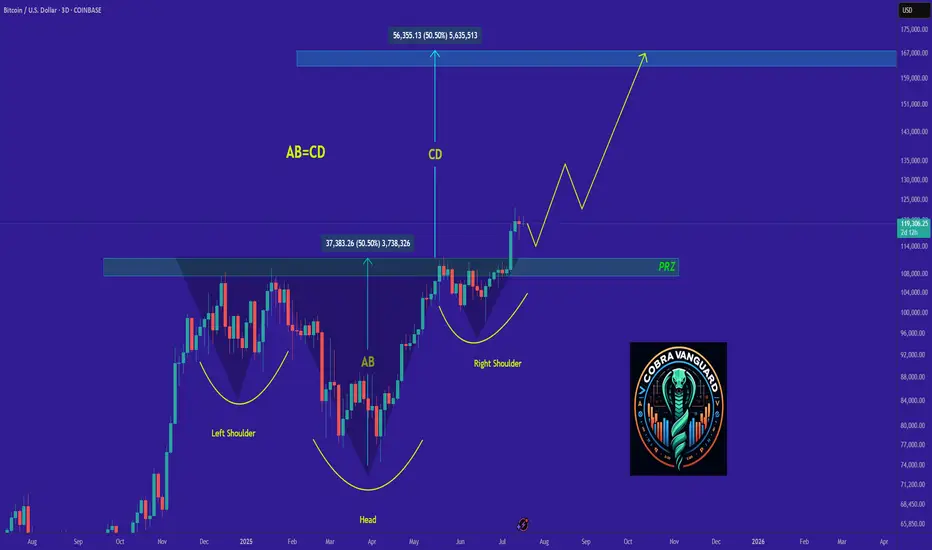
BITCOIN's Situation (1h) !!!The price is within an ascending triangle, which could be encouraging. However, since crypto doesn't always follow patterns, it might break down from below and correct to around $115K!
Best regards CobraVanguard.💚

BTC Double QML Setup: Is Another Drop Loading?Hello guys!
Do you remember the last analysis?
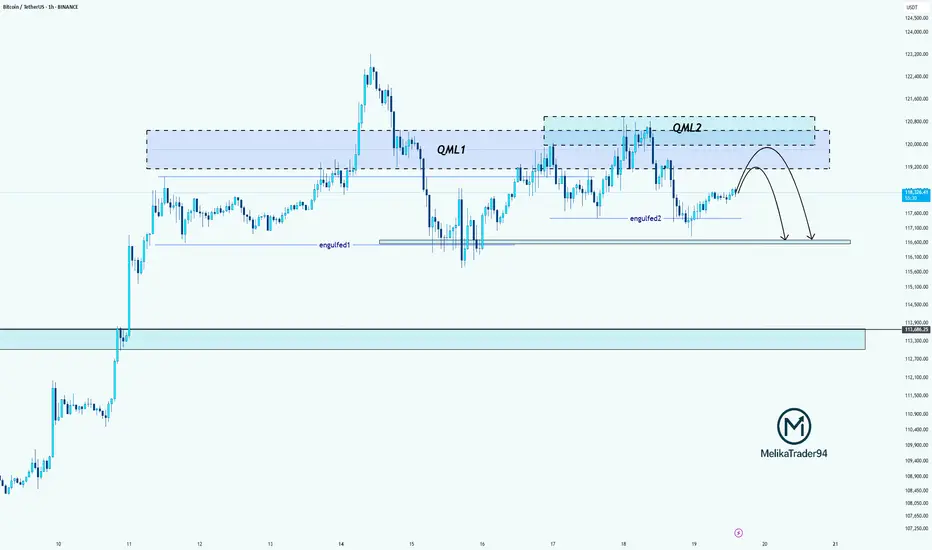
Now this BTC chart shows a textbook example of two consecutive QML (Quasimodo Level) patterns forming (QML1 and QML2), each confirmed by clean engulfed lows.
QML1 caused a strong drop after the high was broken and a new low formed.
Price retraced and created QML2, again with a confirmed engulfed low (engulfed2).
We're now likely to see a reaction at the QML2 supply zone.
If price respects this second QML zone, we could see another bearish move toward the 116k zone, possibly lower.
BTC/USDT: Define Your Next Winning MoveHere's the reality: While others panic and second-guess, successful traders recognize the blueprint when they see it.
The Setup That Separates Winners From Losers
Two major support zones (marked in blue) tell the complete story. My footprint CDV analysis confirms what institutional money already knows - these levels aren't suggestions, they're battle lines.
Your Proven Path Forward
Zone 1: Primary accumulation target - where smart money loads up
Zone 2: Final defense line - where rebounds launch
The Choice Is Simple
Execute at these levels with precision, or watch from the sidelines as others capitalize. My track record speaks for itself - these aren't hope-based predictions, they're data-driven opportunities.
What Happens Next
Follow this blueprint: You position at support, manage risk precisely, and capture the inevitable bounce that follows institutional accumulation.
Ignore it: Watch others profit while you chase price higher later.
Bottom Line
The market has drawn the map. The footprint data confirms the plan. Your success depends on one thing: execution when opportunity knocks.
The zones are marked. The analysis is complete. The choice is yours.

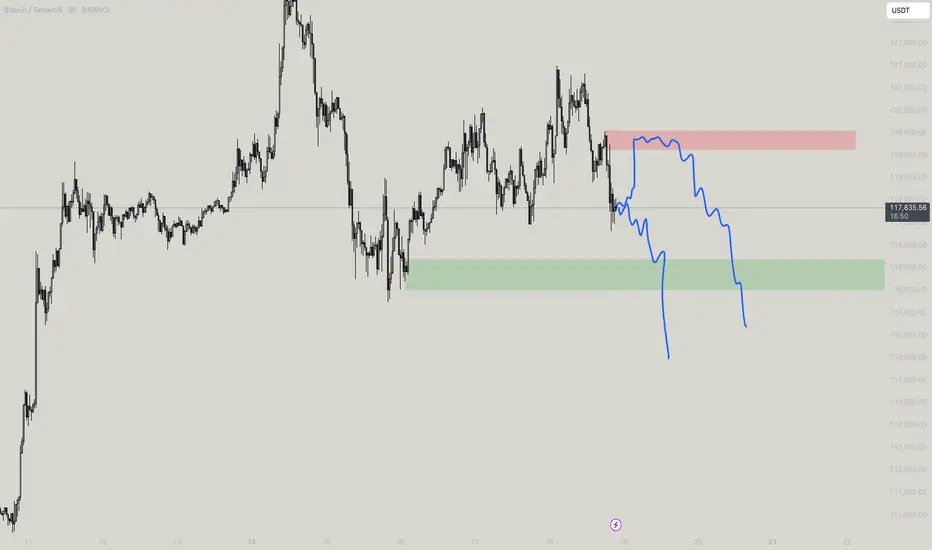
Bitcoin Liquidity updateCRYPTOCAP:BTC
📄 Update on liquidity movement and key liquidity cluster points
◀️ Summary of the first movement: A sale occurred at 121826 and a break happened at 117612, after which liquidity was collected between 116 - 115
◀️ After collecting liquidity, we mentioned that breaking 117612 would allow testing 119723, and that is what happened
⭕️ Now, a selling range has formed between 120813 - 121826, which is clear on the price chart and the way it bounced down
🟣 The current movement is confined between 118398 - 117612
📄 Regarding trading ideas:
⭕️ The thought here is to buy between 11600 - 114813 if a break occurs at 117612 and trading starts below it
⭕️ The second idea, in case this break does not happen, is to wait for confirmation of trading above 118398, and in this case, it's preferable to wait until Monday

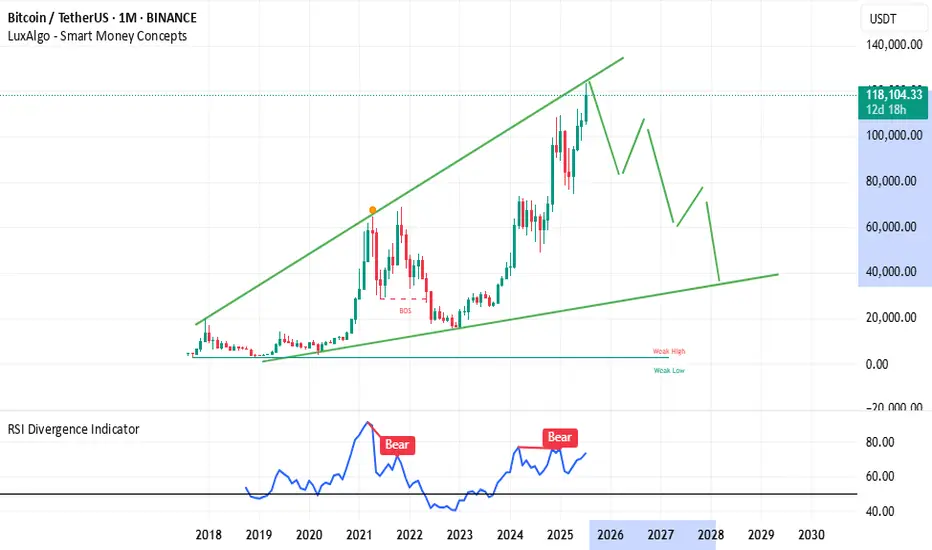
BTCUSDT 1 Month Trading Idea... for next 2 Years...I think BTCUSDT will go back to 30,000 - 40,000 USDT price range befor it will go back to 200,000 USDT
Altseason Starts Here? ETH Hits Critical Resistance!Ethereum has finally reached the upper resistance zone — and this could be the decisive moment for Altseason.
This level has historically acted as a major turning point for ETH. If it breaks and holds above this zone, we could see capital start flowing aggressively into altcoins.
🧠 Why it matters:
ETH reaching resistance usually signals a rotation phase from BTC to ETH.
If ETH breaks above, altcoins tend to follow with explosive momentum.
If it gets rejected, we may see a short-term cool-off.
This is the zone where narratives shift. Eyes on the breakout — or the rejection.

BTCUSDT: A Period of Adjustment and the Next TrendAfter a strong rally to record highs, BTCUSDT is currently entering a period of slight correction. The coin is now trading around 118,500 USD, down more than 0.57% on the day.
From a technical perspective, BTCUSD is moving within a narrowing price wedge, showing a slight downtrend. The support level at 116,500 USD is acting as a springboard for the Bulls. However, as the price approaches the tip of the wedge, a breakout may occur at any time, with two possible scenarios highlighted on the chart.
My personal outlook is that BTCUSDT will continue to decline in the short term before breaking out of the wedge in an upward direction. What do you think about BTCUSDT?
Please share your thoughts in the comments and don’t forget to like this post!
Wishing you all happy and successful trading!

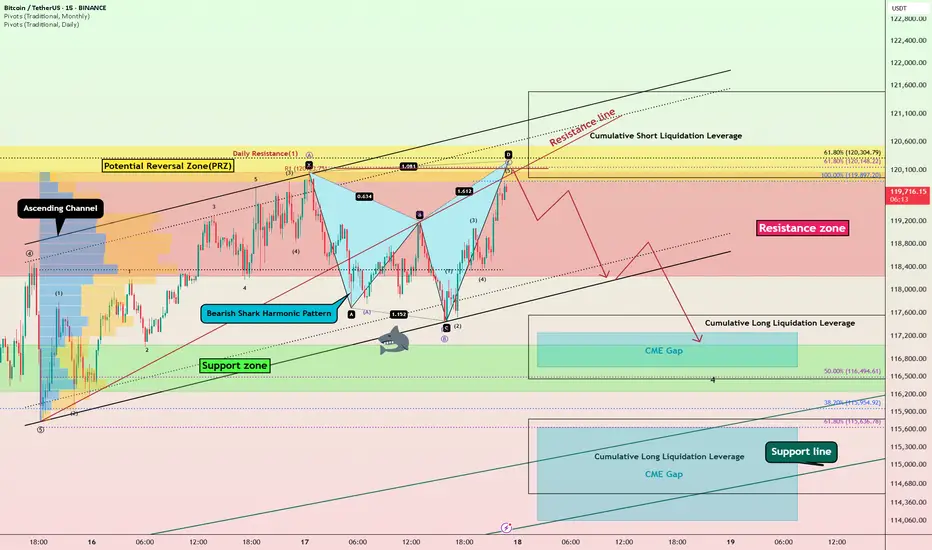
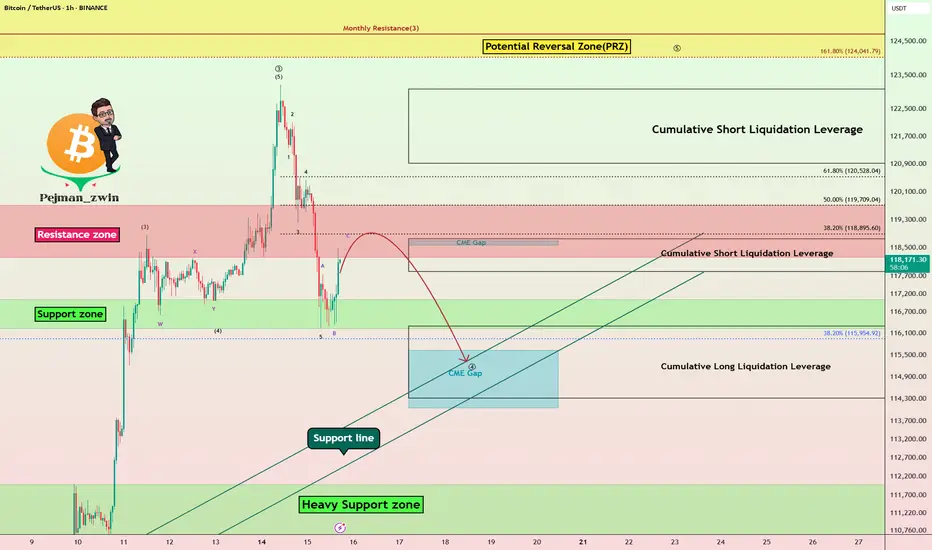
Bitcoin Bearish Shark Detected – CME Gap Below $115K in Sight?Today's analysis is on the 15-minute timeframe , following the previous analysis I shared with you on the 1-hour timeframe .
Bitcoin ( BINANCE:BTCUSDT ) is currently trading in the Resistance zone($120,100-$118,240) near the Potential Reversal Zone(PRZ) and Cumulative Short Liquidation Leverage($121,490-$119,965) .
From a technical perspective , it looks like Bitcoin is completing the Bearish Shark Harmonic Pattern on the 15-minute timeframe .
From an Elliott wave theory perspective, it looks like Bitcoin is completing the microwave 5 of wave C of the Zigzag Correction(ABC/5-3-5) .
I expect Bitcoin to start falling from the top of the ascending channel and at least decline to the lower line of the descending channel, and if the ascending channel breaks this time, we should wait for the CME Gap($117,255-$116,675)/CME Gap($115,060-$114,947) to fill.
Cumulative Long Liquidation Leverage: $117,556-$116,465
Cumulative Long Liquidation Leverage: $115,773-$114,513
Do you think Bitcoin can create a new ATH again?
Note: Stop Loss(SL)= $121,620
Please respect each other's ideas and express them politely if you agree or disagree.
Bitcoin Analyze (BTCUSDT), 15-minute time frame.
Be sure to follow the updated ideas.
Do not forget to put a Stop loss for your positions (For every position you want to open).
Please follow your strategy and updates; this is just my Idea, and I will gladly see your ideas in this post.
Please do not forget the ✅' like '✅ button 🙏😊 & Share it with your friends; thanks, and Trade safe.
Bitcoin Struggles Below $120K:Will the CME Gap Pull Price Lower?Bitcoin ( BINANCE:BTCUSDT ) has been experiencing a high momentum bullish trend in recent days, which few people expected, especially when it crossed $120,000 . However, in the past 24 hours , Bitcoin has fallen back below $120,000 .
Bitcoin is currently trading in the Resistance zone($119,720-$118,240) and Cumulative Short Liquidation Leverage($118,757-$117,829) on the 1-hour time frame .
In terms of Elliott Wave theory , Bitcoin appears to be completing a main wave 4 . Main wave 4 is likely to have a Zigzag Correction(ABC/5-3-5) .
I expect Bitcoin to attack the Support lines and fill the CME Gap($115,060-$114,947) in the next hour.
Cumulative Short Liquidation Leverage: $123,087-$120,922
Cumulative Long Liquidation Leverage: $116,305-$114,325
Do you think Bitcoin can create a new ATH again?
Note: Stop Loss(SL)= $121,000
Please respect each other's ideas and express them politely if you agree or disagree.
Bitcoin Analyze (BTCUSDT), 1-hour time frame.
Be sure to follow the updated ideas.
Do not forget to put a Stop loss for your positions (For every position you want to open).
Please follow your strategy and updates; this is just my Idea, and I will gladly see your ideas in this post.
Please do not forget the ✅' like '✅ button 🙏😊 & Share it with your friends; thanks, and Trade safe.
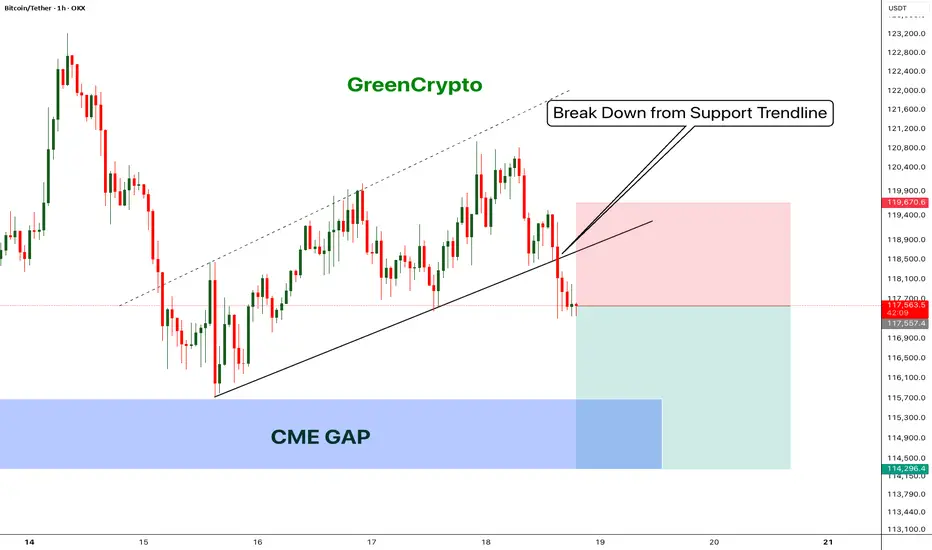
Bitcoin - Bears will push the price fill CME Gap- Bitcoin has broken down from the trending support,
- Price has been going down without any retracement on 1H candle.
- Looks like bitcoin will CME gap before going up further.
- A high risk Short Trade opportunity is here
Entry: 117,431
Stop Loss: 119,670
TP1: 116152.8
TP2: 114403.6
Move SL to Breakeven on TP1 hit
Don't forget to like and follow
Cheers
GreenCrypto
The Critical Blue Line – Will Bitcoin Soar or Sink
🔹 Bitcoin Technical Analysis – Key Blue Line, Bear Trap Possibility & Long-Term Scenario
On the Bitcoin chart, the blue horizontal level has acted multiple times as both support and resistance. The price has broken it several times but failed to sustain above, indicating high-volume decision-making zones by institutions and large players.
📉 Why this pattern keeps repeating:
Strong supply and demand concentration at this level.
Inability to break and hold shows market indecision.
Repeated fakeouts are likely used to shake out weak hands.
🔍 Important hidden scenario: Bear Trap Potential
If the price dips below the blue line but quickly reclaims it, it may form a bear trap, tricking short sellers into entering prematurely. This move could ignite strong bullish momentum from trapped sellers and renewed buyers.
🔮 If price holds above the blue line:
Signals market strength and potential bullish structure shift.
Targets:
109,800
117,200
120,000+ (Long-term)
📛 If support fails again:
Retracement toward the lower channel near 101,000 or lower is possible.
📊 Conclusion:
This zone is one of the most critical decision points in the current market. Traders should combine volume, candlestick behavior, and confirmation signals to avoid getting trapped by fake breaks

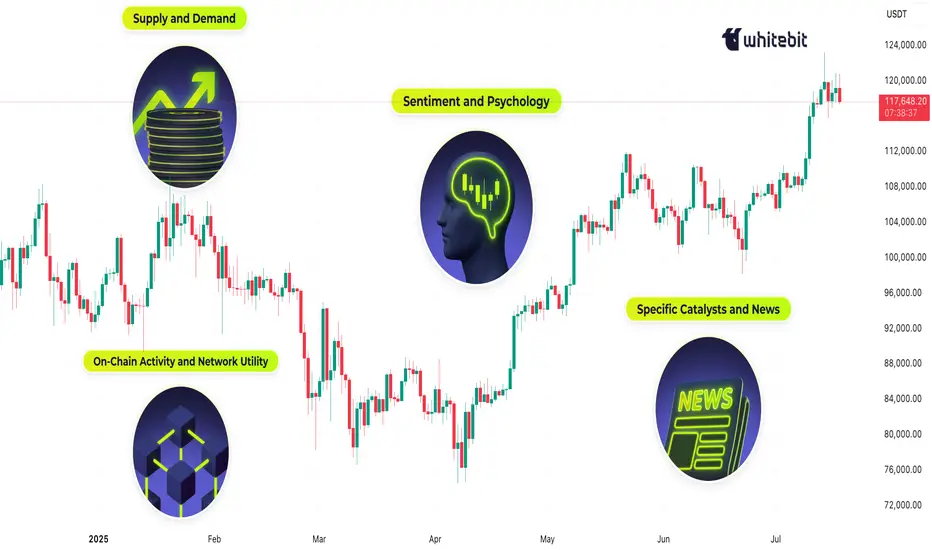
What Moves the Crypto Market?Hello, Traders!
If you’ve spent any time staring at crypto charts, you’ve probably asked: “Why is this happening?” And the truth is… there’s never one simple answer.
Crypto markets are complex, global, 24/7 systems. The forces behind a price move can be technical, fundamental, psychological or all at once. So let’s unpack what really moves this market.
1. Supply and Demand — The Fundamentals Behind the Volatility
At its core, crypto prices are governed by supply and demand. If more people want to buy than sell, the price goes up and vice versa. But it’s not that simple.
Take Bitcoin. It has a fixed max supply of 21 million, and most of those coins are already mined. But available liquidity on exchanges is much smaller and this is where things get interesting. During bull markets, demand surges while liquid supply dries up. That creates parabolic moves. Then you have supply unlocks, token vesting schedules, and inflationary emissions all of which affect how much of a coin is flowing into the market.
Example: When Lido enabled ETH withdrawals in 2023, it shifted the ETH supply dynamics, some saw it as bearish (more unlocked supply), others bullish (greater staking confidence).
2. Sentiment and Psychology: Fear & Greed Still Rule
If you want to understand the crypto market, start by studying people. Emotions drive decision-making, and crypto is still largely a retail-dominated space. Bull runs often start with doubt, accelerate with FOMO, and end in euphoria. Bear markets move from panic to despair to apathy. The crypto psychology chart rarely lies, but it always feels different in real time.
The classic “psychological numbers in trading”, like $10K, $20K, $100K BTC, often act as invisible walls of resistance or support. Why? Because traders anchor to these round levels.
👉 We’ve covered this phenomenon in detail in a dedicated post “The Power of Round Numbers in Trading.” Highly recommend checking it out if you want to understand how these zones shape market psychology and price action.
3. On-Chain Activity and Network Utility
Fundamentals matter. But in crypto, fundamentals are on-chain. The transparency of blockchain networks provides valuable insights into fundamental usage and investor behavior, which often foreshadow price trends. On-chain metrics such as active addresses, transaction volumes, and wallet holdings offer insight into the health and sentiment of the crypto ecosystem:
Network Usage (Active Addresses & Transactions): A growing number of active addresses or transactions might indicate rising network demand and adoption. Empirical studies have found that BTC’s price strongly correlates with its on-chain activity – increases in the number of wallets, active addresses, and transaction counts tend to accompany price appreciation.
Exchange Inflows/Outflows: Tracking the movement of Bitcoin or Ether in and out of exchanges provides clues to investor intent. Large outflows from exchanges are often bullish signals – coins withdrawn to private wallets imply holders are opting to HODL rather than trade or sell, tightening the available supply on the market. For example, in late March 2025, as Bitcoin neared $90,000, exchange outflows hit a 7-month high (~11,574 BTC withdrawn in one day) mainly by whale holders, indicating strong confidence.
Mining Activity and Miner Behavior: In Proof-of-Work coins like Bitcoin, miners are forced sellers (regularly selling block rewards to cover costs), so their behavior can impact price. Periods of miner capitulation, when mining becomes unprofitable and many miners shut off or sell holdings, have historically aligned with market bottoms.
For example, in August 2024, Bitcoin experienced a miner “capitulation event”: daily miner outflows spiked to ~19,000 BTC (the highest in months) as the price dipped to around $ 49,000, suggesting that miners had dumped inventory as profit margins evaporated. Shortly after, the network hash rate quickly recovered to new highs, indicating that miners’ confidence was returning, even as the price was low.
Final Thoughts
In conclusion, the crypto market’s price movements are driven by a complex interplay of factors… Market sentiment and psychology can override fundamentals in the short run, leading to euphoric rallies or panicked crashes. On-chain metrics provide the ground truth of user adoption and big-holder behavior, often signaling trend changes before they happen. Halvings and tokenomics remind us that the code underlying these assets directly affects their value by controlling supply. And finally, specific catalysts and news events encapsulate how all these forces can converge in real time.
For enthusiasts, understanding “what moves the crypto market” is crucial for navigating its volatility. Crypto will likely remain a fast-evolving space, but its price movements are not random. They are the sum of these identifiable factors, all of which savvy market participants weigh in their quest to predict the next move in Bitcoin, Ethereum, and beyond.
What do you think? 👇🏻
BTC - 115 - 113k when?Looks likely today or tomorrow, Just in case if it traps you know how it can and if not you know the fall!
Last chance to make profit from BTC with buying positionBullish flag
Strong resistance breakout
2 bull points
Position trade spot buying
Bitcoin completing timecycle on oct 2025 after that it would be 4th time if market again crash for around 70%
Manage your risk in both future and spot trading
Note: NO analysis would 100% profitable trading is the game of probability and risk management so follow your trading plan with proper risk reward and win rate.

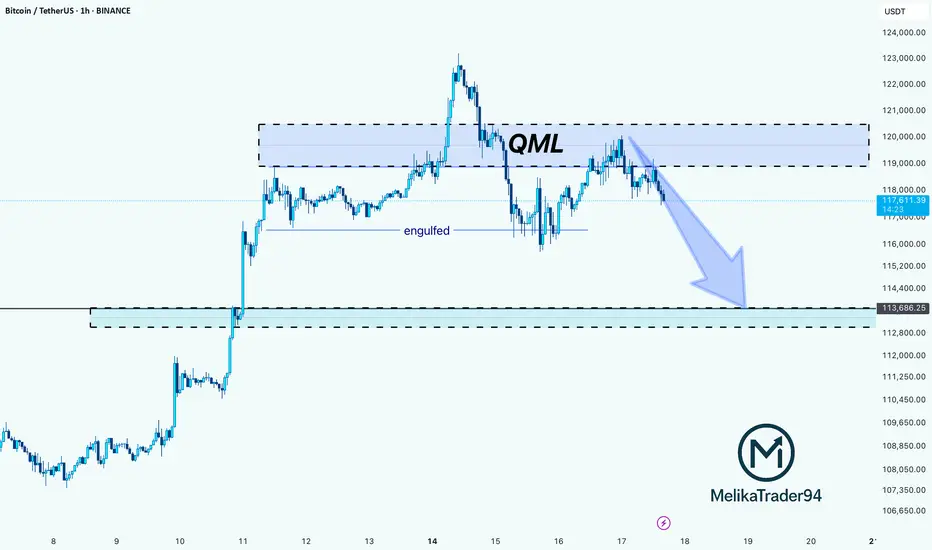
BTC Rejection from QML Zone: Towards on 113,600 SupportHello guys!
This chart shows a QML (Quasimodo Level) setup in play on Bitcoin. After price created a new high and engulfed the previous structure, it returned to the QML zone (around $119K–$121K) and reacted exactly as expected: strong rejection.
The sharp selloff from the QML area confirms a bearish shift in structure, and now the momentum is tilted to the downside.
The next key level to watch is the 113,600 demand zone, where the price may either bounce or consolidate.
As long as the price stays below the QML zone, bears have control.
You should consider that the main trend is bullish, and the stop loss may be hit, so please manage your risk!