BTCUSDTHello Traders! 👋
What are your thoughts on BITCOIN?
Bitcoin has entered a corrective phase after printing a new all-time high and reaching the top of its ascending channel.
This pullback is expected to extend towards the key support zones, and in a deeper scenario, it could test the bottom of the channel.
As long as Bitcoin holds above these support areas and reacts positively at the lower boundary of the channel, the broader outlook remains bullish, with potential for new all-time high
However, a decisive break below the channel’s bottom would invalidate the medium-term bullish scenario and raise the risk of a deeper correction.
The current correction may provide a valuable opportunity for medium- to long-term traders to re-enter the market.
Don’t forget to like and share your thoughts in the comments! ❤️
BTCUSDT

BTC 4H Analysis – Key Triggers Ahead | Day 27💀 Hey , how's it going ? Come over here — Satoshi got something for you !
⏰ We’re analyzing BTC on the 4-hour timeframe timeframe .
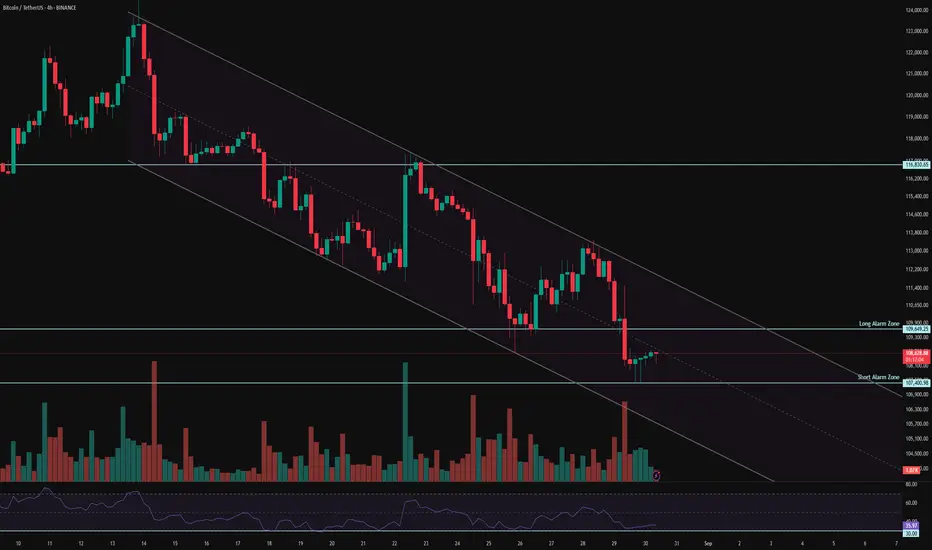
👀 In the 4-hour timeframe of Bitcoin, we can see that Bitcoin is moving inside a descending channel where each time it touches the top or bottom of the channel, it shows a reaction to these levels and then leaves a reversal move. Currently, Bitcoin has an important support at the 107,400 area, and if this level breaks, it can move towards its lower supports. On the other hand, there is a resistance at the 109,700$ area, and breaking this resistance could give us a long position.
⚙️ Our key RSI zone is at the 30 level, and the fluctuation is ranging above this level in a close environment. With an increase in volatility and selling pressure, if RSI passes below 30, it could be a confirmation for a deeper correction.
🎮 With a Fibonacci tool, we are going to identify Bitcoin’s key levels. The Fibonacci is drawn from the 117,000$ breakout area down to the 107,300$ support area. The price behavior at the 0 and 0.236 levels can help us for taking trades.
📊 In the 4-hour timeframe of Tether dominance, we can see that similar to Bitcoin but with an ascending difference, it is moving inside a channel. The 4.52% area is very important, as the midline of the channel is located here. In the previous leg of movement, it also reacted to this area and got rejected. Breaking this area could bring more selling pressure into the market and also on Bitcoin.
🕯 The size and volume of the red candles at the breakout zones are getting bigger, each time accompanied by higher selling volume. The presence of maker buyers is seen between the two highlighted zones. With an increase in Bitcoin’s volume, it can start its main trend. Keep in mind that we are in the holiday season.
🔔 The zones considered as alarm zones are the 107,400$ area and the 109,600$ area. The price action in these zones can help us with our trades. With an increase in Bitcoin’s volume, it could break one of these levels and move either up or down. Keep in mind that August has ended, and in the new month we have 3 important news events from the Federal Reserve, which could either bring strong inflows into the market or pull money out of it.
❤️ Disclaimer : This analysis is purely based on my personal opinion and I only trade if the stated triggers are activated .
BTCUSD: Bullish Reversal from Support with Breakout TargetPotential Targets:
First Target: The recent high around $116,000.
Second Target: $122,00 and a move toward the next resistance levels from the previous uptrend.
Invalidation:
This bullish view would be invalidated if the price breaks and closes decisively below the key support level at ~$106,000.

Bitcoin is bullish now & many Traders don't see it !!!Well , so far, the price has broken the triangle and the pullback is being completed. From here on, if nothing unusual happens, we can be hopeful that Bitcoin will reach $150k.
previous analysis

A Question many people don't know the answer to.In this post we’ll answer a question many people don't know the answer to, and provide an in-depth explanation of why the crypto market is bound to a 4-year cycle.
🔸The answer:
-The market is tied to a key event — the Bitcoin Halving . This is when the block reward for mining Bitcoin is cut in half every 4 years. Mining is the lifeline that brings Bitcoin into circulation. Without it, there would be no supply entering the market.
But is this still effective now, given that most of Bitcoin’s supply is already mined?
The total supply of Bitcoin is fixed at 21 million, and so far, around 19.9 million have already been mined. That leaves only about 1.1 million Bitcoin still to be mined — scheduled, with halvings, until the year 2140.
I know what you’re thinking … Why does the halving still impact market behavior if the remaining supply is so small and its effect seems limited?
-History shows that after every halving, the market tends to rise for about a year and a half. This proves that investors wait for the halving to take place, monitor the network’s smooth performance during the event, and once they confirm no issues exist, they begin injecting liquidity into the market.
------------------------------------------
Is there a scenario where the 4-year cycle could change?
It’s difficult, but yes …
Why? Because since Bitcoin’s inception, its price cycle has been tied to the halving. This pattern has been consistent since 2011, across three full cycles, and now we are in the fourth.
However, the halving itself has become a symbol of trust and security for investors. Every successful halving event reinforces confidence in Bitcoin’s scarcity and strength. That’s why the 4-year rhythm will only change if another factor emerges strong enough to rival the influence of the halving.
Signs of such a new factor already appeared in 2025 — with the U.S. President’s support for Bitcoin and the growing trend of corporations and financial institutions purchasing it, alongside increased transparency in declaring holdings and reserves.
This shift is crucial. When supply moves from scattered hands (individuals) to stronger hands (corporations) , and holdings are publicly disclosed, it strengthens trust in the Bitcoin network and reduces the wild volatility that individuals once caused.
Conclusion : The 4-year cycle could evolve in the future, especially if supportive policies accelerate and corporations continue to accumulate Bitcoin in massive quantities starting from the next cycle.
Best regards
Cecilione🎯

BTCUSDT IS JUST ACTING THE WAY IT SHOULD.Most Traders don't understand basic Trading Principles. I have been trading Crypto since 2015- 10 good years but what I have realised is most people get the basics wrong.
I have been asked countless times in the past month that BTC is becoming unpredictable, it's a gamble, it's manipulated.
T he Trendline says it all. Not only for this top, but all the previous tops.
Guys maybe it's time to brush up the basics. I have developed proprietary Algorithms for HFTs, Trading desks that deal with Millions in volume every single day but never have I ever stopped looking at the basics. Price is everything guys.
I am always here for any genuine questions. You can comment or message me.

BTCUSDT - Strong Downtrend?On the 8H chart of BTCUSDT, a clear descending channel is visible, with key support and resistance levels at 113,200 USD and 105,200 USD. After failing to break the resistance at 113,200 USD, BTCUSDT continued to decline and is now heading toward the support zone at 105,200 USD. Both the EMA (34) and EMA (89) indicators are showing a bearish signal, with EMA (34) below EMA (89), confirming strong selling pressure.
News Impact:
Recently, concerns about cryptocurrency regulations from major countries, especially the US, have caused BTCUSDT to drop sharply. Additionally, adjustments in global financial markets have also impacted investor sentiment, leading to a sell-off of Bitcoin.
Trading Strategy:
Given the current downtrend, traders may consider opening short positions as the price tests the 113,200 USD level again. The next target for the downtrend is the 105,200 USD support level. Place a stop loss if the price unexpectedly breaks above 113,200 USD.

BTC/USDT Bitcoin is at a historical turning pointHello to you all,
The Bitcoing is a turning point Daily, Weekly, and Monthly charts. Also, There is a double top pattern.
Thanks for watching I appreciate it.
MarketsTitan

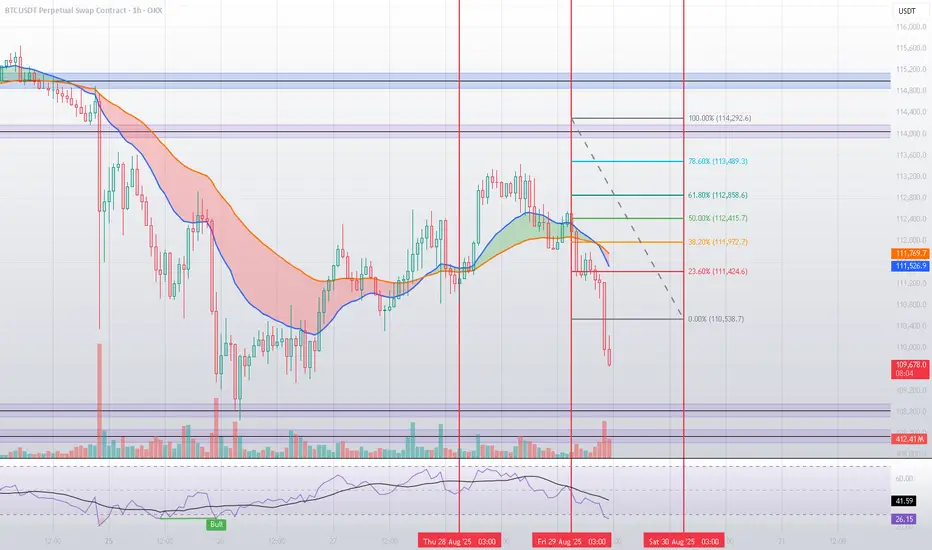
Technical Analysis for BTC/USDTBased on mathematical and statistical models, along with technical tools such as Fibonacci retracement levels and moving averages, Bitcoin is currently undergoing a bearish correction after failing to break through the key resistance at $114,046.
🔹 Interaction with Fibonacci Levels
In the previous analysis, we highlighted the importance of Fibonacci retracements in anticipating turning points. Recent price action confirmed this, as Bitcoin repeatedly reacted to these levels. The 61.8% retracement at $112,858 acted as a strong resistance, turning into a supply zone where sellers regained control.
Moreover, price failed to approach the 100% retracement at $114,292, reflecting a clear weakness in bullish momentum at higher levels. After that, Bitcoin broke below the 38.2% retracement at $111,972, triggering a sharper downside move — once again proving the reliability of statistical models in mapping market behavior ahead of time. 📉
🔹 Key Support Levels
$108,832: The first major support, aligning with a previous liquidity zone where price showed strong reactions. 🛡️
$108,353: A stronger support level. If broken, this could lead to a deeper bearish extension toward $107,500 or lower.
🔹 Technical Indicators
The RSI dropped to low levels (41.6 and even near 26.4 at certain points), signaling oversold conditions ⚠️, which may lead to a short-term rebound from the supports.
The 20 & 50 EMAs have crossed bearishly, confirming the downward bias.
🟢 Bullish Scenario
To regain momentum, Bitcoin must reclaim the $111,400 – $111,900 area and then retest the $112,800 (61.8% Fibonacci) level. Only a sustained breakout here would open the way toward the major resistance at $114,046. 🚀
🔴 Bearish Scenario
Failure to stabilize near current levels could push price down to $108,832, followed by $108,353. A breakdown below the latter would likely accelerate bearish momentum significantly.
✅ Conclusion
Bitcoin failed to reach the key resistance at $114,046 and gradually lost strength as it broke through crucial Fibonacci levels. The market is now testing critical supports at $108,832 and $108,353, which will determine whether a rebound is possible or if further downside is ahead. At this stage, caution is essential ⚖️, with close monitoring of liquidity and momentum.
BTC hunting for liquidity... don't catch a falling knife. BTC made a CHOCH on lower time frames and is now on a downtrend. The daily trend is still intact; however, the retracement here can be a great BTD opportunity.


$BTC: -$4000 in 10min – panic or opportunity?Here's our take:
🔹 Historically, such sharp CRYPTOCAP:BTC drops used to cause -20% to -40% crashes in altcoins.
Now, some alts are holding, others correcting mildly, and a few are even rallying.
🔹 In the last 24 hours, $840M was liquidated.
Roughly 80% were long positions.
Historically, reversals often start after $1.1–1.3B in total liquidations.
🔹 BTC Dominance (BTC.D) and Tether Dominance (USDT.D) are forming readable, consistent patterns.
👉 Current thesis: OKX:BTCUSDT will likely continue its movement inside the falling purple channel.
If price reaches $107–108K, we’ll consider closing our short bot to reassess market conditions.
💬 What’s your perspective? Share below.
______________
◆ Follow us ❤️ for daily crypto insights & updates!
🚀 Don’t miss out on important market moves
🧠 DYOR | This is not financial advice, just thinking out loud.

BTC: Major RSI divergence - Next stop around $69K?Bitcoin is showing strong warning signals that the current bull run may be ending. On the weekly chart, we can clearly see a massive RSI bearish divergence, similar to what happened before previous cycle tops.
Today’s BTC options expiry added extra pressure, and with no quick resolution in sight for the Ukraine war, alongside worsening global economic conditions (trade wars, inflation, tightening liquidity), the macro environment does not favor sustained risk-on sentiment.
The chart highlights a likely correction path, with the next major support zone sitting around $64K–69K (previous resistance turned support). If this level breaks, further downside cannot be excluded.
For now, caution is advised – this may mark the end of the bull run and the start of a new accumulation phase.

Bitcoin Breaks Below Support · Altcoins Market UpdateBitcoin is breaking daily right now below EMA89. We are seeing a full red candle with rising bearish volume. Almost $1 Billion worth of LONGs have been liquidated. When this much is liquidated the market tends to turn; but the wick, the low, the flush can go much longer but it can also end tomorrow or today. What to expect?
The next support is MA200 and this level sits around $100,800. Think of this, regardless of what happens short-term, Bitcoin isn't likely to move below $100,000. If Bitcoin ever does move below this level, consider it a very strong buy opportunity. If it goes below, it will recover in a flash.
Before MA200 we have a support level around $105,386. So, current prices, $105,000 and $102,000 to $100,000 are the main levels to watch for.
At the first signal of recovery, buy strong and go LONG. We will try to catch the reversal for this retrace and drop. We will wait for the bigger correction around $155,000 for the SHORT experience. We are not there yet. Too many altcoins at the bottom we will short the bigger picture.
Bitcoin is turning bearish right now but this is still a short-term development. The bearish signals are now confirmed and a close below $111,111 today would imply lower prices. The levels above become relevant.
Thinking of the $124,000 top, a retrace can go between 15% and 30%. A 15% retrace would mean a price of $105,000. A 30% retrace would mean a price of $87,000. While this is possible, this isn't a likely scenario or too early to call it. Support around $100,000 is just too strong. Give Bitcoin and the altcoins market just a few days and it will continue to grow. Patience is key.
Namaste.

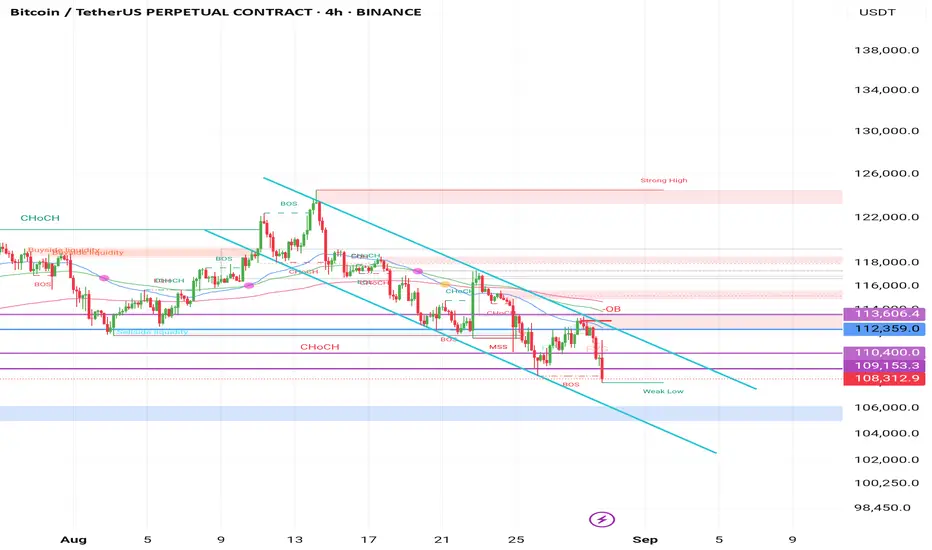
Bitcoin 4H Update – Breaking Key Support ZoneBitcoin continues to trade within the descending channel on the 4H chart.
Price has now broken below the 110,400 – 109,150 support area and is testing lower liquidity around 108,200.
🔹 Bearish outlook:
If the breakdown holds, the next targets lie around 107,000 – 105,500, where deeper liquidity zones may provide support.
🔹 Bullish opportunity:
A quick recovery above 109,150 and a retest could trigger a bounce toward 111,500 – 112,300 as short-term relief.
Currently, momentum favors the downside, but traders should watch how price reacts at the 108,200 – 107,000 zone for potential reversal or continuation signals.
BTCUSD Faces Mid-Band Rejection: Deeper Retracement incoming Price is showing rejection around the mid-range of its volatility bands after failing to sustain above the $112,800 zone, suggesting a potential continuation lower. The setup aligns with multiple bearish signals favoring downside momentum.
✅ Bearish Confluences:
Fibonacci Resistance: Price rejected just below the 38.2% retracement level at $114,619, failing to reclaim higher ground.
Lower High Structure: Market continues to print lower highs, reinforcing the short-term bearish trend.
Volatility Band Pressure: Rejection from the mid-band area highlights weakening buy-side momentum and strengthens the case for further downside.
🎯 Fibonacci-Based Targets:
TP1 – $111,016 (38.2%): First support test within the lower range.
TP2 – $109,903 (61.8%): Deeper retracement target in line with bearish continuation.
TP3 – $108,102 (100%): Full measured move completion toward the lower volatility band.
SL: Placed above $114,620 to invalidate the short thesis in case of bullish breakout.

BTCUSDT Market Analysis UpdateHi everyone, I hope you are doing well and I have put my opinion in Bitcoin price on the chart for you. and hope this helps you! Simple, concise, useful
BTC is still trading within a clear bullish market structure, supported by strong HL formations and trendline confluence. At the moment, my main focus is on the Fair Value Gap (FVG) below current price. I expect BTC to revisit this imbalance before continuing the move upward.
The liquidity pool around 82,490 is also important. Personally, I don’t expect price to sweep that level immediately. However, if it does get taken, in my view it would likely serve as the final liquidity grab before resuming the broader uptrend. This makes 82,490 a key level to watch — either it remains untouched while we push higher, or if price sweeps it, the move could act as fuel for the next bullish leg.
From a higher timeframe perspective, the market remains bullish. The structure is intact, RSI is holding mid-range without major bearish divergence, and trendline support has not been broken. Volume also supports this idea — it’s decreasing and showing divergence, but this doesn’t signal a reversal, only a healthy consolidation while holding the bullish trend.
In summary:
Main target: fill the nearby FVG before continuation.
Key liquidity zone: 82,490 (less likely to be taken now, but if it happens, I consider it the last liquidity grab).
Bias: still bullish, expecting higher levels once short-term imbalances are resolved.
Weekly:
As long as BTC holds its HLs and respect the FVG zone, I continue to look for upside continuation — potentially well beyond current levels.
That’s my current view on BTC. Let me know your opinion below 👇
Best regards

ETH 1H Analysis – Key Triggers Ahead | Day 6💀 Hey , how's it going ? Come over here — Satoshi got something for you !
⏰ We’re analyzing ETH on the 1-hour timeframe timeframe .
🔭 On the 1H timeframe for Ethereum, we can observe that ETH broke its midline to the downside and moved toward the bottom of the box. With the slightly higher-than-expected U.S. inflation news, Ethereum bounced again from the bottom of its box, and now we need to see whether it can consolidate above the midline or not.
⛏ The key RSI levels are at 50 and 30, and once the oscillation surpasses these thresholds, Ethereum can begin its main move.
💰 The volume and number of red candles increased after the midline break, accompanied by selling pressure. The volume and size of Ethereum’s reversal candles can show us the strength of the rebound and the strength of the box bottom, since the bottom has not been lost yet.
📊 On the 1H ETHBTC chart, we can observe that if the bottom of the 1H box at 0.03972 is lost, more Ethereum will be sold and converted into Bitcoin. This index reflects the relative value between ETH and BTC. Breaking this marked level could serve as a confirmation for a short trade on Ethereum.
💡 The Ethereum alert zones remain the same as before, with the difference that for an early trigger we can consider a break and consolidation above the midline, which is relatively risky.
❤️ Disclaimer : This analysis is purely based on my personal opinion and I only trade if the stated triggers are activated .

BTC 1H Analysis – Key Triggers Ahead | Day 26💀 Hey , how's it going ? Come over here — Satoshi got something for you !
⏰ We’re analyzing BTC on the 1-hour timeframe timeframe .
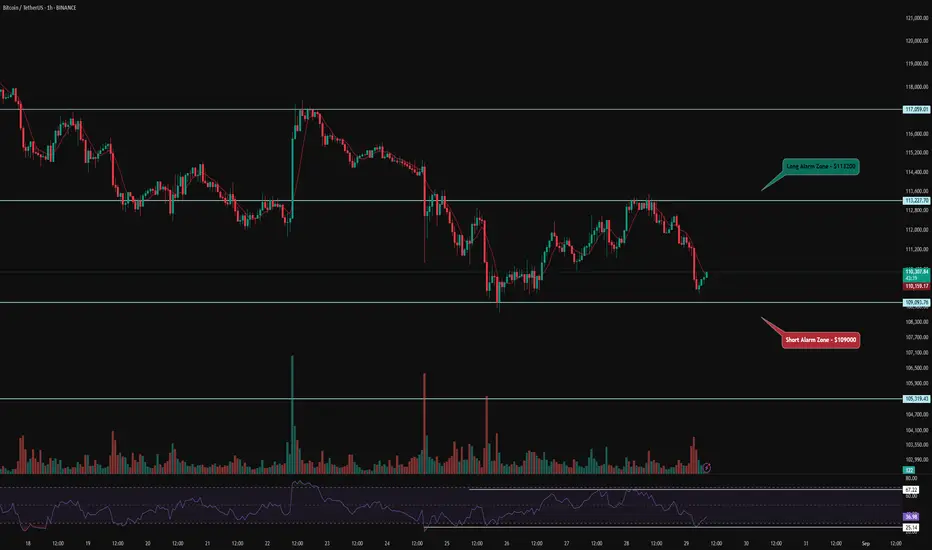
👀 On the 1H timeframe for Bitcoin, we can observe that BTC was rejected from the alert zone we had previously marked and moved downward. With this rejection, the selling volume and the size of red candles increased slightly. Currently, Bitcoin is sitting at its alert zone, and we need to see whether it will find support here or lose this support and go into a deeper correction.
⚙️ The key RSI levels are 30 and 70. Once the oscillation surpasses these levels, Bitcoin can start its main move and give us a position.
🕯 The size and volume of red candles have increased considerably, and selling pressure is being applied more easily each time. The green reversal candles are smaller compared to the red ones, and sellers’ tickers are consistently pushing the price downward with less resistance.
💵📊 On the 1H Tether Dominance chart ,we can see that Tether Dominance has reacted four times to this resistance zone, and right now we are at the top of Tether Dominance and the bottom of Bitcoin. If Tether Dominance gets rejected from this area, Bitcoin could find support and move upward. However, if this zone is broken with strong whale candles, heavy selling pressure could flow into Bitcoin. Keep in mind that this is a major resistance zone for Tether Dominance and will not be broken easily.
🪙📊 On the 1H Bitcoin Dominance chart ,we observe that at the same time Bitcoin prints green reversal candles and Tether Dominance shows red rejection candles, Bitcoin Dominance itself is forming a green structure. This means Bitcoin’s weight in the market is increasing. Now we need to see whether the market maker supports Bitcoin or not.
🔔 The Bitcoin alert zones are still the same as yesterday. If price reacts with a breakout confirmation, trading setups could form. Keep in mind that it’s the weekend, so avoid taking unusual or overly risky trades.
❤️ Disclaimer : This analysis is purely based on my personal opinion and I only trade if the stated triggers are activated .
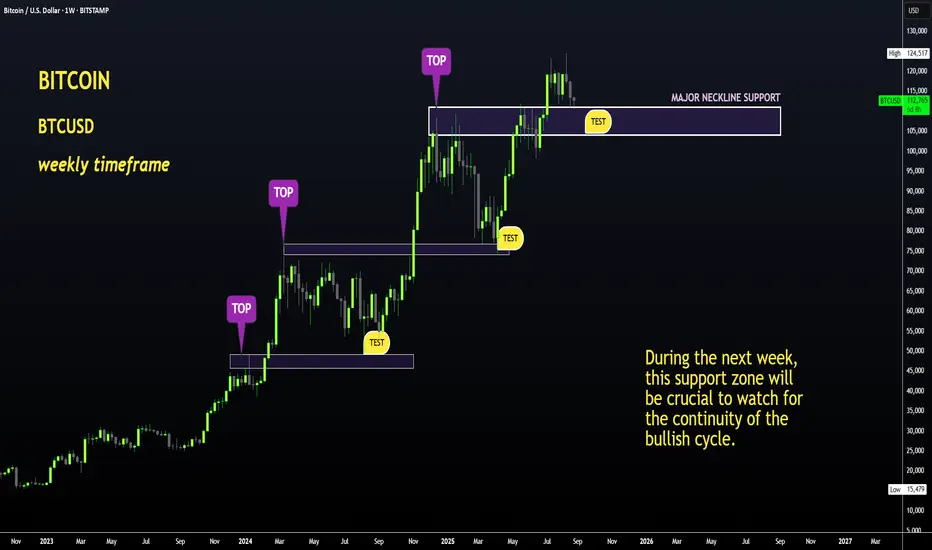
BTC in Trouble if THIS Support Breaks !Hello BTC Watchers
The previous update on Bitcoin was on how we may expect the altcoin market to play out during the next few weeks. (Find it here):
Now, if we look at Bitcoin in the weekly timeframe, the price is trading right on top of a KEY support zone. Here, we can either see a dip - marking the start of the bearish cycle OR the price can maintain this level and perhaps even push towards a higher high. This will all depend on the SUPPORT ZONE, and if the weekly candle will close ABOVE or BELOW this zone.
This would be between these zones:
Interestingly enough, we've extended to a full 2.0 on the Fibonacci retracement level. This will be very helpful in determining major bounce zones during the bearish season:
The next week will be vital! Update to follow at the end on the week on the progress of Bitcoin.
BTC NEW WHALE CANDLE CAN BRING BTC TO 117KBTC did fail to confirm the 113K Target.
But there is still a good chance BTC will return with a whale buying effect to 117K.
117K is an important test level.

BTC Still Bullish, Short-term CorrectionAs you can see in this chart below, next btc strong support is at 86,000.
From there, I expect another leg up towards its next fib ext. level target

Bitcoin (BTC/USDT) – 4H Chart Update !!Bitcoin (BTC/USDT) – 4H Chart Update
BTC is trading near $110,000 and respecting a descending trendline. The price is currently consolidating near support with RSI around 40, showing slight weakness.
Immediate Support → $109,456
Long-term Support → $98,376
Immediate Resistance → $112,935
Long-term Resistance → $122,879
Possible Scenarios:
Bullish Case (Long Setup):
A breakout above $112,935 could open doors to $116,818 → $120,001 → $122,879.
Long entry valid above breakout confirmation, SL below $109,456.
Bearish Case (Short Setup):
Failure to hold $109,456 could drag price down to $105,189 → $102,154 → $98,376.
Short entry valid below $109,456, SL above $112,935.
The market is at a critical decision zone – waiting for a breakout/rejection will give clearer direction.
DYOR | Not Financial Advice
