$BTC/USDT LONG IDEA – 3-DAYBitcoin is currently trading inside a strong **higher-timeframe support and reversal zone around $80,000–$82,000**, which also aligns closely with the **200 EMA** on the 3-day chart. This area has acted as a major demand zone in the past, and price is now showing stabilization after a sharp sell-off. As long as BTC holds above this zone, the structure supports a **bounce-based long setup** rather than continuation to the downside.
We are planning a **long position near the support zone**, expecting buyers to defend this level. The **stop loss** should be placed **below $79,900**, as a clean break below this level would invalidate the support and open the path toward the $74,500 area. For the upside, the **final target** is set at **$92,000–$94,000**, which is the nearest major resistance and previous supply zone on the higher timeframe. This setup offers a **clean structure-based long** with clear invalidation and a favorable risk-to-reward if support holds.
**Trade Summary (for TradingView):**
• Direction: **LONG**
• Entry Zone: **$83,000 – $85,000**
• Stop Loss: **$79,900**
• Final Target: **$92,000 – $94,000**
• Bias: **HTF support + 200 EMA bounce**
Btcusdtrade

bullish vs bearish scenariosThe chart shows a **strong bearish move** from early November, with price falling from the **$100k–$105k area** down into the **mid–high $80k range**.
* **Market structure:**
* A **BOS (Break of Structure)** is marked after price fails to hold higher levels, confirming a bearish shift.
* Following the BOS, price accelerates downward with consecutive red candles.
* **Fair Value Gap (FVG):**
* A **Daily FVG** (blue highlighted zone) is marked roughly around **$96,000–$98,000**.
* This zone represents a potential **bearish mitigation / resistance area** if price retraces upward.
* **Current price area:**
* Price is hovering around **$88,400**, shown by the red dotted horizontal line.
* Recent candles indicate **sideways consolidation** after the sharp sell-off.
* **Downside target:**
* A labeled **“NEXT DOL / TARGET”** is drawn near **$80,500**, suggesting a possible next liquidity draw or downside objective if bearish momentum continues.
* **Key takeaway:**
* Structure remains **bearish below the Daily FVG**.
* A retrace into the blue FVG could attract sellers, while failure to hold current consolidation increases the probability of a move toward **~$80k**.

BTC/USDT Setup Confirmed – Capital Flow Points to Upside!🚀 BITCOIN (BTC/USDT) Capital Flow Blueprint: Smart Pullback + Liquidity Grab Strategy
📊 Setup Overview
Asset: BTC/USDT | Strategy: Swing Trade | Bias: Bullish with Pullback Confirmation
🎯 Trading Plan Thesis
Bullish structure confirmed with Volume-Weighted Moving Average (VWMA) Pullback + Liquidity Zone Grab. Bitcoin continues to accumulate at demand zones while respecting higher timeframe resistance. This layered entry strategy captures value during temporary pullbacks before the next impulse.
Current Market Context: BTC trading near $109,768 (as of November 1, 2025)
📍 Entry Strategy: Multi-Tier Limit Orders (Layering Method)
Think of this as smart accumulation zones rather than one aggressive entry:
Layer 1: $106,000-107,000 (Deep pullback target)
Layer 2: $107,500-108,000 (Mid-level support)
Layer 3: $108,500-109,000 (Current support zone)
Ratio: Scale position size across layers (30%-40%-30% allocation suggested). This approach reduces timing risk and averages your entry price during volatility.
🛑 Stop Loss: Risk Management First
SL Level: $105,000
Rationale: Sits below the 4-hour swing low, providing buffer for wick rejection while maintaining favorable risk-reward ratio
⚠️ Risk Disclaimer: Stop loss placement is YOUR decision based on your account size and risk tolerance. Never risk more than 2% of your trading capital per trade.
📈 Take Profit: Multi-Exit Strategy
Target: $119,000
Confirmation: ATR (Average True Range) acting as resistance + Overbought RSI confluence + Previous resistance break
Exit Plan:
Partial 1 (50%): $115,000 (Take some profits early)
Partial 2 (30%): $117,000 (Lock in most gains)
Final (20%): $119,000 (Let runners chase the moon 🌙)
⚠️ Risk Disclaimer: Profit targets are based on technical analysis. Market conditions change. Take profits at levels that suit YOUR strategy and risk profile.
🔗 Correlated Pairs to Monitor (Market Ecosystem Check)
Direct Correlation Pairs:
ETH/USD ($3,865): Major altcoin bellwether. Watch 1-4 hour RSI divergence
BNB/USD (~615): Binance ecosystem health indicator
SOL/USD (~245): Alt season strength confirmation
Inverse Watch:
USDT Dominance: If BTC dominance drops >59%, profit-taking likely incoming
VIX Index: Higher volatility = more chop (avoid during spikes)
💡 Key Technical Points
✅ Volume Profile: Sellers exhausted at $105K-106K zone
✅ Order Flow: Institutional absorption at weekly support
✅ Micro Resistance: $112,000-113,500 (breakout confirmation needed)
✅ Macroeconomic: Fed sentiment + Bitcoin ETF flows = liquidity tailwind
⚡ Pro Tips for Better Execution
Timeframe: Confirm entry on 4-hour chart before scaling on 1-hour bounces
Volume Filter: Only take Layer 1/2 if volume > 20-day average
News Calendar: Avoid entries 2 hours before major economic data
Trail Stop: Move stop to breakeven once price hits Layer 3 + $1,000
🎁 Community Love
✨ "If you find value in my analysis, a 👍 and 🚀 boost is much appreciated — it helps me share more setups with the community!"
#Bitcoin #BTC #CryptoTrading #SwingTrade #TechnicalAnalysis #LiquidityGrab #VWMA #CryptoChart #TradingStrategy #CryptoSignals #LayeringStrategy #BTCUSD #CryptoAnalysis #TraderLife #AlgoTrading

BTC/USD Liquidity Blueprint – Are You Reading the Flow Right?🎯 BTC/USD: The Great Heist Setup | Swing Trade Blueprint 💰
📊 Market Overview
Asset: BTC/USD (BITCOIN/US DOLLAR)
Market: Cryptocurrency
Trade Type: Swing Trade
Strategy Style: The Thief Method™ (Layered Entry System)
🎨 Technical Setup
📈 Market Structure: BULLISH CONFIRMED
The Simple Moving Average is showing strong accumulation patterns with a healthy pullback structure. Bulls are loading up their bags like thieves preparing for the ultimate vault heist! 🏃♂️💨
Key Technical Indicators:
✅ SMA showing strong bullish accumulation
✅ Pullback phase completed
✅ Higher lows formation intact
✅ Volume supporting upside momentum
🎯 The Heist Plan: Entry Strategy
💎 The Thief Layered Entry System
Instead of going all-in at one price (that's how amateurs get caught! 👮), we're using a professional layered approach with multiple buy limit orders:
Entry Layers:
🔹 Layer 1: $108,000
🔹 Layer 2: $109,000
🔹 Layer 3: $110,000
🔹 Layer 4: $111,000
🔹 Layer 5: $112,000
💡 Pro Tip: You can add more layers or adjust based on your bag size and risk appetite. The beauty of this strategy? You average into position like a pro! 🎭
🛡️ Risk Management
⛔ Stop Loss: $106,000
⚠️ Important Note: Dear Thief OG's (Ladies & Gentlemen),
This is MY stop loss based on MY risk tolerance. You're the captain of your own ship! 🚢 Set your SL according to YOUR risk management rules. Remember: Take profits at your own risk, protect capital like it's your treasure!
🎯 Target Zone: The Great Escape
🚨 Target: $124,000
Why this target?
The "Police Barricade" (strong resistance zone) sits right here with multiple confluence factors:
🔴 Major resistance level
🔴 Overbought conditions expected
🔴 Bull trap zone activated
🔴 Historical rejection area
🏃♂️ Exit Strategy: When we hit this zone, it's time to take your loot and run! Don't get greedy and caught in the trap!
⚠️ Important Note: Dear Thief OG's (Ladies & Gentlemen),
This is MY take profit target. You're free to take profits whenever YOU feel comfortable. Your money, your rules, your timeline! 💰
🔗 Correlated Pairs to Watch
Keep your eyes on these related assets for confirmation:
💱 Major Correlations:
BITSTAMP:ETHUSD - Typically follows BTC momentum; watch for similar accumulation
BINANCE:BTCUSDT - Alternative pairing for liquidity confirmation
TVC:DXY (US Dollar Index) - Inverse correlation; weakness in DXY = strength in BTC
$SPX/SPY (S&P 500) - Risk-on sentiment indicator
GOLD ( OANDA:XAUUSD ) - Alternative store of value; competitive correlation
📍 Key Correlation Points:
When DXY weakens, crypto typically strengthens
Traditional market risk-on flows support Bitcoin upside
ETH/BTC ratio helps confirm alt-season vs BTC dominance
Gold movements indicate macro hedging flows
⚙️ Why The Thief Strategy Works
✨ Dollar-Cost Averaging (DCA) on steroids
✨ Reduces emotional decision-making
✨ Better average entry price
✨ Lower risk per order
✨ Professional money management
Think like a thief planning the perfect heist: multiple entry points, calculated risks, clear escape route! 🎭
🎬 Final Thoughts
This isn't financial advice—it's a strategic blueprint for those who trade with discipline and style! The market is our playground, but only the smart thieves get to keep their loot. 🏆
Remember:
📊 Stick to your plan
🎯 Manage your risk
💰 Take profits systematically
🧠 Trade with logic, not emotion
🎭 Execute like a professional
📣 Support This Analysis
✨ If you find value in my analysis, a 👍 and 🚀 boost is much appreciated — it helps me share more setups with the community!
#Bitcoin #BTCUSD #CryptoTrading #SwingTrade #TradingStrategy #TechnicalAnalysis #CryptoAnalysis #BTC #LayeredEntry #RiskManagement #ThiefStrategy #CryptoSignals #BitcoinAnalysis #PriceAction #TradingSetup #CryptoTA #BTCSetup #SwingTrading
🎯 Stay sharp, trade smart, and may the profits be with you! 🚀

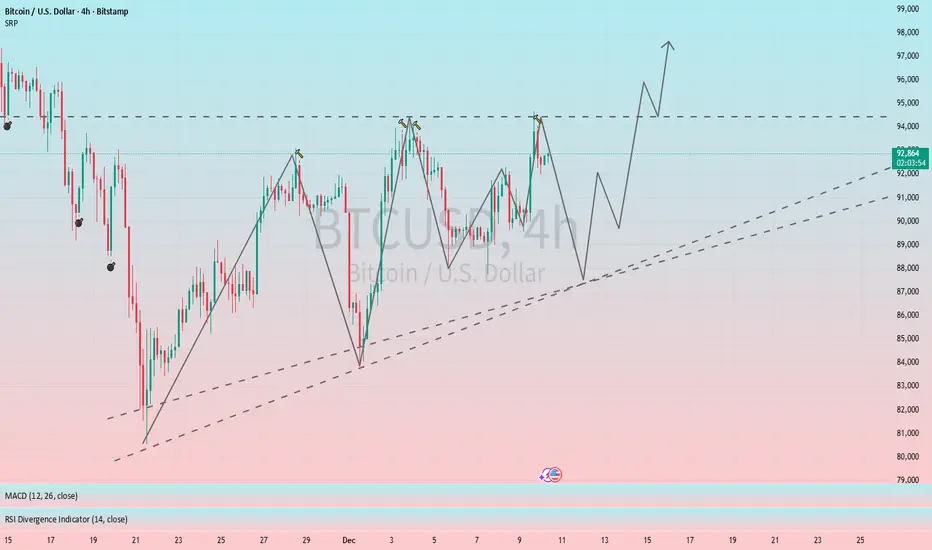
CAN BTC HIT MY TARGET 10,000$ ? BULLISH CHANNEL BTCUSDGreetings 👋
Bullish Setup On Btcusd
A Strong Bullish Channel On BTC On High Time Frame Daily We Are Expecting A Target Of Btc Is 10,000$ Letss Gooo
94,000 / 95,000 Market Rejects Many Time But Now its Want To Break And Keep Moving Up Side To Hit Our Target 🎯

Ascending triangle formation indicates a bullish outlook for BTC#BTCUSD BITSTAMP:BTCUSD BINANCE:BTCUSDT
From the 4H chart, BTC's short-term trend has formed an ascending triangle pattern, which is a typical bullish pattern. Short-term resistance is located at 93500-94500, a break above this level would likely lead to further gains. The key support level to watch is 88000-87500. If the price retraces to this range, we can consider going long on BTC.
ElDoradoFx PREMIUM 3.0 – BTCUSD PRO ANALYSIS (07/12/2025)1. Market Overview
BTC is trading inside a contracting corrective structure after rejecting the 89,750–89,850 supply zone. Price failed to sustain above the intraday EMAs and shifted momentum bearish. Liquidity remains heavy below current price, and MACD shows continued bearish pressure across short- and mid-timeframes. Weekend conditions favour engineered sweeps into deeper demand before any strong reversal attempt.
⸻
2. Technical Breakdown
🔹 Daily (D1)
• BTC remains in a broader retracement phase after major rejections at 97,400 and 104,000.
• EMAs overhead continue acting as dynamic resistance.
• Short-term relief rallies lack follow-through; price is at risk of retesting 88,000–87,500.
• Momentum is flattening but still bearish (MACD increasing negative histogram).
🔹 H1
• Strong rejection at 89,750 followed by BOS to the downside.
• Price now trades under both 50/200 EMAs, retesting them as resistance.
• Trendline support from prior swing low is being tested.
• Demand pockets: 89,350 → 89,200 → 89,000 → 88,800 (PDL).
• Structure remains bearish unless 89,750 is reclaimed with conviction.
🔹 15M–5M
• Clear lower-high sequence with repeated CHoCH → BOS confirmations.
• Sellers defended the supply zone aggressively.
• MACD flipped short with strong follow-through; RSI mid-range but with bearish slope.
• Liquidity clusters align below: 89,200, 89,000, 88,800 → highly attractive for engineered sweeps.
⸻
3. Fibonacci Analysis (Golden Zone)
Swing: 88,899 → 89,750
• 38.2% = 89,450
• 50% = 89,325
• 61.8% = 89,200
🎯 Golden Zone: 89,450 – 89,200
This aligns perfectly with intraday demand and previous liquidity builds.
⸻
4. High-Probability Trade Scenarios
📈 BUY Scenario (Countertrend Only)
Buy Zone:
• 89,200 – 89,000 – 88,800 (PDL sweep preferred)
Targets:
• 89,350 → 89,500 → 89,750
Stop-Loss: below 88,700
Confirmation Needed:
• Wick rejection at demand
• MACD re-flip long
• 5M BOS to confirm reversal structure
⚠️ Note: This is a counter-trend setup.
⸻
📈 BUY Breakout Scenario
Trigger: Break & hold above 89,750
Retest: 89,600–89,650 holding as support
Targets:
• 90,050 (PDH) → 90,300 → 90,750
Stop-Loss: 89,200
⸻
📉 SELL Scenario (Primary Setup)
Sell Zone:
• 89,600 – 89,750 (major supply zone)
Targets:
• 89,350 → 89,200 → 89,000 → 88,800 (PDL)
Stop-Loss: 89,900
Why this is preferred:
• Strong momentum confluence
• EMA rejection
• Multiple CHoCH/BOS confirming bearish control
⸻
📉 SELL Breakout Scenario
Trigger: Break below 89,000
Retest Fail Zone: 89,050–89,100
Targets:
• 88,800 → 88,400 → 88,000
Stop-Loss: 89,350
⸻
5. Fundamental Watch
• Weekend trading = algorithmic liquidity hunts, low-volume manipulations.
• No major fundamentals expected; movement will be structure-driven.
• Liquidity below is highly attractive; expect volatility near 89,200 / 89,000.
⸻
6. Key Technical Levels
Resistance:
• 89,600 / 89,750 / 90,050 / 90,300
Support:
• 89,350 / 89,200 / 89,000 / 88,800
Breakout Buy Trigger: > 89,750
Breakout Sell Trigger: < 89,000
⸻
7. Analyst Summary
BTC sentiment remains short-term bearish with strong structural, momentum, and EMA confluence. The sell zone at 89,600–89,750 remains the primary area of interest. First key liquidity target sits at 89,200, with deeper sweeps into 89,000–88,800 likely if momentum persists.
Countertrend longs only activate after confirmation at those deeper zones.
⸻
8. Final Bias Summary
Primary Bias: Bearish below 89,750
Bullish Only If: Price reclaims and holds above 89,750
Key Decision Zone: 89,200–89,000
⸻
🥇 ElDoradoFx PREMIUM 3.0 – PERFORMANCE 05/12/2025 🥇
⚡ Smart Entries. Consistent Wins.
📈 BUY +570 PIPS (From 04/12)
📈 BUY +500 PIPS (From 04/12)
📈 BUY +40 PIPS
🟥 SELL -55 PIPS (SL)
📈 BUY +120 PIPS
📈 BUY +210 PIPS
📈 BUY +20 PIPS
🟥 BUY -40 PIPS (SL)
📈 BUY +20 PIPS
📉 SELL +60 PIPS
━━━━━━━━━━━━━━━
💎 SWING TRADES – STILL RUNNING
🔵 BUY → +3,005 PIPS
🟣 BUY → +2,260 PIPS
🟢 BUY → +1,390 PIPS
📊 Long-term swing positions continue to dominate, while intraday precision adds consistent controlled gains.
━━━━━━━━━━━━━━━
💰 TOTAL PIPS GAIN: +1,445 PIPS
🎯 8 Wins · 2 SL
🔥 80% Accuracy
━━━━━━━━━━━━━━━
✅ A powerful close to the week — strong swings + clean intraday setups delivering exceptional profit.
— ElDoradoFx PREMIUM 3.0 Team 🚀

BTC Wave 4 Bounce Looks Like a Trap! Is it?BTC is still moving inside a clear corrective channel, with the current bounce likely forming wave 4 before one final drop toward the 1.618 extension near 79,650 . The highlighted red zone shows a potential trap area where price may lure traders into thinking a reversal has started. Until BTC breaks above the channel convincingly, the broader structure still favors a wave 5 decline. The wave count from 1–2–3 supports this final leg down before any major recovery.
Stay Tuned!
@Money_Dictators

BTCUSD: Reversal From Target & Demand Zone Liquidity Sweep Setup📊 BTCUSD – 30-Minute Smart Money Analysis + MMC Concept Used
Demand Zone Reaction | Volume Burst | QFL Strategy
🔍 1. Market Overview
Bitcoin on the 30-minute chart is currently pulling back after failing to break above the recent intraday high. Price is slowly drifting downward, showing signs of controlled seller pressure. This decline is driving BTC toward a key demand + target zone, marked in blue, with deeper liquidity resting in the green “Volume Burst” zone.
This setup suggests a potential reversal opportunity, but only with confirmed price action.
📉 2. Structure Breakdown
A. Decline After Swing High
BTC rejected the upper levels and started forming:
Lower highs
Lower lows
Weak bullish candles
This shows sellers are still in control until price touches a stronger demand pool.
B. QFL Level Marked
The "QFL" marking on the chart reflects:
A base level where price previously formed
A zone that held liquidity and triggered a bullish bounce last time
A zone that smart money may revisit to collect liquidity again
If no pattern forms at the first demand box, BTC may double the QFL, meaning price can dip into the deeper liquidity pool before reversing.
🎯 3. Key Zones to Watch
🟦 Target + Demand Zone (Upper Zone)
This is the first area where buyers may step in.
Expect:
A possible micro reversal pattern
Short-term bounce opportunity
Scalping potential
However, you must wait for a clean bullish pattern here (engulfing, pin bar, break of minor structure).
The chart clearly states:
“Pattern Needed Otherwise Double The QFL”
Meaning: No pattern = price moves lower.
🟩 Volume Burst Zone (Lower Liquidity Pool)
This deeper zone is stronger because:
It represents the previous area where a volume spike occurred
Smart money positioned aggressively here before
Liquidity is highly concentrated
If price reaches this zone, the reversal probability becomes significantly higher.
This area is ideal for high-probability long entries.
📌 4. Smart Money Logic
The price movement aligns with institutional behavior:
The current drop is likely a liquidity hunt
BTC is moving toward unfilled demand
Buyers may re-enter strongly once the market taps the liquidity pockets shown
Institutions often engineer these dips before the next bullish impulse.
📈 5. Professional Trading Plan
1. Let price fall into the demand zone.
Do not enter early.
2. Look for confirmation:
Bullish engulfing
Market structure shift
Large volume candle
Clean rejection wick
3. If no pattern forms in the first zone:
Expect price to dip toward the lower Volume Burst Zone.
4. Main long entry interest:
Lower (green) zone offers the best probability.
📝 Conclusion
BTC is heading toward a well-defined demand structure. The next move depends on how price reacts in the highlighted zones. A bullish reversal is possible, but confirmation is critical. Without a pattern, BTC may dip deeper to collect liquidity—exactly as marked on the chart.
This setup reflects precision-level smart money behavior, offering a clean high-probability trading opportunity for disciplined traders.

Elise | BTCUSD 4H — Break of Bearish Structure |BITSTAMP:BTCUSD
Price previously rejected from the major corrective zone and continued bearish until a final liquidity grab created imbalance and shift of character. The recent breakout from the bearish channel and bullish momentum suggests institutional repositioning, preparing for upside continuation toward higher correction levels.
Key Scenarios
🚀 Bullish Case (Primary Bias)
If price re-tests and holds above 93,500–95,300, upside continuation is expected:
🎯 Target 1: 100,500
🎯 Target 2: 105,800
🎯 Target 3: 116,200 (Major Correction Zone)
📉 Bearish Case (Invalidation)
A clean breakdown below 88,500 would shift bias back to bearish and may revisit the liquidity grab zone.
Current Levels to Watch
Entry Zone: 93,500–95,300
Support: 88,500
First Breakout Confirmation: Above 96,000
⚠️ Disclaimer: This analysis is for educational purposes only — not financial advice.

#BITCOIN: Still Expecting Price To Touch $60K To $65K! Bitcoin is likely to drop further down before we could see a strong bullish move taking price to all time high. This is our view only and it is not an guaranteed move; once price touch our reversal zone then we could see price going back to all time high. Good luck and trade safe!
Team Setupsfx_
Like And Comment Our Ideas For More Such Educational content! 📊🚀

BTCUSD : Short-Term Bearish Correction OutlookBitcoin is forming a potential corrective sequence on the 4-hour timeframe after completing its recent impulsive recovery phase. Current price behaviour reflects an early shift in momentum, suggesting the market may be preparing for a deeper pullback before reassessing the next directional leg as December progresses.
Disclosure: We are part of Trade Nation's Influencer program and receive a monthly fee for using their TradingView charts in our analysis.

BTCUSD: Wave rhythm on the verge of impulseBased on the current structure, Bitcoin is completing its corrective phase and is preparing to form a new impulse. The chart shows a transition from sideways movement to a more dynamic wave, which could set the direction for the near term.
Primary scenario: after the correction ends, a downward impulse sequence is expected to develop. Alternative scenario: if the market consolidates above recent highs, it could continue to rise, delaying the start of a new downward wave.
Idea for traders: watch for confirmation of the structure on lower timeframes and enter only after clear reversal signals appear.
Friends, more wave analysis is available in our profile.
Subscribe to stay up to date with wave analysis!

BTCUSD: Wave Pendulum on the Verge of ReversalBTCUSD: Wave Pendulum on the Verge of Reversal
BTCUSD Wave Overview (H4/D1)
According to its wave structure, Bitcoin is completing its corrective phase and preparing to form a new impulse. Current dynamics indicate a possible end to the sideways movement and a transition to the final wave of a larger cycle.
Primary scenario: A downward impulse sequence is expected to develop after the correction is complete. Alternative scenario: If the market consolidates above recent highs, it could continue to rise, delaying the start of a new downward wave.
Idea for traders: watch for confirmation of the structure on lower timeframes and enter only after clear reversal signals appear.

BTCUSD It is Inevitable...I hate to say it… but this chart is giving me flashbacks.
When you zoom out on BTC’s weekly structure, you see similarities between 2021 and what’s happening right now in 2025. This doesn't look good to me.
After the double-top formation in 2021, we got a relief rally that tricked everyone into thinking new highs were coming. But it was just a Bull Trap.
Fast forward to today:
Price is crawling back into the identical type of bull trap zone we saw last cycle at 0.38 Fibonacci (same as 2021).
If the market keeps repainting the same structure, BTC could deliver one more “hope” bounce into the red circle (which will be another bull trap)…only to roll over again and start a deeper correction.
No hopium here… just the chart speaking for itself.
I would recommend avoiding swing trades that leaves you exposed you to an uncertain market. Day trading remains effective but only on smaller timeframes.
Good Luck!

BTC: Bullish Trend, 900000 Breakout AheadFollowing Black Friday’s plunge, BTC’s uptrend is now confirmed—holding firmly above 85000 and awaiting a direct breakout above 90000
Buy 86500 - 87500
TP 88500 - 89000
Accurate signals updated daily. They serve as a reliable guide for trading issues – feel free to refer to them. Hope they help!

BTC’s 85k-87k Range: 80k Risk or 100k Rebound Next WeekBTC plummeted to around 80,000 last Black Friday, now ranging between 85,000 and 87,000. A breakdown below 85,000 risks breaching the 80,000 support; holding above confirms a rebound, with a potential retest of 100,000 next week
Sell 88000 - 87500
TP 86500 - 86000 - 85000
Accurate signals updated daily. They serve as a reliable guide for trading issues – feel free to refer to them. Hope they help!

BTCUSD – Bullish Setup 4HPrice is pulling back into a key demand zone while holding above the lower boundary of the descending channel. Buyers are slowly stepping back in, and several bullish confluences are building:
🔹 Bullish Confluences
Price rejected the lower channel and is attempting to reclaim short-term EMAs.
Momentum shows weakening bearish pressure after a series of higher lows.
Price is retesting the mid-channel zone, which often acts as springboard in corrective structures.
The Fibonacci retracement from the recent swing displays clear upside targets lined up with channel resistance.
🎯 Fibonacci Targets
38.2% – $87,859
61.8% – $89,179
100% – $91,316
A break above the immediate EMA cluster could confirm bullish continuation toward these Fib levels. Invalidated if price closes below the recent local low.

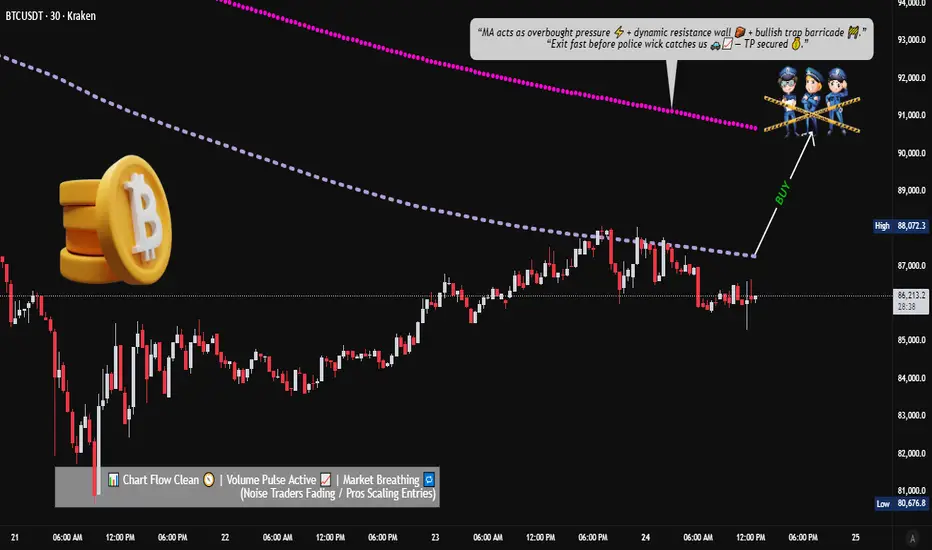
Bitcoin MA Breakout Setup: What Traders Should Watch Now📈 BTC/USDT – “BITCOIN VS TETHER” | Crypto Market Opportunity Blueprint (Day Trade)
🔥 Bullish Breakout Roadmap for Active Day Traders
🧭 PLAN:
Price is attempting a bullish breakout above key moving averages. Once price clears $88,000, momentum buyers may step in and drive a continuation leg upward.
🎯 ENTRY (Breakout Confirmation):
▶ Enter at any price level AFTER a clean moving-average breakout above $88,000.
Look for strong candle closes + volume expansion.
🛑 STOP–LOSS (Risk Management First):
⚠️ This is MY thief-style SL: $84,000
Dear Ladies & Gentlemen (Thief OG’s) — manage your own risk according to your playbook.
This is only my SL, not a rule. You’re free to adjust based on your own risk appetite.
💰 TARGET:
Moving averages align as a dynamic resistance zone, combined with overbought conditions and potential bull-trap signals.
Secure profits responsibly.
▶ Target: $90,800
Again — Dear Ladies & Gentlemen (Thief OG’s), this TP is MY personal level.
Book profits your own way, at your own risk.
🔍 Related Crypto Pairs to Watch (Correlation + Key Notes)
1️⃣ ETH/USDT (Ethereum)
Highly correlated with BTC in bullish phases
Strong ETH movement often front-runs or confirms BTC breakouts
Watch for ETH strength → may add confidence to BTC breakout trades
2️⃣ BTC.D (Bitcoin Dominance)
Rising BTC dominance = Capital flowing into Bitcoin → Supports bullish continuation
Falling dominance = Altcoins gaining share → BTC breakouts may weaken or turn choppy
3️⃣ TOTAL / TOTAL2 (Crypto Market Cap Charts)
Confirms whether capital is entering the entire crypto market
TOTAL rising with BTC strength = broad market confidence
TOTAL flat/dropping during BTC’s rise = possible bull trap
4️⃣ SOL/USDT (Solana)
Solana often moves aggressively when BTC breaks out
Sharp SOL rallies can signal strong risk-on momentum across majors
5️⃣ USDT.D (USDT Dominance)
When USDT dominance drops → Traders moving out of stablecoins → Bullish risk appetite
When it spikes → Smart money hedging → BTC breakout may fail
6️⃣ BTC/USDT Perp Funding Rate
Positive & increasing funding = heavy long side → Potential squeeze
Neutral funding = healthy breakout
Negative funding = breakout might be fueled by short covering
📊 Market Tone:
BTC continues to show strong buyer interest, but resistance pockets remain.
Trade mechanically. Don’t chase candles. Let structure confirm itself.
BTCUSD Relief rally before another dropBTCUSD is currently completing 5 wave bearish structure, I'm expecting a wave 4 retracement before another wave down.
Sell Zone: $92,150 – $96,700
I expect BTC to continue climbing into this zone before distribution begins. Beware that BTC's bullish momentum is exhausted and it might not reach that high. Reaching this sell level might be a complex correction not a simple one.
Buy Zone: $72,100 – $75,990
If this analysis plays out well, and market starts showing bullish signs, I'm expecting it will be the local low for this bearish bitcoin move. Otherwise, price might continue dropping to $62,000 area.
I will update this idea later.
Good Luck!

BTC/USD/ Bullish. Trend Read The captionSMC Trading point update
Technical analysis of summary of this BTC/USDT H1 chart:
---
Overall Bias: Bullish Short-Term
The chart shows a bullish continuation structure after mitigation of the Fair Value Gap (FVG) and support from EMAs.
---
Key Technical Points
Price retested and respected the FVG zone
Located around 85,300 – 86,000 area, acting as demand.
Price above EMA 50 (blue) and approaching EMA 200 (black)
→ Indicates building bullish momentum and potential trend reversal if EMA 200 breaks.
Structure
Higher lows forming
Price breaking minor structure highs
Strong bullish impulse candles
Target Zone Target highlighted near 90,000 – 90,100
---
Trade Idea Concept
Entry Idea:
Look for retracement back into the FVG/EMA zone for continuation long (mitigation + breakout strategy).
TP Target:
90,000 – 90,100 resistance and liquidity level
Invalidation / Stop:
Clean break below 85,300 demand zone would negate the bullish setup.
---
Smart Money Concept Perspective
FVG used as institutional demand
Liquidity grab below previous lows during correction phase
Targeting premium pricing near EMA 200 and liquidity pool
Mr SMC Trading point
---
Summary
BTC is showing strength and continuation potential. As long as price stays above 85,300–86,000 zone, the path of least resistance is upward toward 90,000.
---
Please support boost 🚀 this analysis

BTCUSD – Sharp Decline Followed by Early Recovery AttemptsAfter an extended downside move, price has started to form a reactive rebound pattern, indicating that short-term buyers may be stepping in. If this developing behaviour continues, a gradual continuation of the recovery phase could unfold as momentum shifts in the sessions ahead.
Disclosure: We are part of Trade Nation's Influencer program and receive a monthly fee for using their TradingView charts in our analysis.

ElDoradoFx – BTCUSD ANALYSIS (22/11/2025, WEEKEND)1. Market Overview
BTCUSD continues in a strong downtrend from the 113k top, now trading around 84,000 after a sharp selloff. Price is sitting near the lower side of the descending channel and just above the key support band 83,500–83,400, with momentum still bearish but short-term showing signs of exhaustion / potential corrective bounce.
⸻
2. Technical Breakdown
🕐 Daily (D1)
• Clear bearish structure: consecutive lower highs and lower lows from ~113k.
• Price trades well below 20/50/100/200 EMAs, confirming dominant downtrend.
• Current D1 candle sitting near the prior “Sweep” zone around 83–81k.
• RSI oversold (~22–25) and MACD deeply red → trend strong but stretched; space for corrective rally before next leg down.
🕐 H1
• Price moving inside a falling channel, last swing low near 81–82k, last swing high around 88–89k.
• EMAs (20/50) below 200 EMA, slightly flattening → trend still down, momentum slowing.
• Small BOS to the upside from the last swing low, but still capped under H1 supply 84.8–85.7k.
• MACD shows bullish divergence vs the recent low → supports idea of pullback toward Fib zone before possible continuation.
🕐 15M–5M
• Intraday price is ranging 83.7–84.3k, forming minor higher lows.
• MACD positive, RSI hovering around 50 → short-term neutral / corrective phase.
• Still trading inside H1 downtrend and below intraday supply 84.8–85.2k.
⸻
3. Fibonacci Analysis
Last clear swing on H1:
• Swing High ≈ 88,700
• Swing Low ≈ 81,300
Fibonacci retracement (bearish pullback):
• 38.2% ≈ 84,120
• 50.0% ≈ 84,990
• 61.8% ≈ 85,870
🎯 Fibonacci Golden Zone: 84,100 – 85,900
This aligns with H1 supply and descending trendline → high-interest sell zone for continuation.
⸻
4. High-Probability Trade Scenarios
📉 A. Trend SELL from Golden Zone (Main Setup)
• Sell Zone: 84,500 – 85,500 (Fib 0.5–0.618 + H1 supply / trendline)
• Initial Targets:
• TP1: 83,500
• TP2: 82,500
• TP3: 81,000
• Extended: 80,600 (prior strong low)
• Stop Loss: Above 86,200
• Confirmation:
• Rejection candle / bearish engulfing in zone
• RSI H1 staying below 55 and MACD crossing back bearish.
• Idea: Primary play is to sell the corrective rally back into the golden zone in line with the dominant downtrend.
⸻
💥 B. Breakout SELL Setup (Continuation)
• Break Sell Trigger (Breaking Price):
• Clean H1 close below 83,450
• Retest Sell Zone: 83,450 – 83,800
• Targets:
• TP1: 82,500
• TP2: 81,000
• TP3: 80,600
• Stop Loss: Above 84,300
• Note: Use if price fails to reach the golden zone and instead breaks the current base directly.
⸻
📈 C. Countertrend BUY from Support (Scalp / Secondary)
• Buy Zone: 83,500 – 83,400 (top of strong support / range low)
• Targets:
• TP1: 84,500
• TP2: 85,500
• TP3: 86,800 (toward top of golden zone / trendline)
• Stop Loss: Below 82,800
• Confirmation:
• Bullish divergence on 15M/5M
• Strong wick rejection from 83.4–83.5k.
• ⚠️ Countertrend only – use reduced risk; objective is to catch corrective leg back into the golden zone.
⸻
🚀 D. Breakout BUY Setup (Structure Shift)
• Break Buy Trigger (Breaking Price):
• H1 close above 85,800 (clear break of Fib 0.618 + channel / supply)
• Retest Buy Zone: 85,800 – 86,000
• Targets:
• TP1: 87,500
• TP2: 89,500
• TP3: 91,300
• Stop Loss: Below 85,000
• Idea: This would be an early trend-change signal; only valid if volume and momentum (RSI > 60 on H1) confirm the break.
⸻
5. Fundamental Watch
• Weekend conditions → thin liquidity & gap risk between Sunday open and Monday session.
• BTC remains highly sensitive to US macro data and risk sentiment (equities, DXY, yields). Any upcoming high-impact USD events next week (CPI, PCE, Fed speakers, etc.) can accelerate either continuation or reversal.
• For swing positions, plan size so you can hold across potential gaps, or close before the weekend if uncomfortable with risk.
⸻
6. Key Technical Levels
• Resistance:
• 84,800
• 85,500–85,900 (Golden Zone upper)
• 87,500
• 90,000
• Support:
• 83,450
• 82,500
• 81,000
• 80,600 (major prior low)
• Golden Zone (Short): 84,100 – 85,900
• Break Buy Trigger: > 85,800 (H1 close)
• Break Sell Trigger: < 83,450 (H1 close)
⸻
7. Analyst Summary
• Structure from D1 to H1 is decisively bearish.
• Current consolidation around 84k looks like a pause within the downtrend, not yet a confirmed bottom.
• The highest-probability play remains selling rallies into the Fib Golden Zone (84.5–85.5k), aiming for new lows towards 82.5–81k → 80.6k.
• Countertrend buys are possible off 83.5–83.4k, but only for quick scalps with tight risk.
⸻
8. Final Bias Summary
• Bearish Bias (Primary):
• Valid while price stays below 85.7–86k.
• Prefer Sell Golden Zone and Breakout Sell < 83,450 setups.
• Bullish Bias (Alternative / Reversal):
• Consider only if H1 closes above 85,800 and retest holds.
• Then target 87.5k → 89.5k → 91.3k with higher-timeframe confirmation.
Manage risk: fixed % per trade, no over-leveraging, and be careful holding full size over the weekend gaps. 🚨
⸻
🥇 ElDoradoFx PREMIUM 3.0 – PERFORMANCE 21/11/2025 🥇
🔥 Precision • Momentum • Profit
━━━━━━━━━━━━━━━
📊 XAU/USD – DAILY RESULTS
🟢 BUY +50 PIPS
🔻 SELL +20 PIPS
🟢 BUY +210 PIPS
🟢 BUY +210 PIPS
🟢 BUY +20 PIPS
❌ SELL -40 PIPS (SL)
🟢 BUY +220 PIPS
🔻 SELL LIMIT +210 PIPS
━━━━━━━━━━━━━━━
🔝 SWING TRADES – STILL RUNNING
📈 BUY → +2,850 PIPS
📈 BUY → +1,320 PIPS
━━━━━━━━━━━━━━━
💰 TOTAL PIPS GAIN: +900 PIPS
🎯 8 Signals → 7 Wins (1 SL)
🔥 Win Accuracy: 88%
━━━━━━━━━━━━━━━
Strong close to the week — perfect blend of scalps, intraday setups, and powerful swing continuation!
Congrats if you profited — PREMIUM 3.0 keeps delivering results! 🚀💰
— ElDoradoFx PREMIUM 3.0 Team 🚀
