BTCUSDBTCUSD needs some correction for the next few days before any upside.
Disclosure: We are part of Trade Nation's Influencer program and receive a monthly fee for using their TradingView charts in our analysis.
Btcusdtrade

Nailed it! Accurate Prediction of BTCAs we accurately predicted on the 16th, BTC’s resistance level would be concentrated between the 117000 and 118000 and that is exactly what occurred. After advancing to around 117000, it pulled back; subsequently, it rebounded to near 118000 before retreating immediately.
Currently, the support level at 114400 remains solid, and the overall trend continues to be upward.
Buy 115500 - 116000
TP 116500 -117000 - 117500
Daily-updated accurate signals are at your disposal. If you run into any problems while trading, these signals serve as a reliable reference—don’t hesitate to use them! I truly hope they bring you significant assistance

Bitcoin - It is bullish either way!💎Bitcoin ( CRYPTO:BTCUSD ) still remains bullish:
🔎Analysis summary:
Yes, over the past couple of days we have been seeing a quite negative correction on Bitcoin. However, looking at the higher timeframe, Bitcoin remains totally bullish. So even if Bitcoin continues with the recent correction, it would ultimately result in a bullish all time high break and retest.
📝Levels to watch:
$60.000
SwingTraderPhil
SwingTrading.Simplified. | Investing.Simplified. | #LONGTERMVISION

Today's BTCUSD Market AnalysisBTCUSD has shown little overall change compared to yesterday, with the broader market structure remaining intact. The support level remains firm, while esistance level continues to be concentrated in the 117,000–118,000
Buy 114500-115000
TP 115500-116500-117500
Daily-updated accurate signals are at your disposal. If you run into any problems while trading, these signals serve as a reliable reference—don’t hesitate to use them! I truly hope they bring you significant assistance

BTCUSD Market AnalysisObserving price movements, BTCUSD experienced a brief pullback lately after a wave of upward momentum, but the broader bullish structure stays intact. During this pullback, the underlying support proved effective, and the price subsequently rebounded. When it comes to upper resistance, the focus remains on the 117,000 to 118,000 interval.
Buy 114500-115000
TP 115500-116500-117500
Daily-updated accurate signals are at your disposal. If you run into any problems while trading, these signals serve as a reliable reference—don’t hesitate to use them! I truly hope they bring you significant assistance

Daily Market Analysis of BTCUSDFrom the observation of price movements, recently, after a wave of rise, BTCUSD has experienced short-term pullback, but the overall bullish structure remains intact. During the pullback, the support below was effective, and then the price rose again.
For upper resistance, the focus remains on the 117,000–118,000 USD range.
Buy 114500-115000
TP 115500-116500-117500
Daily-updated accurate signals are at your disposal. If you run into any problems while trading, these signals serve as a reliable reference—don’t hesitate to use them! I truly hope they bring you significant assistance

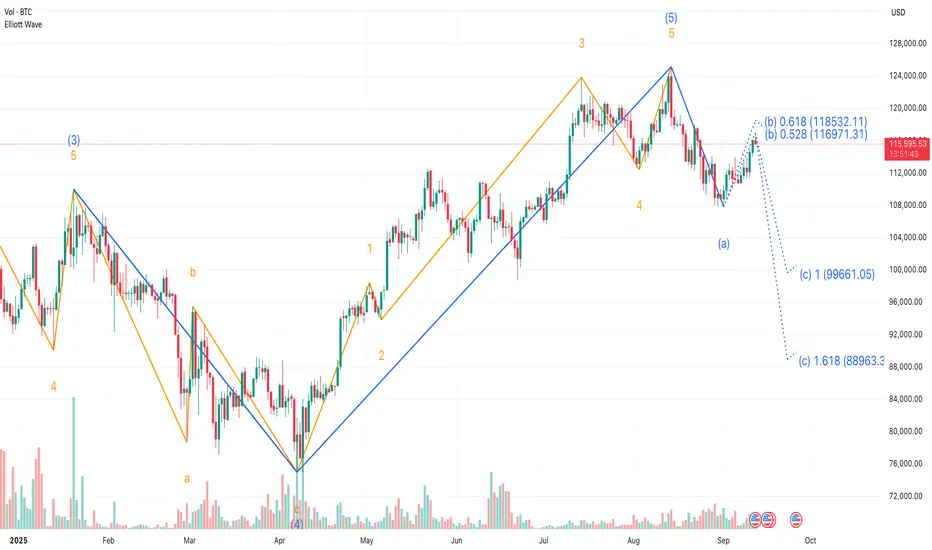
Understanding Elliott Wave Theory with BTC/USD If you’ve ever stared at a Bitcoin chart and thought, “ This looks like chaos ”, Ralph Nelson Elliott might disagree with you. Back in the 1930s, Elliott proposed that markets aren’t just random squiggles — they actually move in recognizable rhythms. This became known as Elliott Wave Theory .
So, what is Elliott Wave Theory? In the simplest terms, it’s the idea that market psychology unfolds in waves: five steps forward, three steps back, repeat. Not every chart follows it perfectly, but when you see it play out, it feels like spotting order in the middle of crypto madness.
⚠️ Before we dive in: remember, no single tool or pattern works alone. Elliott wave trading is most useful when combined with other methods.
The Elliott Wave Principle
At the heart of the Elliott Wave principle are two phases:
Impulse Waves (5 waves) : Markets advance in five moves — three with the trend, two counter-trend. This is when optimism snowballs.
Corrective Waves (3 waves) : The market cools off in three moves. Usually messy, choppy, and fueled by doubt.
Put them together, and you get a “5-3“ structure that repeats at different scales. That’s what gives Elliott Wave its fractal character. Again, don’t treat this as a crystal ball. Elliott Wave Theory rules are guidelines, not guarantees. Real-world Bitcoin charts bend, stretch, and sometimes ignore them altogether.
Elliott Wave Theory Explained with BTC
Let’s use an example: Bitcoin’s rally from early 2025 till now .
This downturn marked the first step in a broader consolidation, signaling that momentum was beginning to fade.
The corrective sequence unfolded in a classic A-B-C structure.
❗This three-part move effectively reset the market, washing out excess leverage and preparing the ground for the next impulsive cycle.
From that low, Bitcoin launched into a textbook five-wave impulsive rally.
This initial leg down, labeled wave (a), suggested that a larger corrective phase was now underway, replacing the bullish momentum with profit-taking and distribution.
That’s a textbook case of Bitcoin Elliott wave analysis . But notice: it wasn’t clean. Some traders counted the waves differently. Some saw extensions or truncations. That’s the thing with Elliott — interpretation matters as much as the rules.
Elliott Wave Theory Rules and Flexibility
The classic Elliott wave rules say things like: Wave 2 can’t retrace more than 100% of Wave 1. Wave 3 is never the shortest impulse wave. Wave 4 can’t overlap with Wave 1 in most cases.
But in practice, Bitcoin often blurs these lines. Extreme volatility, liquidation cascades, and macro shocks can distort wave counts. That’s why even seasoned analysts will say, “This is my Elliott count,” not the Elliott count.
The takeaway? Think of Elliott as a lens, not a lawbook.
Tools That Pair with Elliott
Many traders use the MT5 Elliott Wave Indicator or TradingView drawing tools to sketch their wave counts. Despite the waves becoming far more meaningful when tied to other signals:
Fibonacci Retracements: For example, watching how corrections line up with golden pocket levels. Momentum Oscillators: That confirm or contradict the wave structure. Macro Sentiment: Shifts that often align with corrective or impulsive phases.
Elliott Wave Theory trading doesn’t exist in a vacuum. Used alone, it’s like trying to predict the weather with just cloud shapes.
Why Beginners Should Care
If you’re new, you might be asking: “ Okay, but why bother with this at all? ” The answer: Elliott Wave Theory explained the psychology behind price swings long before the existence of cryptocurrency. It captures the human emotions behind markets — fear, greed, doubt, euphoria. And Bitcoin, perhaps more than any other asset, runs on psychology.
So whether you’re sketching waves, testing them on the Bitcoin Elliott wave chart , or just trying to understand why BTC always seems to surge then collapse, this framework helps put the chaos into context.
Final Thoughts 🌊
What is Elliott Wave Theory in trading? It’s not a magic formula. It’s a structured way of looking at markets through recurring patterns of optimism and pessimism.
And just like with every other tool we’ve discussed, it’s not about using it alone. The best insights come when you combine the Elliott Wave principle with other indicators: Fibonacci, moving averages, and even plain old support and resistance.
So the next time someone posts a “ wave count ” on a Bitcoin Elliott Wave analysis, don’t take it as gospel. Treat it as one possible map of where we are in the cycle. Because in trading, it’s never about certainty. It’s about perspective.
This analysis is performed on historical data, does not relate to current market conditions, is for educational purposes only, and is not a trading recommendation.
Precise Prediction and Forecast for BTCUSD MarketYesterday, we accurately predicted that BTC would rally to around 116,000 USD and face certain resistance. Today, after breaking through 116,000 USD as expected, the price retraced to hover around 115,000 USD.
Looking ahead, if BTC can stabilize near the 115,000 USD level, it is highly likely to continue its upward trajectory, with the potential to retest the 120,000 USD mark. For upper resistance, the focus remains on the 117,000–118,000 USD range
Buy 114000-114500
TP 115000-116000-1175000
Daily-updated accurate signals are at your disposal. If you run into any problems while trading, these signals serve as a reliable reference—don’t hesitate to use them! I truly hope they bring you significant assistance

BTCUSD 4-Hour Chart AnalysisLooking at the BTCUSD 4-hour chart, the price has recently exhibited a dynamic trend. After a prior upward movement, it underwent a pullback. Now, it has found solid support at the 112,500 level. This support zone appears reliable, as the price has stabilized above it, indicating that buying interest has emerged here to prevent further declines.
In terms of resistance, the 116,000 level is a key hurdle to watch. If the price can successfully break through 116,000 with strong momentum, it would open the door to further upside potential. Before that, the 115,000 level could act as a near-term resistance to test the bulls' strength.
For traders, the strategy could be to monitor the price action around the 112,500 support. If the support holds and there are signs of a bullish reversal , it may be an opportunity to consider long positions with a target towards 115,000 and then 116,000. Conversely, a breakdown below 112,500 would shift the bias to the downside, with the next support level to watch at 110,640
Overall, the near-term trend hinges on the price's interaction with the 112,500 support and the subsequent attempt to challenge the 115,000 - 116,000 resistance zone.
Buy 112500 - 113500
TP 114500 - 115500 - 116000
Daily-updated accurate signals are at your disposal. If you run into any problems while trading, these signals serve as a reliable reference—don’t hesitate to use them! I truly hope they bring you significant assistance

BTCUSD 4-Hour Chart Analysis
In terms of resistance, the 116,000 level is a key hurdle to watch. If the price can successfully break through 116,000 with strong momentum, it would open the door to further upside potential. Before that, the 115,000 level could act as a near-term resistance to test the bulls' strength.
For traders, the strategy could be to monitor the price action around the 112,500 support. If the support holds and there are signs of a bullish reversal , it may be an opportunity to consider long positions with a target towards 115,000 and then 116,000. Conversely, a breakdown below 112,500 would shift the bias to the downside, with the next support level to watch at 110,640
Overall, the near-term trend hinges on the price's interaction with the 112,500 support and the subsequent attempt to challenge the 115,000 - 116,000 resistance zone.
Buy 112500 - 113500
TP 114500 - 115500 - 116000
Daily-updated accurate signals are at your disposal. If you run into any problems while trading, these signals serve as a reliable reference—don’t hesitate to use them! I truly hope they bring you significant assistance

BTC forms an ascending triangle, 113000 is just the beginningBITSTAMP:BTCUSD BTC saw a slight rise during the day. From the hourly and 4H charts, the MACD technical indicator formed a golden cross and broke through the upper short-term pressure of 113000. The short-term trend formed an ascending triangle. Bold and aggressive investors can rely on 113500-112000 to go long, with the target looking at 115500-116500.

BTC Triangle Squeeze: Next Stop $116K?Bitcoin is currently consolidating inside a symmetrical triangle, a classic squeeze that often precedes a strong breakout 💥. Price is building pressure with higher lows and lower highs, waiting for confirmation.
✅ Bullish Confluences:
Price is respecting triangle support and holding the structure.
Fibonacci retracement shows potential upside continuation.
Momentum is shifting after a prolonged corrective move.
🎯 Fibonacci Upside Targets:
🌟38.2% – $112,876
🌟61.8% – $114,195
🌟100% – $116,329
⚠️ Invalidation / Stop-Loss Zone:
If price breaks below $107,000 – $105,000, the bullish setup is invalidated ❌.
As long as BTC stays inside the triangle and above key support, the squeeze favors a bullish breakout

BTCUSD BUY NOW 110650BTCUSD Long Setup
📈 Entry: 110700
🛡️ Stop Loss: 110400
🎯 Take Profit: 111600
Bullish momentum spotted near support zone. Targeting short-term breakout with tight risk control. Ideal for intraday scalpers and momentum traders.

#BTC/USDT Bullish Divergence on 1H, Low Risk Trade#BTC
The price is moving within a descending channel on the 1-hour frame, adhering well to it, and is poised to break it strongly upwards and retest it.
We have a bearish trend on the RSI indicator that is about to be broken and retested, supporting the upside.
There is a major support area in green at 108062, which represents a strong basis for the upside.
For inquiries, please leave a comment.
We are in a consolidation trend above the 100 Moving Average.
Entry price: 108450
First target: 108959
Second target: 109541
Third target: 110325
Don't forget a simple matter: capital management.
When you reach the first target, save some money and then change your stop-loss order to an entry order.
For inquiries, please leave a comment.
Thank you.

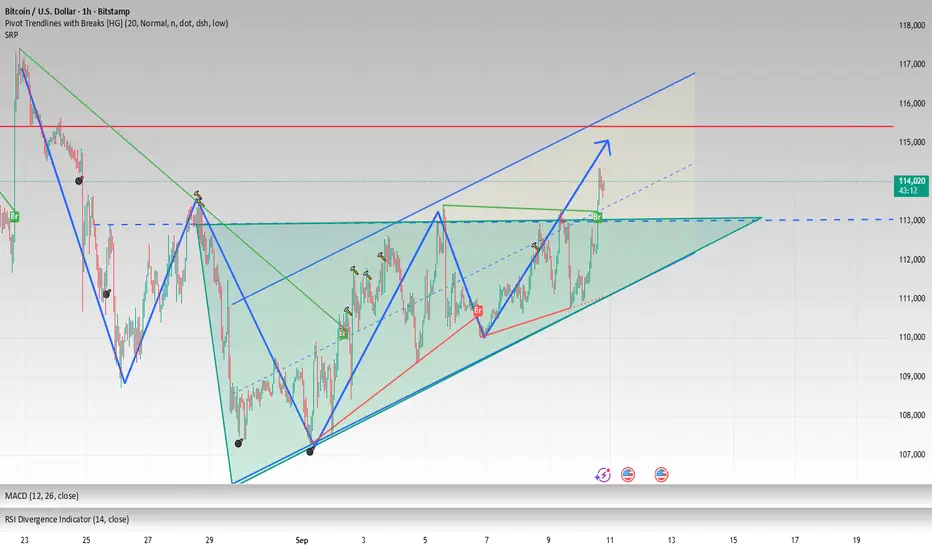
Bitcoin (BTC/USDT) Trade Setup🚀 BINANCE:BTCUSDT Trade Setup 🚀
📉 After a sustained downtrend inside a parallel channel, BTC has finally broken out with bullish momentum. Currently, price is hovering around the 111K zone.
🔑 Key Levels:
Support: Channel retest zone (110K – 109.5K)
Resistance: 113K – 114K
Next Major Target: 116K – 118K 🎯
⚡ Trading Plan:
If BTC successfully retests the channel breakout and flips the resistance into support ✅, we could see a massive upside move (potential Elliott Wave structure forming 🔄).
🔥 Confirmation of strength will come once BTC breaks & sustains above 113K with volume.
This could trigger a huge pump towards Wave 3 & Wave 5 targets 🚀💎
🛡️ Risk Management: Place SL below 109K support to protect against false breakouts.
📈 Summary:
BTC breakout + possible retest = high probability bullish setup 📉➡️📈.
Keep an eye on volume and channel validation before entering.

BTCUSD Bearish Since March 13, 2023, the BINANCE:BTCUSD has consistently traded above its weekly 50-period Simple Moving Average (SMA), demonstrating sustained bullish momentum. The price has tested the weekly 50 SMA on three occasions, each time finding support and maintaining its position above Moving Average. However, a significant bearish divergence is evident on the weekly chart, signalling potential weakening momentum despite the upward price trend. Given this divergence and historical price action, there is a high probability that BTCUSD may retest the $95,851–$100,000 support zone in the near term. Traders should monitor this critical area for potential price reaction.

BTCUSD: Bullish Reversal from Support with Breakout TargetPotential Targets:
First Target: The recent high around $116,000.
Second Target: $122,00 and a move toward the next resistance levels from the previous uptrend.
Invalidation:
This bullish view would be invalidated if the price breaks and closes decisively below the key support level at ~$106,000.

Trading Strategy in BTCUSD Price Range✏️ CRYPTO:BTCUSD trading range is being watched around 109000 and 117000. The corrective wave is heading towards the important Break zone to find some buying momentum. The trading strategy will be to wait to buy and wait to sell when there are confirmation signs from one side at the range. There are not many real-time signals for BTC and the wave structure is also relatively difficult to trade at the moment. Therefore, waiting to trade at this range is the optimal choice.
📉 Key Levels
BUY 109000 Strong support zone
SELL 117000 Strong resistance zone
Leave your comments on the idea. I am happy to read your views.

Bitcoin - The magical $1.000.000 level!🚀Bitcoin ( CRYPTO:BTCUSD ) is not done yet:
🔎Analysis summary:
Over the course of the past couple of months, we have been witnessing a bullish continuation on Bitcoin. After the all time high breakout, there is a high chance that this bullrun will continue and Bitcoin might even retest the resistance trendline at seven digits in the near future.
📝Levels to watch:
$1.000.000
SwingTraderPhil
SwingTrading.Simplified. | Investing.Simplified. | #LONGTERMVISION

Powell's Speech Sparks Turmoil: BTC Surges and Pulls BackPowell's speech triggered a sharp surge in both BTC and gold 🚀. Amid such significant volatility, many traders will likely see their accounts wiped out 💥. BTC has pulled back today and may continue to drop to around 112,000 before rebounding ↘️↗️
⚡️⚡️⚡️ BTCUSD ⚡️⚡️⚡️
🚀 Sell@ 117000 - 11600
🚀 TP 115000 - 114000 - 113000
Daily updates bring you precise trading signals 📊 When you hit a snag in trading, these signals stand as your trustworthy compass 🧭 Don’t hesitate to take a look—sincerely hoping they’ll be a huge help to you 🌟 👇

BTCUSDBTCUSD have some more upside, wait for correction and look for buys.
Disclosure: We are part of Trade Nation's Influencer program and receive a monthly fee for using their TradingView charts in our analysis.

Bitcoin: Confident Breakout of $120K — Targets of $125–$135K!• The trend remains bullish: Bitcoin is trading above $117K–118K, has updated its maximum to $124K. Steady growth is supported by growing institutional investments and a softening regulatory environment.
• Key levels:
- Support: $110K–112K — fundamental holding zone. :contentReference
- Resistance*: $120K–123K. A breakout with volume will open the way to $125–134K.
• Technical signals:
- Short-term consolidation after growth of almost 4% — natural rest before the next rebound.
- If BTC consolidates above $125K, there is potential up to $150K.
Bottom line: Bitcoin is demonstrating a consistently bullish sentiment. Holding above $110-112K is critical, a breakout of $120-123K is a signal for growth to $125-134K, and with strong dynamics - to $150K.
Recommendations:
- Buy on dip around $112-115K with targets of $125K+
- Breakout entry** when consolidating above $123K, targets $125-134K
- Stop-loss: slightly below $110K
