BTCUSD:The meeting will likely impact further declines.Amidst uncertain news, BTCUSD is less favored than XAUUSD. After the Asian market opened, BTCUSD experienced a significant drop, exceeding 3000p. Assuming the meeting has not concluded, uncertainty will cause BTCUSD to fall further. Short-term short selling is likely to continue.
Btcusdtrade

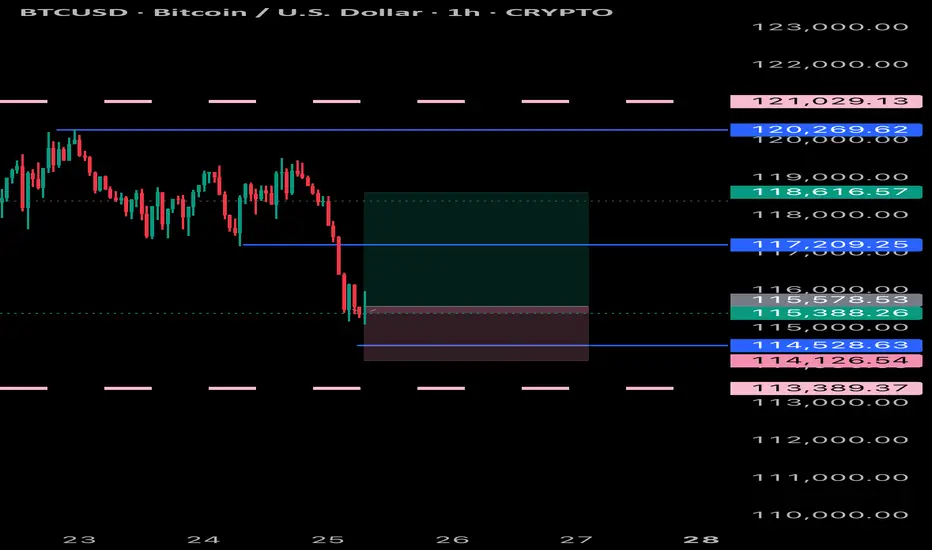
Bitcoin Setup: Long Entry Around $115-116K Area | 5:1 R/R Trade📊 If price drops into the white boxed area, I'm looking for a long entry.
But… there's a chance we sweep the lows near $115,555 first before moving up — so avoid blind limit buys. I'll wait for a reaction at the yellow line before entering.
🎯 I'm expecting price to hunt for liquidity around the white box area — essentially targeting stop losses from less experienced traders — before making its move higher.
This isn't necessarily based on strict technical logic, but rather from years of trading experience watching how these patterns typically unfold.
⚠️ **Setup is invalid if:**
• Move happens before this week's weekly candle closes
• Price breaks below the white box
• Price pumps without returning to the box
🚀 If we get this move early next week, I'm targeting at least the blue circled zone.
ATH is possible, but conservatively I'll take profits there.
📈 This trade setup offers a risk-to-reward ratio of 5:1. Without including fees, the breakeven win rate for this trade would be approximately 16.67%.
Knowing these figures in advance helps me avoid emotional trading.
💡 If you often find yourself trading based on emotions, I recommend doing this type of pre-planning and quantifying your setups before execution — it can be a simple yet highly effective improvement.
---
**Trading is simple.** You don't need multiple indicators or dozens of lines on your chart. A clean and simple chart often works best — it keeps your decisions consistent and reduces uncertainty.
Sure, it might not look flashy, and my analysis may seem a bit "plain" compared to others… but that's how I like it.
If you find this analysis useful, feel free to follow me for more updates.
---
*Disclaimer: This post is for general informational and educational purposes only. It does not constitute financial advice, investment recommendation, or a service targeting specific investors, and should not be considered illegal or restricted information in any jurisdiction.*

BTCUSDBTCUSD needs some more downside before we start to see upwards momentum.
Disclosure: We are part of Trade Nation's Influencer program and receive a monthly fee for using their TradingView charts in our analysis.

BTCUSD: buyBTCUSD's performance is consistent with my expectations. It has rebounded slightly from the bottom and is currently trading at 118,200, representing an overall rebound of approximately 1,000p. Based on the trend, it's still at the bottom. It's still a safe bet to buy.
There was no major news in the market over the weekend that had an impact on trading products. While the meeting news wasn't clearly positive or negative, there was some progress in increasing holdings in the world's largest gold ETF, increasing by approximately 4 tons compared to the previous day. Furthermore, the Federal Reserve's interest rate decision will be announced next week. These two factors appear to be influencing gold prices and warrant our attention.
BTCUSD traders can choose to take some long positions during the holiday. Gold traders can enjoy the holiday and revisit more trading opportunities next week.

BTCUSD: BUYBTCUSD's performance over the weekend was very weak, with fluctuations of only about 1,000p. However, it is currently in the process of bottoming out, and a rebound is possible at any time. Therefore, despite the sluggish market over the weekend, investors who want to trade can still choose to buy BTCUSD and profit.

Bitcoin Market Loot Plan Activated — Watch It Climb!🔥🚨 THIEF TRADER’S ULTIMATE BTC/USD HEIST PLAN! 🚨🔥
Asset: BTC/USD "Bitcoin vs U.S. Dollar" – Crypto Market Robbery in Progress!
Plan: BULLISH HEIST – LAYERED ENTRY MASTERMINDED!
🎯 THIEF’S ENTRY STRATEGY (LAYERED LIMIT ORDERS):
"The vault is unlocked! Swipe the loot at ANY PRICE! But for elite thieves, use LAYERED LIMITS like a PRO!"
Buy Limits (Example):
🔹 122,000.00 (First Dip Grab!)
🔹 120,500.00 (Second Layer – More Stealth!)
🔹 121,500.00 (Third Strike – Smooth Criminal!)
🔸 121,000.00 (Final Trap – Max Loot!)
👉 Adjust layers based on YOUR risk appetite! More layers = More escape routes!
🛑 THIEF STOP LOSS (OG STYLE):
"SL? Yeah, we have one… but REAL THIEVES adjust on the fly!"
🔪 SL @ 117,500.00 (If Bitcoin snitches, CUT & RUN!)
⚠️ Pro Tip: Tighten SL if market flips bearish! Don’t get caught!
💰 TARGET: ESCAPE BEFORE THE COPS ARRIVE! 🚔
🎯 130,000.00 (Final Heist Zone – Police Barricade!)
🏃♂️ 129,000.00 (Early Exit? Smart Thieves Take Profit & DISAPPEAR!)
⚡ THIEF TRADER’S GOLDEN RULES:
✔ SCALPERS: Only LONG side! Quick in, Quick out!
✔ SWING THIEVES: Hold & Trailing SL for MAX LOOT!
✔ RISK? Your wallet, Your rules! Don’t blame the plan!
📢 THIEF ALERT! NEWS = VOLATILITY TRAP!
🚨 Avoid new trades during high-impact news!
🚨 Lock profits with TRAILING SL!
💥 BOOST THIS HEIST PLAN! (More boosts = More stolen money!💰)
🔥 LIKE, SHARE, & FOLLOW FOR NEXT HEIST! Stay stealthy, thieves! 🏴☠️🚀
🚀 SEE YOU AT THE NEXT CRYPTO ROBBERY! 🚀
#ThiefTrader #BitcoinHeist #LayeredEntries #CryptoGang

BTC is heading to $130k+After 4 weeks of consolidation and strong liquidity grab from the weekly support BTCUSD started to rise to the upside with a bullish trend continuation showing possible upside bias. As 4h bull flag has broken the support and price started to trend, we may see this instrument reaching to $130k+?
A possible bullish trade is high probable!!

BTC perfectly hits $120K, latest BTC analysis and operations#BTCUSD
After nearly a week of volatile consolidation, BTC once again touched around 120,000. I have already made it clear to everyone before that once BTC stabilizes above 116,500, it may first touch 118,000 and then challenge the macro resistance level of 120,000. I think anyone who had carefully reviewed the strategy and thought seriously about the ideas behind it would have made substantial profits. Currently, BTC maintains an overall upward trend, but may face the risk of an overbought pullback in the short term. Those with sufficient funds in their accounts can consider shorting with a light position. BTC may reach 118,000-117,000 and stabilize before rebounding.

BTCUSD - Important signals and levelsMarket Dynamics and Trend
Current price is around $118,558, +1.18% per session. Daily range: $116,468 – $118,655.
The trend remains bullish despite the consolidation period below $120,000. Institutional interest and stable buying pressure support further gains.
Important signals and levels
A large purchase of 274 BTC (~$32 million) is a signal of large institutional demand, which often precedes volatility spikes. Monitor funding dynamics and volumes.
Capital activity - BTC is held above $114,500 due to inflows into crypto instruments; this strengthens the bullish sentiment.
Cup and Handle Pattern + Bullish MACD - Technical analyst Katie Stockton expects a raid to $134,500 (~14% upside from current levels) due to a breakout of a new ATH.

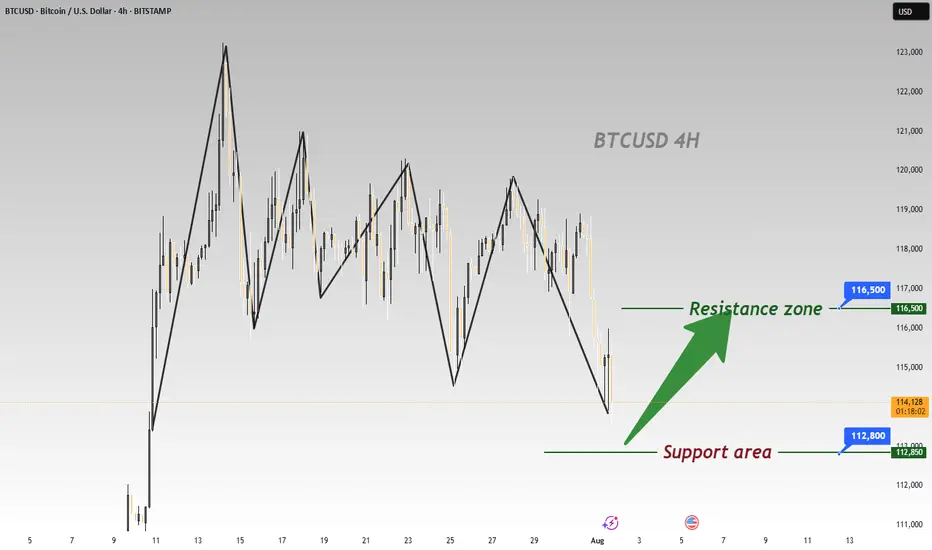
BTC Plummets Post-NFP; Go Long for Rebound to 116500BTC has plummeted significantly under the influence of the non-farm payroll data 📉, and now is an excellent opportunity to go long. Its Support level is around 112800, and according to the current trend, we can wait for a rebound to around 116500.
⚡️⚡️⚡️ BTCUSD ⚡️⚡️⚡️
🚀 Buy@ 113000 - 113800
🚀 TP 114500 - 115500 - 116500
Daily updates bring you precise trading signals 📊 When you hit a snag in trading, these signals stand as your trustworthy compass 🧭 Don’t hesitate to take a look—sincerely hoping they’ll be a huge help to you 🌟 👇
"Bitcoin’s Big Heist – Are You In or Out?"🚨 BTC/USDT HEIST MISSION – SWIPE THE BULL RUN BEFORE THE BEARS WAKE UP 💰💣
🌟Hi! Hola! Ola! Bonjour! Hallo! Marhaba!🌟
Money Makers & Robbers, assemble! 🤑💰✈️💸
Here’s your decoded BTC/USDT “Bitcoin vs Tether” Crypto Market Heist Plan, fully loaded with Thief Trading Style 🔥 TA + FA combo. We’re prepping for a bullish breakout loot – eyes on the vault, ignore the noise.
🎯 PLAN OF ATTACK:
🎯 ENTRY (BUY ZONE):
💥 “The vault’s open—time to sweep!”
DCA/Layer your buy limit orders near the 15–30 min swing lows/highs for sniper pullback entries.
Use multi-entry method to stack positions (layering / DCA) as per your ammo (capital 💵).
🛑 STOP LOSS:
Set SL at the nearest swing low wick (4H TF) — around 115000.00, adjust based on your risk/load.
SL = insurance. Not optional.
🏁 TARGET:
Lock sights on 125000.00
🎉 Or… vanish with profits before the bear cops arrive.
🔎 MARKET BACKDROP & ANALYSIS:
📈 BTC/USDT currently signals bullish vibes on the swing/day horizon — fueled by:
Macro Fuel & Fundamentals
Sentiment Radar
COT Reports
On-Chain Pulse
Intermarket Clues
🚀 Connect the dots. The smart money's already prepping a breakout move.
🧲 Scalpers Note:
Stick to the long side only. No shorting the beast — unless you’re made of diamonds.
Secure your bag with trailing SLs.
⚠️ NEWS TRIGGER ZONE – TRADE WITH TACT:
📢 Upcoming high-volatility news events can spike charts.
Avoid new entries during releases and guard open trades with trailing SLs.
Protect the loot. Always.
💖 SUPPORT THE HEIST GANG: BOOST IT!
Smash that ❤️ to boost our thief squad’s momentum!
Every click powers this underground mission – making money with style, one pip at a time. 🎯💣💵
🚀 See you in the next heist drop.
Until then – Stay stealthy. Stay profitable. Stay legendary. 🐱👤💸🏆

BTCUSDBTCUSD is getting ready for upside towards 116K-117K.
Disclosure: We are part of Trade Nation's Influencer program and receive a monthly fee for using their TradingView charts in our analysis.

BTCUSD ideaWe are waiting for our asset to reach our action zone, and based on the reaction, we’ll decide on our next moves.ALWAYS WAIT FOR A CONFIRMATION TO SEE IF THE PRICE VALIDATES THE ZONE.and you what is your vision of the EURUSD its interests me! i wait you in the commentary

BITCOIN Bullish setupBTCUSD bullish setup
Entry - 113090
Stop Loss - 112717
Target - 114260
Risk Reward - 1:3.14

BITCOIN BULLYING Bitcoin hit take profit previously and now I will be looking at another buy within this trend and price action combined with patterns

Bitcoin - The cycle is just starting!⚔️Bitcoin ( CRYPTO:BTCUSD ) just created new highs:
🔎Analysis summary:
Bitcoin is currently - especially with the new all time high breakout - just perfectly following previous cycle behavior. Since there is no real resistance above current price, apart from psychological levels, I do expect a substantial rally back to the upper channel resistance trendline.
📝Levels to watch:
$300.000
🙏🏻#LONGTERMVISION
Philip - Swing Trader

BTCUSD IdeaWe are waiting for our asset to reach our action zone, and based on the reaction, we’ll decide on our next moves.ALWAYS WAIT FOR A CONFIRMATION TO SEE IF THE PRICE VALIDATES THE ZONE.and you what is your vision of the EURUSD its interests me! i wait you in the commentary

#BTCUSDT: Minor Correction In Price Then $150,000?Hi everyone,
Hope you are doing great we are witnessing some minor bearish correction in the price and think this might be a sellers trap. We think $110,000 can be a good area to buy. Our target is at $150,000 area which look possible after looking at how price recently behaved.

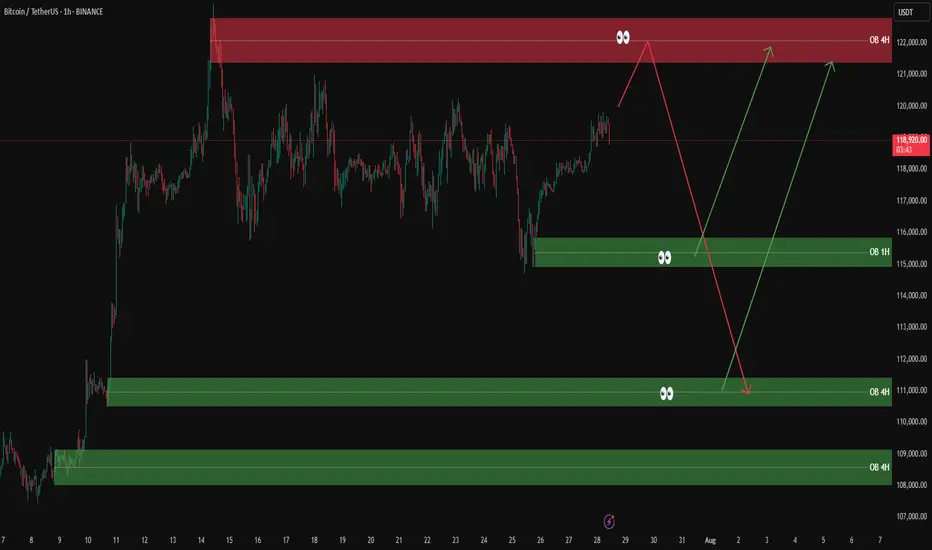
BTCUSDT analysis – 1H & 4H OB setups✅ The overall market trend is still bullish on the 1H and 4H timeframes. However, we’re watching the red 4H supply zone (around 122,000) closely for a possible short-term sell setup.
🟥 If price reaches this red OB, we’ll look for a light short position only with confirmation on the 5M or 3M timeframe.
🟩 On the downside, we are mainly interested in buy setups from the following key green OB zones:
🔹 OB 1H around 115,000
🔹 OB 4H around 111,000
🔹 OB 4H around 108,000
📌 Possible scenarios:
1️⃣ Price reaches the red OB → short with confirmation
2️⃣ Price pulls back to lower green OB zones → long with confirmation
3️⃣ Market bias remains bullish unless proven otherwise.
❌ No entry without confirmation.
Double Bullish Flag on Bitcoin — Next Rally to $135K?📊 BTCUSDT (12H) In-Depth Analysis: Major Momentum Brewing
Bitcoin (BTC) is currently exhibiting a very promising technical structure — a Double Bullish Flag, a rare yet powerful continuation formation that often precedes strong upside momentum.
This dual-pattern structure reflects market strength and smart accumulation, with bulls maintaining control while allowing for healthy pauses before potential expansion to higher levels.
---
🔍 Technical Breakdown: Double Bullish Flag Structure
🔸 1. Primary Bullish Flag:
Formed after a sharp rally from around $95,000 to $113,000 (flagpole).
Price then consolidated within a clear descending channel, forming a classic Bullish Flag pattern.
Breakout from this pattern occurred in early July, confirming bullish continuation.
🔸 2. Secondary Bullish Flag (Mini Flag):
After the breakout from the main flag, BTC formed a second smaller flag pattern — a narrow descending channel from ~$123K to ~$119K.
This is known as bullish flag stacking — a pattern of "flag on top of flag", signaling trend strength and smart consolidation.
This mini-flag now acts as a launchpad for the next potential breakout.
---
🚀 Bullish Scenario: Preparing for a Breakout
If BTC breaks above the upper resistance of the mini flag (~$123,200), it will signal a fresh bullish continuation.
🎯 Potential Upside Targets:
Conservative target: $126,000 – $128,000
Full measured move target (from flagpole): $132,000 – $135,000
✅ Confirmation criteria:
Strong candle close above $123.2K
Accompanied by rising volume and upward RSI momentum (but not overbought)
---
🧨 Bearish Scenario: Breakdown and Retest
If BTC fails to break above the flag and instead drops below the flag support (~$119,400), we may see a short-term correction.
🔻 Key Support Levels:
$117,000 – minor horizontal support
$113,000 – $115,000 – strong demand zone and previous breakout area
⚠️ As long as price holds above $113K, the broader bullish trend remains intact. A pullback to this zone could offer a prime retest-buying opportunity.
---
📌 Key Price Levels to Watch:
Level Role
$123,200 Mini-flag resistance (breakout trigger)
$121,600 Mid-range resistance
$119,400 Flag support
$117,000 Horizontal retest zone
$113,000 Major support (trend invalidation if lost)
$132K – $135K Projected breakout target
---
💡 Conclusion: BTC in Critical Zone Before Potential Expansion
This Double Bullish Flag formation is one of the most technically constructive setups BTC has shown in weeks. It reflects a strong, patient market — with bulls preparing for another leg higher.
If the breakout from the second flag confirms, Bitcoin could rally toward $135,000, backed by momentum, volume, and clean structure. However, a breakdown would only signal a short-term cooldown unless support at $113K is lost.
🧭 Stay focused on breakout confirmation, volume spikes, and market sentiment. This could be the calm before a bullish storm.
#BTCUSDT #BitcoinBreakout #BullishFlag #TechnicalAnalysis #DoubleBullFlag #BTCMomentum #BitcoinRally #CryptoOutlook #BitcoinTo135K

BTCUSDBTCUSD is correcting for more upside, last drop can happen just to complete the structure before upside starts again.
Disclosure: We are part of Trade Nation's Influencer program and receive a monthly fee for using their TradingView charts in our analysis.

BTCUSD BUYING can expect a bullish move from bitcoin as it has dropped a fair amount and can extract a reversal to the up side due to being oversold
SHORT TERM BEARISH TARGETS ON THE H4 TIMEFRAME on THE BTCUSD, here are the downside target levels (short-term bearish targets) for BTC/USDT:
🎯 Target Levels:
1. Target Point 1:
112,000 USDT
This is a minor support zone where a temporary bounce or consolidation could occur.
It aligns with previous price action support and is near the lower Ichimoku edge.
2. Target Point 2:
106,000 USDT
This is a major support level near the lower boundary of the ascending channel.
If price breaks below Target 1 decisively, this becomes the high-probability target.
