BTC shorting opportunity comes againBTC climbed above 108000 again, and the short-term bullish power was slightly stronger. According to the current strength, BTC still has room for growth, but it is still under pressure in the 109000-110000 area in the short term; if there is no major positive news, BTC may find it difficult to break through the resistance area in the short term under the current conditions, and may even experience stagflation and retreat again after approaching the resistance area.
Therefore, I think shorting BTC with the help of the resistance area is still the first choice for short-term trading. We can boldly short BTC in the 108500-109500 area and look towards the target area around 106000 again.
Btcusdtshort

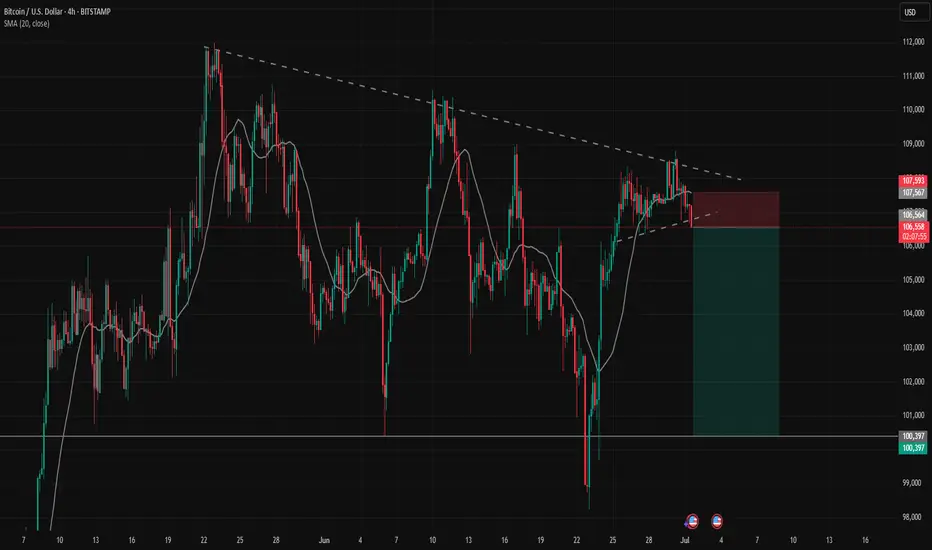
SELL BTCUSD trading signalBTCUSD confirmed the weakness at the trendline resistance zone on the h4 time frame.
The h1 time frame price confirmed that the sellers won when the candle closed below the nearest trendline support zone.
In terms of wave structure, there is no strong support zone that is strong enough to keep the BTC price uptrend in the short term. Therefore, the target of the SELL signal can reach 100,400. That is the wick area of the past liquidity candle where the buyers won over the sellers and pushed the price up sharply.
BTCUSDT analysis - 1H FVG and OB SetupsBitcoin has reacted cleanly to all marked zones so far.
Right now, we are waiting for price to reach the green circle area before making a decision. If we get confirmation on lower timeframes, we can look for a potential short setup on BTC.
Key zones are marked on the chart. Always wait for price to reach these levels and take your reactions on lower timeframes for precise entries.
Stay patient and let the chart come to you.
—
📊 ProfitaminFX | Gold, BTC & EUR/USD
📚 Daily setups & educational trades
📱 IG: @profitamin.fx

BTC\USD SHORT TRADE SETUP BTC/USDT – Short Trade Setup Breakdown (Technical Outlook
Trade Thesis
The area between 103,800–105,000 serves as a strong supply zone, and we’re seeing signs of exhaustion in bullish momentum. The setup suggests a high-probability short opportunity with tight confirmation.
🔸 Entry: Positioned at 103,800, just below resistance, to capture early weakness and avoid chasing.
🔸 Risk Level: The resistance at 105,000 is critical — any break and close above may invalidate this setup.
🔸 Targets:
🎯 Target 1: 97,000 – conservative exit at mid-range demand zone
🎯 Target 2: 96,000 – full target near bottom of the descending channel

Short BTC, it is about to retrace and test 100000 again!As BTC gradually fell back, the rebound did not stand above 110,000 in the short term, proving that there is strong selling pressure above, and the trend line formed by the technical high point 111,000 and the second high point 110,000 formed an important resistance area, which limited the rebound space of BTC and strengthened the demand for BTC's short-term retracement.
According to the current trend, the short-term oscillation bottom area of 106,000 may be broken at any time. Once it falls below the oscillation area, it may arouse a certain degree of profit-taking chips and stimulate BTC to accelerate its decline. I think BTC will at least test the 105,000-104,000 area again during the retracement, and may even test the 100,000 integer mark again.
Therefore, shorting BTC is still the preferred option for current short-term trading.
Consider shorting BTC in the 108,000-109,000 area, and the target area in the short term is 104,500-103,500. After breaking this area, the target can be extended to 101,000-100,000.
BINANCE:BTCUSDT BINANCE:BTCUSDT BITSTAMP:BTCUSD

Thief Trader Setup: Robbing the BTC/USD Market Reversal🏴☠️💰 Bitcoin Heist Blueprint: BTC/USD Robbery Plan by the Thief Trader Crew 💰🏴☠️
(Swing & Day Trade Outlook – Clean Entry, Clean Exit, No Fingerprints Left Behind)
🌟 Hi! Hola! Ola! Bonjour! Hallo! Marhaba! 🌟
To All Market Raiders & Silent Money Makers 🤑💸💰✈️
This isn't your average BTC/USD analysis — this is a strategic market heist, crafted from the Thief Trading Playbook.
We're planning a clean operation based on both technical setups and fundamental awareness.
Let’s enter smart, exit faster, and leave no trace — just profit. 🏆
🎯 THE GAME PLAN: Unlocking the BTC/USD Vault
📈 Entry – “The Vault’s Cracked Open!”
The plan kicks off with retest entries on the 15 or 30-minute chart.
Sell limits should be placed around recent highs or lows where market momentum pulls back.
Precision and patience are your tools.
🛑 Stop Loss – Backup Escape Route
Use the 1D swing high/low (e.g., 104.500) as your SL zone.
Position size smartly, factoring in risk %, lot size, and number of active orders.
🏁 Target – 94.000 (Or Bail Out Before It Gets Hot)
Don’t stick around too long — cash out near the zone or before if price slows or traps emerge.
Secure the bag, vanish before resistance bites back.
🧲 Scalpers – Quick In, Quick Out!
Stick to the short side only — short the bounces, trail your SL, and move with stealth.
Big players can strike straight; others can shadow the swing crew and trail behind with protection.
🧠 Why This Works – Market Pulse
BTC/USD is facing overbought pressure, consolidation traps, and is nearing a critical MA Zone where reversals tend to form.
Momentum shows signs of weakening, and the bears are regrouping — that’s where we slip in and out.
Supporting Factors Include:
Macro trends
Fundamental sentiment
COT positioning
On-Chain signals
Intermarket flow
Key psychological levels
🔍 All these build the narrative behind this bearish setup. This is more than just price action — it's a calculated move.
⚠️ Trading Risk Alert: Stay Off the Radar During News Drops 📰🚨
Avoid new entries during major news events — increased volatility = increased risk.
Use trailing stop-losses to lock in profits while staying protected during spikes.
❤️ Like the Plan? Power the Crew!
If this setup helped you see the market differently, hit the 💥Boost Button💥.
Every like supports the effort and helps sharpen our future plans.
Trade with style, move with purpose — Thief Trader Style.
🚀 Stay tuned for the next setup from the shadows. Until then — stay sharp, stay strategic, and always protect your profits. 🐱👤💰📉📈

BTC Slumps Below 100000, Rebounds to Test 109500 Short Zone💎 BTC Rebounds After 100000 Drop, Eyes Short at 109500 Resistance 📊
BTC dipped below the 100000 threshold 🔻 before rebounding near 98000 🔺—a move tied to DXY weakness and easing geopolitical tensions. Now challenging the 110000 mark 🔼, it faces stiff resistance at 109500. First-time 110000 tests often spark pullbacks, making shorts the favored play here 📉.
🚀 Sell@108500 - 107500
🚀 TP 106500 - 105500
Accurate signals are updated every day 📈 If you encounter any problems during trading, these signals can serve as your reliable guide 🧭 Feel free to refer to them! I sincerely hope they'll be of great help to you 🌟 👇

BTCUSD: $110,000 Resistance as Key Battlefield for Bulls & BearsAfter BTC price broke below the $100,000 integer threshold, it rebounded near $98,000 due to DXY weakness and eased geopolitical tensions, currently challenging the $110,000 level. However, strong resistance exists at $110,000. Historical trends show that BTC tends to trigger pullbacks when rising to the $110,000 integer mark. If it fails to break through $110,000, shorting on rallies is still recommended.
BTCUSD
sell@108500-109500
tp:107500-106500
I am committed to sharing trading signals every day. Among them, real-time signals will be flexibly pushed according to market dynamics. All the signals sent out last week accurately matched the market trends, helping numerous traders achieve substantial profits. Regardless of your previous investment performance, I believe that with the support of my professional strategies and timely signals, I will surely be able to assist you in breaking through investment bottlenecks and achieving new breakthroughs in the trading field.

BTC's Mid 2025 OutlookBitcoin is currently trading around $107,000 on the 4-hour 4H timeframe, navigating a consolidation phase following a sharp rally that culminated in a new all-time high of $111,900 in May 2025. Despite recent price corrections, BTC remains up 3% on the week, reflecting underlying bullish momentum. This sustained strength hints at continued confidence in the market, particularly among larger players.
A notable development supporting this view is the increase in the number of Bitcoin wallets holding at least 10 BTC, which has surged to a three-month high of 152,280. This metric is widely regarded as a proxy for whale activity and may indicate renewed institutional interest, especially amid accelerating inflows into spot Bitcoin ETFs.
On the 4H chart, Bitcoin appears to be consolidating within a tight range, hovering just beneath a key supply zone at $107,000, which could act as short-term resistance.
Several potential outcomes are currently in play:
Bullish scenario:
A breakout above the $107,000–$108,000 range could clear the path toward the critical resistance at $115,000. A successful move above this threshold would likely signal resumption of the broader uptrend, with some technical analysts eyeing a potential cup and handle formation that could project long-term targets up to \$180,000
Bearish scenario:
If BTC fails to hold above the current level, it may correct toward the first major support at $102,800, with further downside risk to $98,500. In a more pessimistic setup, price could extend losses toward $96,000, especially if macroeconomic or geopolitical pressures intensify
Key levels to watch:
Resistance: $107,000 - $115,000
Support: $102,800 - $98,500 - $96,000
Market Sentiment and External Drivers:
Bitcoin's price is being shaped not only by technical dynamics but also by powerful external forces
Spot Bitcoin ETFs:
The US regulatory greenlight for spot ETFs has dramatically altered market dynamics. With projections of $190 billion in assets under management AUM for these products by the end of 2025, institutional access to BTC has become more streamlined, providing strong tailwinds for long-term accumulation
Geopolitical risk and macro conditions:
Global uncertainty, particularly due to escalating tensions in the Middle East and potential US military involvement, has introduced volatility. At the same time, rising inflation and economic instability in developed markets is a double-edged sword, either undermining risk assets or conversely boosting Bitcoin’s narrative as digital gold and a hedge against fiat devaluation
Forward-Looking Outlook:
Bitcoin is at a critical juncture. The ability to sustain above $107,000 and reclaim the $115,000 resistance will be pivotal. A confirmed breakout could open the door to price discovery and possibly a surge toward $130,000 to $150,000, with $180,000 as an extended target in more bullish scenarios
However, a failure to hold key support levels could shift momentum toward the bears, prompting a deeper correction toward the $96,000 zone. Traders should monitor:
- Price reaction around $107,000 and $115,000
- ETF inflow data and AUM growth
- Macro news especially inflation reports and central bank commentary
- Developments in global conflict zones impacting risk appetite
Conclusion:
Bitcoin’s medium-term direction hinges on a delicate interplay of technical consolidation institutional flow and macro geopolitical signals. While the bullish structure remains intact for now a decisive move in either direction above $115,000 or below $98,000 could set the tone for the next major trend.

Bitcoin's Bullish DriversThe four bullish drivers behind Bitcoin's rally:
1.Institutional involvement: BlackRock and other institutions have accumulated large positions through ETFs, with OTC inventory declining, creating a scarcity effect in the market.
2.Policy tailwinds: Escalating expectations of Federal Reserve rate cuts have enhanced Bitcoin's attractiveness under low-interest-rate environments.
3.Regulatory breakthrough: China's Guotai Junan International has obtained regulatory approval, opening a compliant channel for Chinese capital.
4.Technical support: The 50-day moving average has broken above the 200-day moving average, forming a "golden cross" that confirms the long-term upward trend.
BTCUSD
buy@106000~107000
SL:105000
TP:108000~109000
I am committed to sharing trading signals every day. Among them, real-time signals will be flexibly pushed according to market dynamics. All the signals sent out last week accurately matched the market trends, helping numerous traders achieve substantial profits. Regardless of your previous investment performance, I believe that with the support of my professional strategies and timely signals, I will surely be able to assist you in breaking through investment bottlenecks and achieving new breakthroughs in the trading field.

BTC Rebounds After 100000 Drop, Eyeing Short at 109500 Resistanc📈 BTC Rebounds After 100000 Drop, Eyeing Short at 109500 Resistance
BTC dropped below the 100000 threshold 🔻 and then rebounded near 98000 🔺. This movement is related to the decline of DXY and the reduction of geopolitical risks. Now, BTC is challenging the 110000 level 🔼. The overhead resistance is around 109500. First - time tests of the 110000 level typically trigger pullbacks, so we favor short positions here 📉
🚀 Sell@109500 - 108500
🚀 TP 107500 - 106500 - 105500
Accurate signals are updated every day 📈 If you encounter any problems during trading, these signals can serve as your reliable guide 🧭 Feel free to refer to them! I sincerely hope they'll be of great help to you 🌟 👇

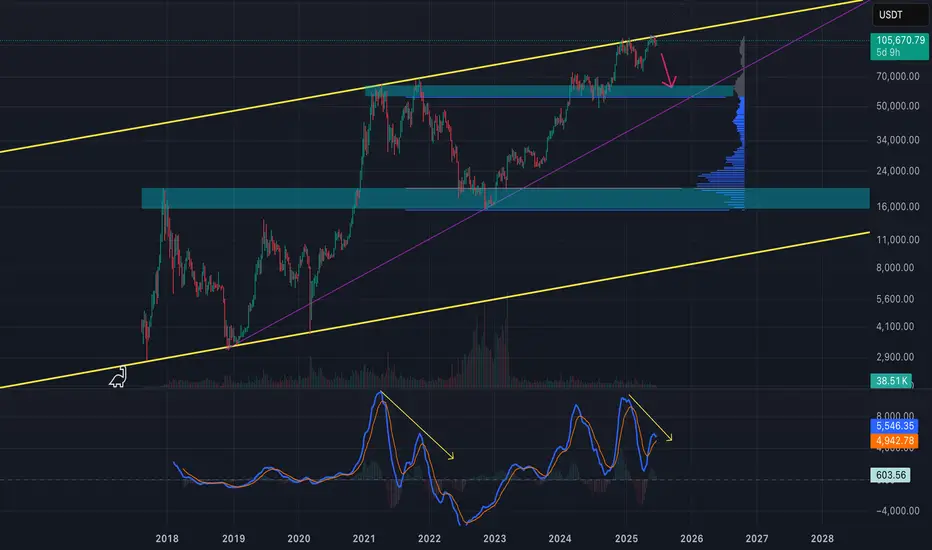
BTC - Getting 2021 Double Top/Bearish VibesLooking at the weekly chart for BTC, I'm seeing similar price action from when we double topped in 2021. We hit the top of the channel, corrected, and then had a slightly higher high before going down hard. Again we hit the top of the channel, had a strong correction, only to hit it again for a slightly higher high. But the signs of market weakness are showing in the indicators and price action. Not to mention war is looming between Israel and Iran. I'm taking a defensive posture here. I think if the bears take control, we could hit the $60k liquidity area that we missed on the last correction. We can reassess the market better at the time based on the price action and current events.
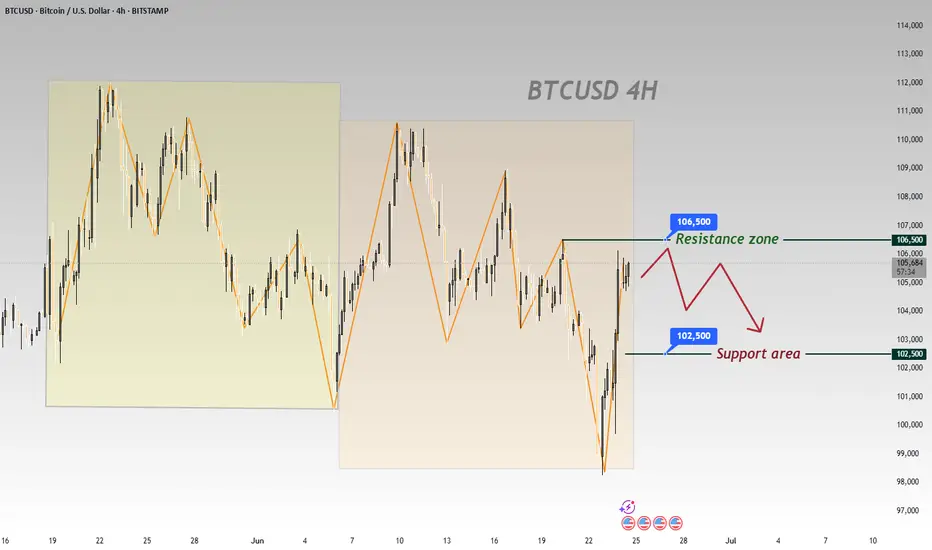
BTCUSD 4-Hour Chart Analysis: Range Bound with Bearish BiasFrom the 4 - hour chart of BTCUSD, the price movement shows obvious range - bound fluctuation characteristics 📊.
Currently, it is necessary to focus on the key resistance and support zones 🎯:
From a technical perspective, BTC is likely to oscillate repeatedly within the range in the near term 🔄, yet the overall trend leans bearish 🐻.
In the short term, opportunities for buying low and selling high within the range can be monitored 📈📉
⚡️⚡️⚡️ BTCUSD ⚡️⚡️⚡️
🚀 Sell@106500 - 105500
🚀 TP 104500 - 103500
🚀 Buy@102500 - 103500
🚀 TP 104500 - 105500
Accurate signals are updated every day 📈 If you encounter any problems during trading, these signals can serve as your reliable guide 🧭 Feel free to refer to them! I sincerely hope they'll be of great help to you 🌟 👇
A bearish trend is gradually taking shape.From a technical perspective, the complete breakdown of the box bottom, coupled with the MACD indicator about to fully crossing below the zero axis, both indicate that bullish momentum is weakening and a bearish trend is gradually forming. Short-term bulls need to take a temporary break and wait for the construction of a stabilizing platform. For bears, according to the current trend, they can lay out short positions on rallies. The ideal entry position is near the lower edge of the box, and they can try to lay out positions boldly after setting stop-losses.
On the news front, "Laote"'s policies change frequently, with extremely high uncertainty. The market needs global stability, and there has been no bull market in history built in a turbulent environment. Therefore, we need to treat market conditions cautiously, avoid blind and radical operations, and only by maintaining rationality can we respond to market changes.
you are currently struggling with losses,or are unsure which of the numerous trading strategies to follow,You have the option to join our VIP program. I will assist you and provide you with accurate trading signals, enabling you to navigate the financial markets with greater confidence and potentially achieve optimal trading results.
Trading Strategy:
sell@102300-102800
TP:100000-100500

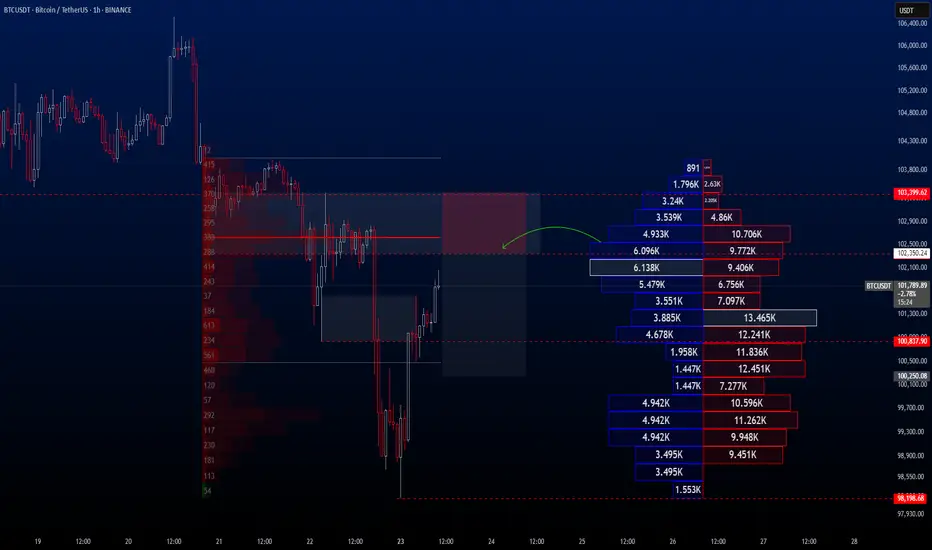
BTCUSDT Hello traders.
The BTCUSDT trade I shared the other day played out just as expected, with BTC experiencing a significant drop in value shortly after. The price fell all the way down to the 98K level.
Following this decline, I anticipate a short-term rebound toward the 102K–103K range, after which I expect the downtrend to resume. Therefore, I’ve placed a Sell Limit order at 102,350, and I’m currently waiting for the price to reach that level.
If you'd like, you can consider this opportunity in the same way.
🔍 Trade Details
✔️ Timeframe: 1-Hour
✔️ Risk-to-Reward Ratio: 1:2
✔️ Trade Direction: Sell Limit
✔️ Entry Price: 102,350.24
✔️ Take Profit: 100,250.08
✔️ Stop Loss: 103,399.62
🕒 If the trade doesn’t gain strong momentum, I will keep the position open only until 23:00 (UTC+4) today. Otherwise, I will manually close the trade—either in profit or at a loss—depending on price action.
🔔 Disclaimer: This is not financial advice. I’m simply sharing a trade I’ve taken based on my personal trading system, strictly for educational and illustrative purposes.
📌 Interested in a systematic, data-driven trading approach?
💡 Follow the page and turn on notifications to stay updated on future trade setups and advanced market insights.
BTC/USD:Intraday Trading Analysis and StrategyI. Daily Chart Trend Analysis
On the daily timeframe, BTC/USD closed with a small bearish candle yesterday, forming a consecutive series of bearish candles that clearly indicate a downtrend. The price continues to trade below the moving average system, and the technical indicators have formed a death cross, further confirming the bear-dominated market structure. However, in this clear downtrend, two key risks require attention:
1.Oversold rebound risk: After sustained declines, the market may experience a significant corrective rally.
2.Priority of risk control: Regardless of market movements, strict stop-loss management and position sizing remain core trading principles.
II. Hourly Chart Technical Analysis
The hourly chart shows that the price fell sharply under selling pressure during U.S. trading hours yesterday, breaking below the key $100,000 level. This morning, the price rebounded strongly after hitting a low, with the breakdown level near $102,700. Currently, the K-line forms a large bullish candle, and the technical indicators have formed a golden cross, suggesting that a corrective rally is likely to continue today. Note that if the price breaks above the breakdown level of $102,700, the short-term downtrend may be disrupted, and the market could shift to a range-bound pattern.
BTCUSD
sell@102000-102500
tp:101000-100500
I am committed to sharing trading signals every day. Among them, real-time signals will be flexibly pushed according to market dynamics. All the signals sent out last week accurately matched the market trends, helping numerous traders achieve substantial profits. Regardless of your previous investment performance, I believe that with the support of my professional strategies and timely signals, I will surely be able to assist you in breaking through investment bottlenecks and achieving new breakthroughs in the trading field.

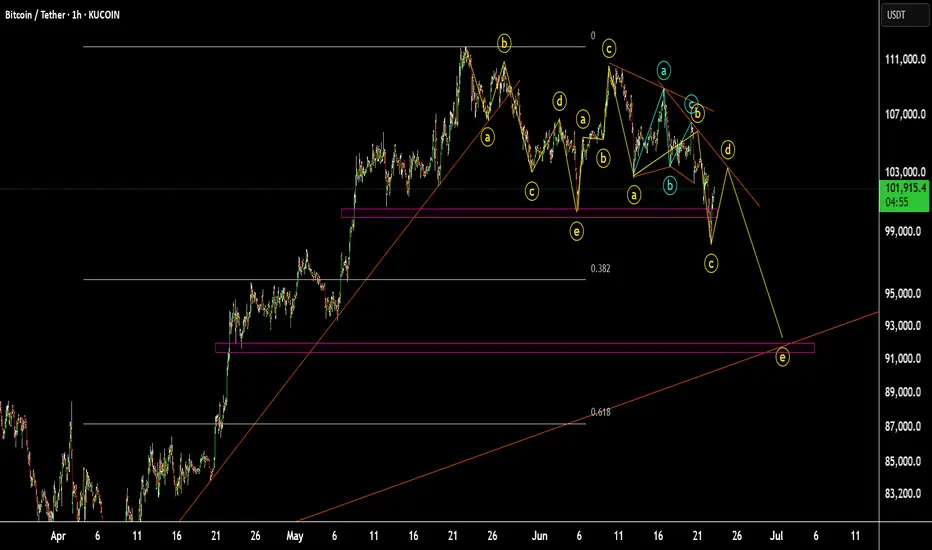
BTCUSD scenario 1#BTCUSDT is bearish umtil 92k.
because of main trendline is break
the main flow is 535 correction in this scenario.
Pullback Correction after a Sharp DeclineTechnical Analysis of BTC Contracts: As of today, on the daily timeframe (major cycle), yesterday closed with a small bearish candle, showing consecutive bearish declines. The price remains below moving averages, and attached indicators are in a death cross, clearly indicating a downward trend. With the trend being evident, two key points should be noted: First, guard against significant pullback corrections; Second, risk control must be prioritized under any circumstances, which is of utmost importance.
On the hourly timeframe (short cycle), the price fell under pressure during the US session yesterday, breaking below the 100,000 level. It rebounded after hitting the intraday low in the morning. The breakdown level is near the 102,700 area. Currently, the K-line shows a large bullish rebound, and attached indicators form a golden cross, suggesting that corrective movements will prevail today. However, the breakdown level (102,700) must not be breached; otherwise, the corrective trend may fail to sustain, which aligns with typical price movement patterns.
you are currently struggling with losses,or are unsure which of the numerous trading strategies to follow,You have the option to join our VIP program. I will assist you and provide you with accurate trading signals, enabling you to navigate the financial markets with greater confidence and potentially achieve optimal trading results.
Trading Strategy:
sell@102300-102800
TP:100000-100500

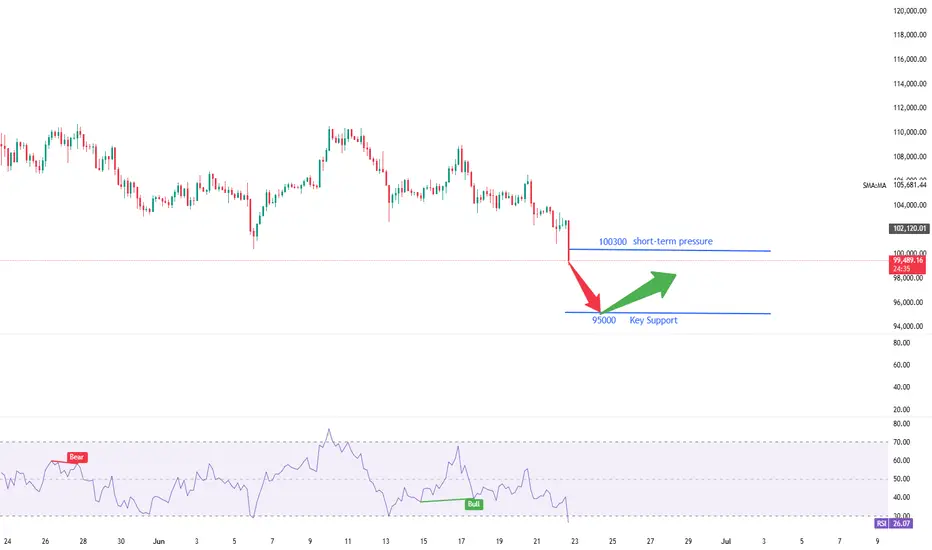
Need to wait for the key turning point.The Bitcoin market has currently broken below the key support level of 100,300, confirming a downward trend reversal. A daily-level recovery rally is now underway, and the 4-hour wave structure has not yet concluded. First, the downside target is seen at 95,000 to 98,000. Next week, the key turning point at 92,000 will likely determine the low of a rebound. Although this rebound low is not the ultimate bottom, it will trigger a relatively strong rebound after formation.
you are currently struggling with losses,or are unsure which of the numerous trading strategies to follow,You have the option to join our VIP program. I will assist you and provide you with accurate trading signals, enabling you to navigate the financial markets with greater confidence and potentially achieve optimal trading results.
Trading Strategy:
buy@95000-95500
TP:97500-98000
BTCUSDTHello traders. Wishing each of you a great weekend ahead!
Even though it's the weekend, I’ve spotted a sell opportunity on the BTCUSDT pair and decided to share it with you. However, we should also keep in mind that weekend markets tend to have lower volume. That said, I will still proceed with this trade based on my own risk parameters and trading strategy.
🔍 Trade Details
✔️ Timeframe: 30-Minute
✔️ Risk-to-Reward Ratio: 1:2
✔️ Trade Direction: Sell
✔️ Entry Price: 103815.32
✔️ Take Profit: 102640.12
✔️ Stop Loss: 104402.06
🕒 If the trade does not continue with strong momentum, I will keep the position open only until 23:00 today. Otherwise, I will close it either in profit or at a loss depending on the price action.
🔔 Disclaimer: This is not financial advice. I’m simply sharing a trade I’ve taken based on my personal trading system, strictly for educational and illustrative purposes.
📌 Interested in a systematic, data-driven trading approach?
💡 Follow the page and turn on notifications to stay updated on future trade setups and advanced market insights.

BTC Consolidates 104000-105000: Bearish Breakdown Looming?BTC Technical Update: Bitcoin has been consolidating within the 104000-105000 range for an extended period, with the overall trend showing a downward bias. With the overall trend tilting bearish, traders should watch for a break below 103500 to confirm the next leg down. 📉
⚡️⚡️⚡️ BTCUSD ⚡️⚡️⚡️
🚀 Sell@ 105000 - 104500
🚀 TP 102500 - 101500
Accurate signals are updated every day 📈 If you encounter any problems during trading, these signals can serve as your reliable guide 🧭 Feel free to refer to them! I sincerely hope they'll be of great help to you 🌟 👇

Evening BTC Market Analysis and Trading RecommendationsToday, U.S. markets are closed, leading to light trading activity and relatively limited overall market volatility. From a technical analysis perspective, the 4-hour K-line chart currently shows prices trading below the middle band of the Bollinger Bands, exhibiting a classic range-bound consolidation pattern. Bulls and bears are locked in a tug-of-war between key support and resistance levels, with K-line formations alternating between bullish and bearish patterns.
In terms of chart structure, the lower support zone has demonstrated strong buying conviction, while the upper resistance level has exerted clear restrictive force. Multiple failed upward breakouts have formed a short-term top. This box consolidation—characterized by resistance above and support below—is expected to sustain sideways trading through Friday.
Against the backdrop of no major positive catalysts, bearish momentum may gradually dominate if no substantial bullish triggers emerge. Maintain a trading strategy of selling into strength.
BTCUSDT
105000-105500
tp:104000-103000
Investment itself is not the source of risk; it is only when investment behavior escapes rational control that risks lie in wait. In the trading process, always bear in mind that restraining impulsiveness is the primary criterion for success. I share trading signals daily, and all signals have been accurate without error for a full month. Regardless of your past profits or losses, with my assistance, you have the hope to achieve a breakthrough in your investment.

Expect BTC/USD to drop to 102000 post-Fed rate decisionBTC/USD Update 📈
BTC rebounded from 103500 support, now at ~105500. Short-term correction may test 100000 psychological support ⚠️
I think the Fed's interest rate decision this time may cause BTCUSD to drop directly to 102000 .
⚡️⚡️⚡️ BTCUSD ⚡️⚡️⚡️
🚀 Sell@ 105000 - 104500
🚀 TP 102500 - 101500
Accurate signals are updated every day 📈 If you encounter any problems during trading, these signals can serve as your reliable guide 🧭 Feel free to refer to them! I sincerely hope they'll be of great help to you 🌟 👇
