LRC Showing Renewed StrengthLRC - movement is observed within the bullish flag pattern
We have exited the liquidity zone after a false breakout
It is now more likely that the movement will continue within the pattern to its upper boundary according to Fibonacci levels
Full breakdown with levels and graphs on the website
Bullflags

Bullish Flag Formation on QNTQNT formed a bullish flag, the movement reached the liquidity area that was at the bottom
It is more likely that an upward movement and a pattern execution are expected, reaching the liquidity level formed above
Full breakdown with levels and graphs on the website

SOL bullish flagSOL has formed a bullish flag, the movement is still within the pattern
Liquidity has formed at the upper level, which the price is more likely to reach
At the bottom of the pattern, an upward movement is observed, as each subsequent bottom is higher than the previous one
Full breakdown with levels and graphs on the website

XRP Review With Focus on Trend Shifts XRP is completing the previously formed bearish butterfly pattern on the global timeframe.
At the same time, a large bullish flag is visible in the chart structure, within which the price continues to move. The lower liquidity zone has already been fully engulfed, while the upper liquidity zone remains intact, making it potentially attractive for a subsequent test.
Also, each new correction forms a higher bottom, indicating a possible global trend recovery. If the lower boundary of this liquidity zone is broken, the structure could shift to a deeper downward movement.
Full breakdown with levels and graphs on the website

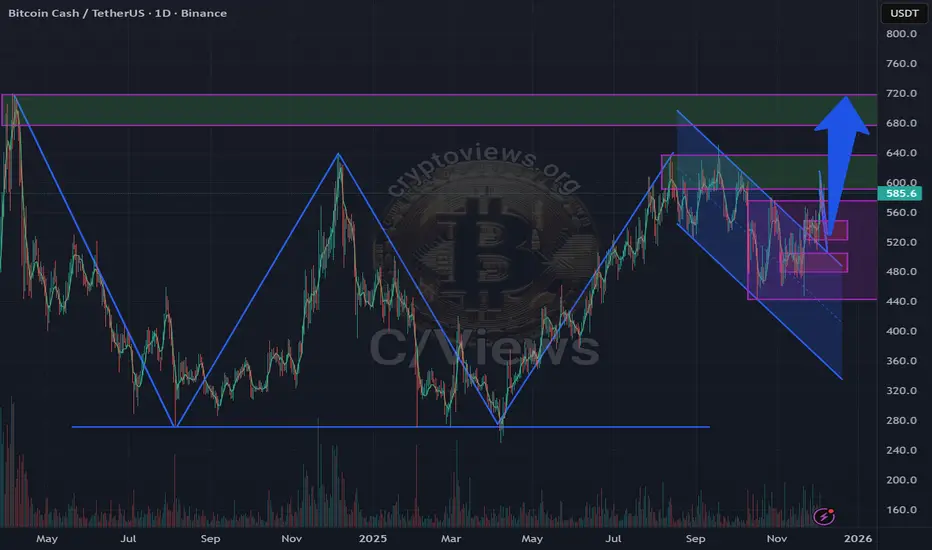
BCH Market Structure Review With Global W Pattern FlagA W-pattern has formed on BCH, but the current breakout is accompanied by a bullish flag with a long flagpole. Key liquidity zones remain below the price, so a pullback and a possible false breakout before the rally are likely.
The prolonged accumulation since October 2025 increases the upside potential. If there is no reaction in the coming days, a retest of the 0.5 level of the sideways trend, coinciding with the boundary of the global flag, is possible, the current breakout could be false.
Long-term upside potential remains until the upper liquidity zones.
Full breakdown on website
SPX WEEK 48 — Strong Bounce Into Year-End! 2026 BULL RUN COMING?Strong week for the SP:SPX index. After two weeks of hesitation candles, price finally shifted back into strength and pushed decisively higher. This week’s candle not only reclaimed momentum but fully erased last week’s cooling-off behavior.
Price also moved well above the key mid-range levels that traders usually watch to define trend health. It’s now sitting firmly above the major risk zone and continues building distance away from it — a clear sign of strength. From the moment this week’s upside break triggered, the index has gained roughly 1.9%, and that kind of move typically translates into solid returns for options traders playing directional setups.
Major support zones sit lower around 5900, 5100, and the deeper structural support near 4000. As long as price holds above the upper layers of support, momentum remains intact.
On the higher-timeframe monthly chart, the trend has been active for eight straight months with no signs of exhaustion. Price is still far above the level where the monthly trend began, and even further above the long-term midline — showing how dominant the larger trend still is.
The 2-day chart continues to support the overall bullish structure, breaking above short-term levels and maintaining strength after multiple confirmations earlier in the week.
This week was a clean continuation of the broader uptrend — strong candle, strong momentum, and strong positioning above every major structural region.
Elite clarity. Elite precision. More coming soon.

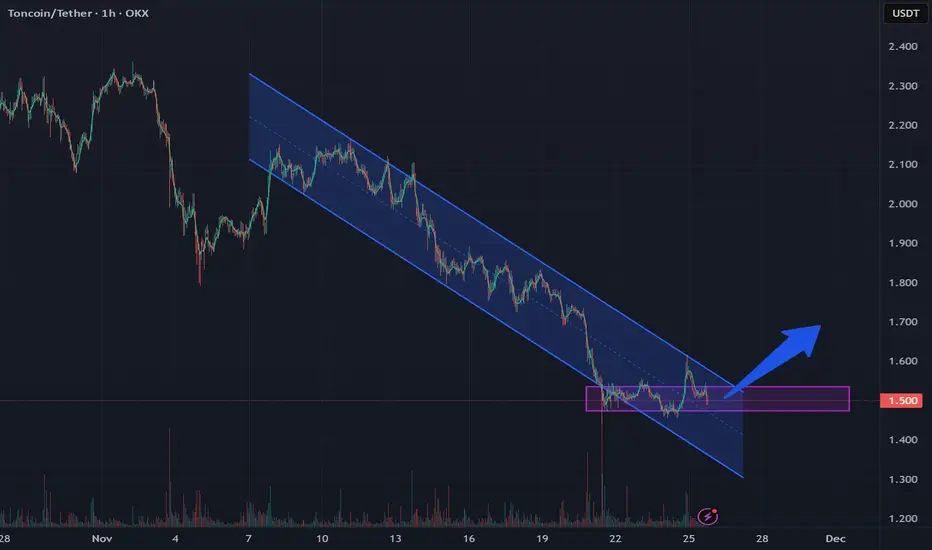
TON forms a bullish flag pattern with a local liquidity zoneTON has formed a bullish flag pattern, and we've also reached the local liquidity zone we've collected
According to the pattern, an upward rebound is expected
Current price: $1.492
If the price falls below the zone of interest and consolidates below, the movement will continue in a downward corridor within the pattern
Solana is forming a bullish flagSOL has formed a bullish flag, with movement in a local uptrend being established. The high in the purple areas is highly likely to be broken
Two 4H imbalances are located above. This is where sellers are most likely to react

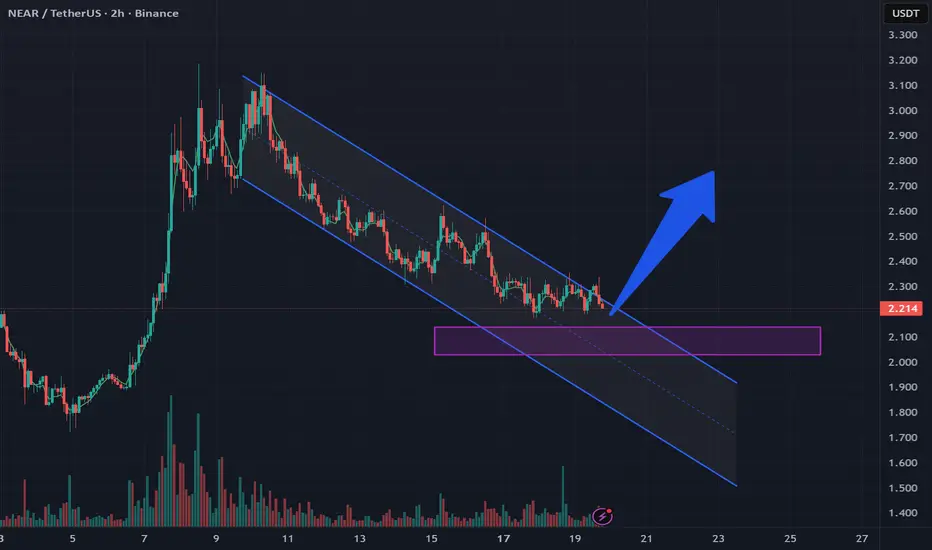
NEAR shows bullish flag setup with potential for upward movementNEAR has formed a bullish flag pattern, and sideways movement is also observed within the pattern
A move higher is more likely, above the MA50 and MA200 , followed by a move to the $2.431 area and beyond
Current price: $2.298
Upwards to the purple area and below are more likely, and the price is more likely to decline further
GOLD HOLDS STRONG ABOVE $4,200! 🚀 XAUUSD DAILY MARKET ANALYSIS
Thursday, November 14, 2025
💰 GOLD HOLDS STRONG ABOVE $4,200! 📈
Current Price: $4,189 - $4,235 💎
Yesterday's Close: $4,231 (+0.86%)
Weekly Gain: +5.4% (MASSIVE!) 🔥
Status: 🟢 CONSOLIDATING AT HIGHS
🎯 MARKET UPDATE - WHAT'S HAPPENING NOW?
Gold is CONSOLIDATING above the critical $4,200 level after yesterday's explosive breakout! The market is catching its breath after a 5-day winning streak that pushed prices up over $330 from last month's lows.
Key Developments:
✅ Government Shutdown ENDED - US House passed funding bill
✅ Strong Above $4,200 - Holding key psychological level
✅ Fed Rate Cut at 80% - Economists now predicting December cut
✅ Four Consecutive Green Days - Bullish momentum intact
✅ Testing $4,235 - Approaching critical resistance zone
📊 TECHNICAL ANALYSIS
Market Structure: BULLISH CONSOLIDATION 🟢
The rally has paused for a healthy consolidation. This is NORMAL and HEALTHY after a 5.4% weekly gain. Gold is building a base for the next leg up!
Key Observation: Price is respecting the $4,189-$4,235 range today - this is a coiling pattern before the next move.
Critical Support Levels (BUY ZONES) 🔵
Support 1: $4,189 - $4,200 (MAJOR - Former resistance)
Support 2: $4,157 - $4,160 (Strong base)
Support 3: $4,114 - $4,120 (Key level)
Support 4: $4,048 - $4,060 (Breakout point)
Support 5: $3,987 - $4,002 (November open)
Key Resistance Levels (SELL/TARGET ZONES) 🔴
Resistance 1: $4,235 - $4,243 (Current test)
Resistance 2: $4,252 - $4,254 (Critical breakout level)
Resistance 3: $4,313 - $4,320 (Next target)
Resistance 4: $4,356 - $4,382 (All-time high zone)
📈 TECHNICAL INDICATORS
RSI (14): 64 (Bullish but cooling - Room to move higher) ✅
MACD: Positive and rising - Strong bullish signal ✅
Stochastic: Neutral zone - Allows for upward movement ✅
Moving Averages:
Price WELL ABOVE all EMAs ✅
EMA 20/50/200 all aligned bullish ✅
Golden Cross confirmed ✅
Volume: Strong on rallies, lighter on dips (Healthy) ✅
Bollinger Bands: Price near upper band - Volatility expansion mode
🎯 TODAY'S TRADING STRATEGIES
SCENARIO 1: BREAKOUT CONTINUATION 🚀 (65% Probability)
IF Gold Breaks Above $4,252:
This is the CRITICAL LEVEL to watch! A close above $4,252 signals resumption of the major uptrend.
LONG Setup:
Entry: Break and close above $4,252 with volume
Targets:
TP1: $4,313 📍 (+60 pips)
TP2: $4,356 📍 (+104 pips)
TP3: $4,382 📍 (+130 pips - All-time high retest)
Stop Loss: $4,210 (Below consolidation)
Risk/Reward: Excellent 1:3+ ratio ✅
SCENARIO 2: HEALTHY PULLBACK 📉 (35% Probability)
IF Gold Breaks Below $4,189:
A pullback would be healthy and provide better entry opportunities.
BUY THE DIP Strategy:
Entry Zone 1: $4,157-$4,170 (Best value)
Entry Zone 2: $4,114-$4,120 (Strong support)
Targets:
TP1: $4,200 📍
TP2: $4,243 📍
TP3: $4,280 📍
Stop Loss: Below $4,100
⚠️ NOTE: Dips are BUYING opportunities in this bullish trend!
💎 BEST TRADE SETUP FOR TODAY
CONSERVATIVE APPROACH (Recommended) 🎯
WAIT for one of these clear setups:
Option A - Breakout Trade:
Entry: Above $4,252 (confirmed break)
Target: $4,313 → $4,356
SL: $4,210
Option B - Pullback Trade:
Entry: $4,157-$4,170 (on dip)
Target: $4,243 → $4,280
SL: $4,135
DO NOT CHASE at $4,220-$4,240! Wait for clear direction.
🌍 FUNDAMENTAL ANALYSIS
BULLISH CATALYSTS ⬆️⬆️⬆️
✅ Fed Rate Cut Odds: 80% - Economists now strongly expect December cut
✅ Government Reopening - But delayed data creates uncertainty = Gold support
✅ Missing Economic Data - October CPI/jobs reports delayed/may never release
✅ Weak Labor Market - 11,000+ weekly job losses continue
✅ Dollar Weakness - DXY struggling at resistance
✅ Central Bank Demand - 634 tonnes purchased YTD, expecting 750-900 total
✅ ETF Inflows - $64 billion added in 2025
✅ Safe-Haven Demand - Geopolitical tensions persist
Risk Factors ⬇️
⚠️ Overbought Short-Term - RSI 64, near 70 threshold
⚠️ Profit Taking Risk - After 5-day rally (+5.4%)
⚠️ Resistance Zone - $4,235-$4,252 is strong barrier
⚠️ Data Clarity - If delayed data shows strength, could pressure gold
🔥 MARKET SENTIMENT: BULLISH WITH CAUTION
Analyst Consensus:
Short-term: Consolidation before next leg (Most likely)
Medium-term: Target $4,300-$4,400
Long-term: $4,700-$5,000 by 2026 (UBS/Goldman)
This Week:
Expected to test $4,252 resistance. Break above = Rally to $4,313+
End of November:
Analysts predict $4,230-$4,300 range
💡 PROFESSIONAL GAME PLAN
For DAY TRADERS:
⚡ Scalp the Range - Trade between $4,189-$4,235 with tight stops (20-30 pip targets)
Buy: $4,190-$4,200
Sell: $4,230-$4,235
Breakout: Above $4,252 → GO LONG aggressively
For SWING TRADERS:
📊 Wait for Clarity
Either breakout above $4,252 → Hold to $4,356
Or pullback to $4,157 → Buy for retest of $4,252
For LONG-TERM INVESTORS:
💎 Accumulate on Dips
Target: $4,150-$4,180 range
Goal: Hold for $4,500+ (2026 target)
Strategy: Dollar-cost averaging
📅 KEY EVENTS TO WATCH
THIS WEEK:
🎤 FOMC Speakers - Watch for rate cut signals
📊 Economic Data - Delayed reports may start releasing
🏛️ Government Funding - Impact on market sentiment
NEXT WEEK:
📈 November 21 - US Manufacturing & Services PMI
🎬 BOTTOM LINE (TL;DR)
Price: $4,189-$4,235 (Consolidating)
Bias: 🟢 BULLISH (Pullbacks are buying opportunities)
Key Level: $4,252 (Break this = Rally resumes)
Best Action: WAIT for breakout above $4,252 OR dip to $4,157
Risk Level: MEDIUM-HIGH (Volatility expected)
🔔 TODAY'S CRITICAL LEVELS
DO NOT CHASE between $4,220-$4,240!
BUY SIGNALS:
✅ Break above $4,252 with volume → GO LONG
✅ Dip to $4,157-$4,170 → BUY THE DIP
SELL SIGNAL:
❌ Break below $4,114 → Exit longs, potential reversal
NEUTRAL ZONE:
⚪ Between $4,189-$4,235 → Wait for direction
📊 TECHNICAL OUTLOOK
Trend: STRONGLY BULLISH ⬆️
Momentum: STRONG (but cooling) ⚡
Support: SOLID at $4,189-$4,200 🛡️
Resistance: TOUGH at $4,252 🚧
Pattern: Ascending channel with bullish flag forming
Next Move: Break $4,252 → Target $4,313-$4,382
⚠️ RISK MANAGEMENT RULES
✅ Position Size: Max 2% risk per trade
✅ Stop Loss: ALWAYS required - No exceptions!
✅ Take Profits: Lock 50% at TP1, trail rest
✅ Don't Chase: Wait for your setup patiently
✅ Respect $4,252: This is the make-or-break level
🎯 SWING TRADE SETUP (Multi-Day Hold)
Setup A - Breakout Play:
Entry: $4,254-$4,260 (after confirmed break)
Target 1: $4,313 (Hold 2-3 days)
Target 2: $4,356 (Hold 5-7 days)
Target 3: $4,382 (Hold 1-2 weeks)
Stop Loss: $4,210
Setup B - Pullback Play:
Entry: $4,150-$4,170 (if it dips)
Target 1: $4,243 (Hold 3-5 days)
Target 2: $4,313 (Hold 1 week)
Stop Loss: $4,120
🏆 PROFESSIONAL ANALYSIS SUMMARY
Gold has successfully rallied 5.4% this week and is now consolidating at the $4,200 psychological level. This is textbook healthy behavior after a strong rally.
The Setup:
Consolidation forms a bull flag pattern
Next move determines short-term direction
$4,252 is the line in the sand
Most Likely Scenario:
Brief consolidation (1-2 days) → Break above $4,252 → Rally to $4,313-$4,356
Alternative Scenario:
Healthy pullback to $4,157-$4,170 → Strong bounce → Retest $4,252
Either way, the TREND IS UP! 📈
💪 TRADING PSYCHOLOGY TIP
After a big rally, markets MUST consolidate. Don't panic if price pulls back slightly. Use dips as OPPORTUNITY, not fear. The trend is your friend - and this trend is BULLISH! 🚀
🎓 LESSON: THE BULL FLAG PATTERN
What we're seeing now is a BULL FLAG:
✅ Strong rally (flagpole) - Done
✅ Consolidation (flag) - Happening now
⏳ Breakout (continuation) - Coming soon!
Action: Wait for flag breakout above $4,252, then go LONG!
🔮 FORECAST
Today: Range between $4,180-$4,240
Tomorrow: Test of $4,252 or pullback to $4,157
This Week: Break $4,252 → Rally to $4,300+
End November: $4,280-$4,350 range
December: Potential retest of all-time high $4,382
⚠️ FINAL DISCLAIMER
This analysis is for educational and informational purposes only. Trading gold and forex involves substantial risk of loss. Never trade with money you cannot afford to lose. Always use proper risk management including stop losses. Past performance does not guarantee future results. Consult a financial advisor before making investment decisions.
📱 Like this analysis? Share it!
💬 Drop your trade setups in comments
🔔 Follow for daily 8:00 AM updates
👍 Hit that like button!
#Gold #XAUUSD #ForexTrading #TechnicalAnalysis #TradingView #GoldAnalysis #ForexSignals #DayTrading #SwingTrading #MarketAnalysis #BullFlag #TradingStrategy #GoldForecast

LTC is shaping a global bullish flagLTC is forming a global bull flag pattern, and the asset has remained in the accumulation phase since 2022. At a more local level, a butterfly pattern formed but did not complete its move to point D. Afterward, the price entered a local descending channel, which often forms part of a bull flag formation. It's highly likely that after breaking out of the local pattern, the movement will continue as a local ascending channel within the global structure.
If the global pattern's boundaries are broken, the highs formed since 2024 may be renewed.
A resistance zone (purple area) is also highlighted on the chart, where increased LTC buying activity is observed.
Dropping the price below 70 and holding it there doesn't make much sense, as the accumulation zone has formed above.
More detailed analysis, additional charts, and key levels to watch are available on our site

CHN ready to runCHN has demonstrated encouraging developments after emerging from a descending wedge pattern, bolstered by a bullish RSI divergence and the formation of a bull flag on the hourly chart. Furthermore, the daily chart reveals hidden bullish divergence, complemented by support from a trendline established in July and a .05 Fibonacci retracement level. A decisive move above $2 would serve as a strong indicator of a structural shift, potentially paving the way for a more substantial upward trend. Good luck and happy trading! 🍀

BITCOIN Weekly line charttells a story of 4 discernible patterns and 4 log targets.
1) The inverse head & shoulders to end the bear market
2) A broadening rising flag .... which at the time, many thought it was head and shoulder's top on the candle chart.
3) A small sideways flag
4) and the current frustrating broadening descending bull flag. Which has cause much grief to participants but will likely gives an explosive quick large moves.
As you can see putting the chart can help in identifying trends.. key highs and lows and also gives patterns that may not be visible on a candle chart.
Another tool in your toolbox.

BTI | Expect More Smokers in a Recession | LONGBritish American Tobacco plc is a holding company, which engages in the manufacture and distribution of tobacco products. Its brands include Kent, Dunhill, Lucky Strike, and Pall Mall. It operates through the following geographical segments: United States, Asia-Pacific and Middle East (APME), Americas and Sub-Saharan Africa (AMSSA), and Europe and North Africa (ENA). The APME geographical segment consists of markets in the Middle East merged with Asia-Pacific. The AMSSA geographical segment is composed of markets in East and Central Africa, West Africa, and Southern Africa merged with the Americas region. The ENA geographical segment includes markets in Russia, Ukraine, Caucasus, Central Asia, Belarus, Turkey, and North Africa merged with the Western Europe region. The company was founded by James Buchanan Duke on September 29, 1902 and is headquartered in London, the United Kingdom.

$GLW Bull FlagA high quality company within a strong uptrend. Consolidating in a bull flag as volume drops off. Earnings in one week time could be the catalyst which finally pushes this past $100 and beyond.

EBAY | This Retail Business Will BOOM | LONGeBay, Inc. is a commerce company, whose platforms include an online marketplace and its localized counterparts, including off-platform businesses in South Korea, Japan, and Turkey, as well as eBay's suite of mobile apps. It offers a platform for various product categories, including parts and accessories, collectibles, fashion, electronics, and home & garden. eBay generates revenue mainly through fees from sales, payment processing, and advertising. The company was founded by Pierre Morad Omidyar in September 1995 and is headquartered in San Jose, CA.

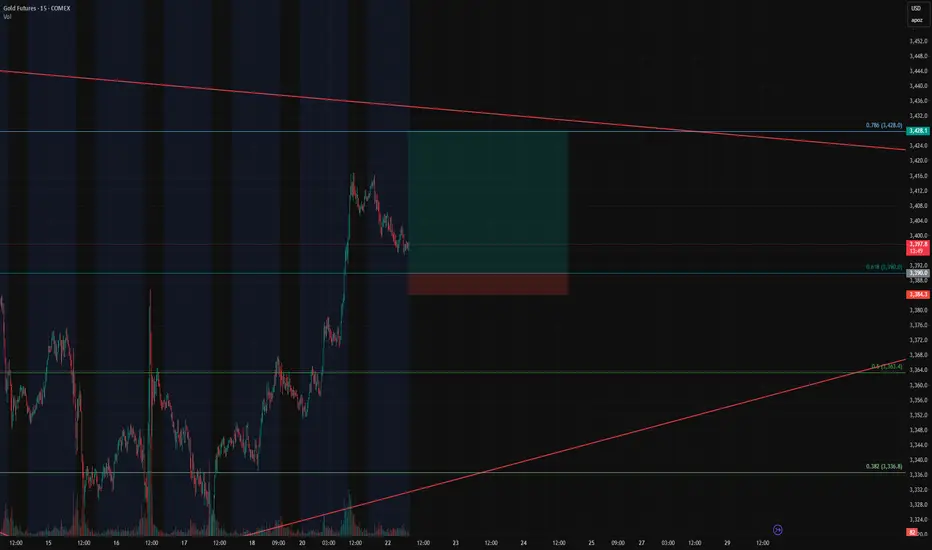
Gold Futures Long Setup – Breakout Continuation off the 0.618 FiGold Futures Long Setup – Breakout Continuation off the 0.618 Fib
Instrument: Gold Futures – COMEX ( COMEX:GC1! )
Timeframe: 15-Minute
Trade Type: Long – Breakout Continuation
Entry Zone: 3390 (0.618 Fibonacci retracement)
Take Profit: 3428 (0.786 Fib)
Stop Loss: 3384
Risk/Reward Ratio: 6.68
Setup: Bullish Flag on Retest
🔍 Trade Thesis
This trade is part of an ongoing breakout continuation strategy we've been trading, and now we're eyeing a pullback entry as price returns to a key retracement level.
Price nearly exploded through the 0.618 Fibonacci level (3390) during the prior breakout.
Now it's pulling back in a textbook bullish flag formation, suggesting healthy consolidation before the next leg.
The 0.618 retracement is aligning with previous intraday structure and trendline support — making this an ideal level to scale in.
This is a high R:R continuation play, with targets set at the 0.786 Fib level (3428) — right before macro resistance kicks in.
🎯 Entry & Exit Strategy
Entry: As price touches 3390 or forms bullish confirmation at the level.
Stop Loss: 3384 – tight and below key fib/flag structure.
Target: 3428 – based on 0.786 Fib extension and breakout continuation projection.
📊 Why This Works
Breakout behavior: Price respected the breakout impulse and retraced cleanly into a bull flag.
Fib confluence: 0.618 pullbacks are a classic entry in trending markets.
R/R of 6.68: Excellent reward profile vs. limited risk.
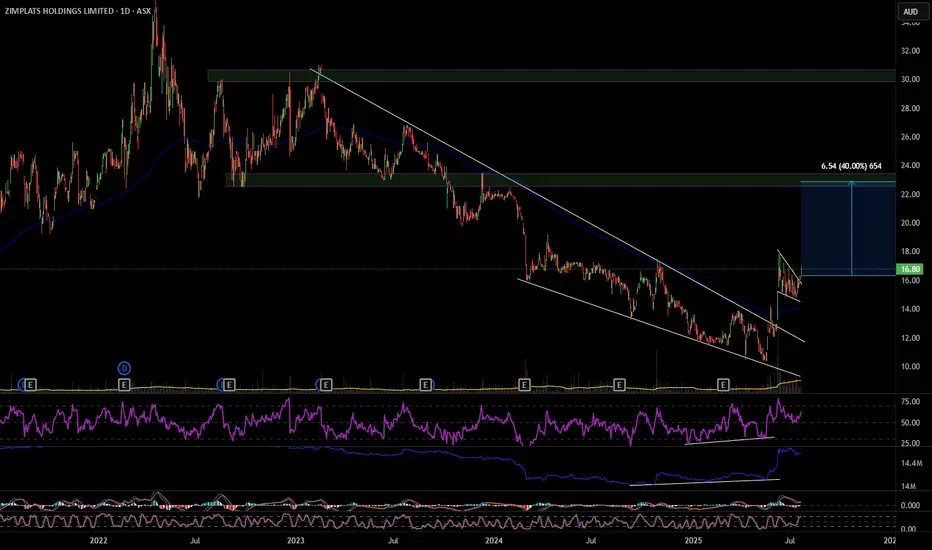
ZIM 40% move up
ZIM has broken out of a descending wedge with bullish RSI and OBV divergence, also multiple divergences on smaller time frames. On the hourly it's had a pull back and formed a bull flag that it has also broken out of. ZIM looks to have formed a change of structure forming higher highs and higher lows, my first target will be $22.90 a move of 40%. Definitely one to consider. Good luck and happy trading 🍀
Double Bull Flags on an Ascending Triangle breakout on the dailyDaily, double Bull Flag, on top of an Ascending Triangle Breakout. Golden Pocket on the Fib Ext is $588 🥂

Bitcoin: Promising Patterns and Potential BreakoutBitcoin's recent price action has been nothing short of captivating for traders and analysts alike. On the daily chart, we've observed the formation of an Inverse Head & Shoulders and a Cup & Handle pattern, both of which have now transitioned into a Bull Flag. These bullish signals suggest a strong potential for upward movement.
Zooming into the 4-hour and 1-hour charts, we can see prominent Ascending Triangles taking shape. These patterns are often harbingers of significant breakouts, and it appears that Bitcoin is winding up for a substantial move.
Moreover, when utilizing a Trend-based Fibonacci Extension on the daily timeframe, the golden pocket points to a target of $126k, with the next pocket at $185k. This aligns with historical data and technical indicators, suggesting that Bitcoin might be poised to rewrite history once again.
Stay tuned as we monitor these developments and anticipate what could be a historic breakout for Bitcoin!

Nasdaq: Bull flag breakout on daily chart, testing ATHsBeen a while since I last posted. So figured I'd share this quick chart. Market undoubtedly have been incredibly volatile this month. However luckily, the Nasdaq has been forming bull flag on the daily chart. This follows a strong prior uptrend. The breakout took place today, sending the index to test ATHs.
Notable stocks making a move are names like NASDAQ:AMZN and NASDAQ:NVDA , mainly due to the broader market strength. Other indices, such as the S&P 500 ( SP:SPX ) also are breaking out as they form a similar bull flag pattern.
At ATHs, this is a deciding factor of where the market goes next. Either it bounces off to near-term support, or the market rallies to a new all-time high until next cooldown.
Note: not financial advice

XAUUSD Is XAUUSD getting ready for new ATHs? Gold has formed a clear bullish flag pattern and retested it clearly. One Thing I am looking for the retest of 50 DEMA . If the Price holds above the 50 DEMA, there are much chances that gold may target the new ATHs very soon.
What you guys think about it?

Monster Breakout brewing for ASTS🔍 NASDAQ:ASTS Weekly Chart Analysis (Accurate)
Pattern: Massive bull flag / consolidation wedge after a parabolic run.
Current Price: ~$31.20, sitting near the midpoint of the descending channel.
Structure:
Price is compressing between lower highs and higher lows.
Volume spikes on up moves, low volume on pullbacks = bullish accumulation.
Testing upper trendline of the flag — breakout could trigger a new wave.
✅ Favorable Path:
Break and weekly close above ~$34.00 (channel resistance) confirms breakout. That opens up a measured move targeting $50–55 short-term, and possibly $70+ if momentum accelerates.
🎯 Measured Move Target:
Pole base ~$6 → Flag peak ~$36 = ~$30 range
Breakout above $34 → Target = $34 + 30 = $64
⚠️ Invalidation:
A breakdown below $24–25 zone would invalidate the flag and suggest distribution instead of continuation.
🔑 Summary:
Setup: Weekly bull flag after a parabolic leg
Bias: Strongly bullish with breakout potential
Trigger: Weekly close above $34.00
Short-term target: $50–55
Full measured move target: ~$64
Invalidation zone: Below $24
Smart money appears to be loading the dips. Breakout traders should watch $34 like a hawk.
