Bullflags

Another bull flag or a massive bull trap for a down trend
It appears we might be having a big run up if BTC price follows through upwards over the 9500 (red line) area towards 9800 - 9920, thereby creating what appears to be a bull flag.
Another range trading will then be within the flag before it shoots up but if goes down below the 9200 without hitting the 9800 area, I would assume that move invalidates creating a bull flag and prepare for a downtrend.
This is not a Trading advice. Just following the price action and putting down my opinion of things.

TNY Update. Possible Bull Flag.Unless Tinley breaks above 47c in the next few trading sessions we're basically just looking at another lower high.
There's clearly a possible bull flag pattern that may play out.
The RSI was at an all time low on "all time frames" recently, which is reflective of the aggressive bounce we had in the share price.
On the RSI I've made some notes that may indicate a trend reversal.
On a five day chart I'll post attached to this chart you can notice the RSI bounce off the top of what was once a descending triangle, this may indicate the trend is changing due to old resistance becoming new support.
Time will tell per usual.

COCOS/USDT IDEAHello traders !
This is my view on the COCOS / USDT pairing. Cocos has had a nice run the last couple of days, and in my opinion looks like we have a little higher to go. The ADX and DI show the bulls are still in control. Unfortunately the momentum seems to be dissipating, (the white line) but as far as lagging indicators go, this could correct itself in time, if more buyers enter the space.
Appears we are in a textbook bull flag looking for another leg up. Finding support on the 50 RSI level supports this as well.
Time will tell ! Thanks for viewing
Happy trades everyone !
For those curious about this crypto;
The platform for the next generation of digital game economy
Cocos-BCX' , fully named 'Cocos BlockChain Expedition', aims to create an integrated multi-platform runtime environment for games, providing developers with the convenience and completeness in game development, while bringing users a whole new gaming experience, unprecedented gaming status, and with all the assets obtained in the games being wholly owned by the users.

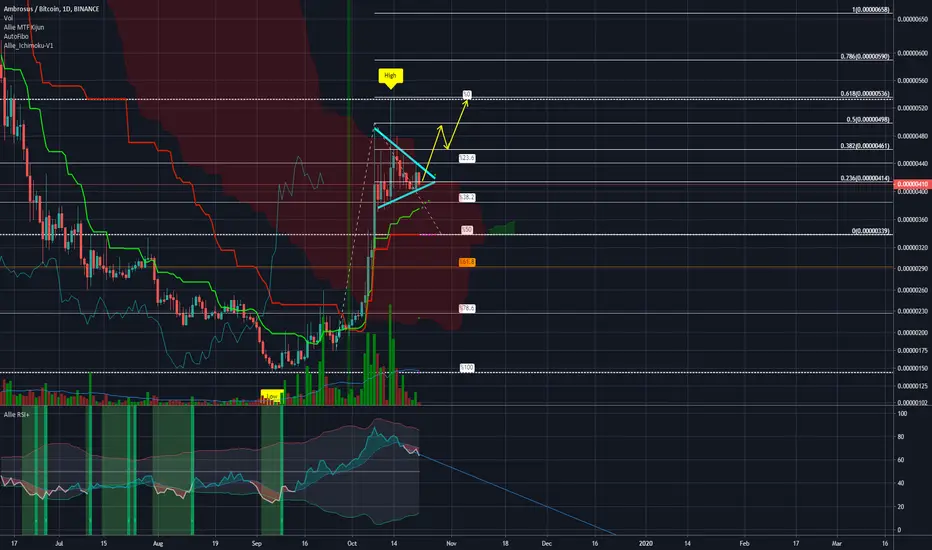
AMB/BTC - KUMO Breakout Trade SetupI have been watching AMB for quite some time as we are seeing multiple Kumo breakouts from the alts lately.
AMB is looking prime for a kumo breakout just needs a jolt like RLC had today.
I am looking for it to break out to the 50% extension a retracement to the 0.382 and then for it to get to our golden 0.618.
This is a mid term trade and I have set my alerts ready to enter as it will likely be the next mover as it is setup beautifully on the faily and the Tenkan is hooked into the sky.
Enter - when we break out of the kumo or on the kumo retest.
Targets
1. 461
2. 498
3. 536
Stop loss: 390
Twitter: @coachkcrypto
Trade, Educate, Learn, Repeat!
Coach K
BTC Bull flag to $8600?Seems like BTCUSD chart might be playing out a classic bull flag pattern.
If this plays out nicely, we are looking at a continuation of the uptrend to around the $8600 level.


My gameplay.We are completing A Bull Flag.
Green Line is my
ENTRY = $8200
Yellow lines Take Profits.
#1 $8350
#2 $8450
#3 $8500
#4 $8550

Bitcoin Long Term TrendGood evening ladies and gents. I have spotted Weekly Hidden Bullish Divergence on the MacD as well as RSI Bullish Convergence. These are both starting to round out. I am aware that many people are looking for a measured move down to around the 6800-7400 area, but that may not happen. Still could of course, but looking at the larger time frames, it's looking less likely ;) . I'd also like to mention the alt coins and where they are at. A lot of these alt coins are at the bottom of their overall bull trend showing Hidden bullish divergence, regular Bullish Divergence and Bullish Convergence. Too many coincidences for this to be just another random idea. These are actual technicals that I am displaying. This chart is on the log scale by the way! We have been in a down sloping channel for the last few months now after a large rally from our 3k bottom. We have only retraced 38.2% of the way. We are in common retrace areas after an impulse. So Price reversal from where we are at is most certainly possible! This is the .382 on the log scale! On the Linear scale, you have retraced over 50% of the way and nearly hit the .618 which is at $7200. In my chart, I have depicted two measured moves. This is a potential bull pole, bull flag pattern. In that case, the measured move takes is perfectly on the Log Scale at the 1.414 Fib extension around $42k. That is right, I fucking said 42k. Just an idea for now of course. This isn't certainty. The Gaussian Channel Tool is also teal on the Weekly time frame. Currently testing the top of it ;)
I wish everyone a wonderful rest of your day and night!
Twitter: twitter.com
If you want to be a loving supporter of me and my "ChArtworks"
$BTC: 35tmT7MAQXZm7rr1KzZMWNRpN2iyrnSB4z
$LTC: LVfCT9fu4dYyFAo5cW5xLrzHZHWFoG85hn
$ETH: 0x390d207b9bde62f2806caddfb94809de61da50d9
$x42: XZXm43FJcZHEVNs9dh8mdfzWyY6VfmJvPc
Donations are never required but they are seriously very appreciative! Your Supportive comments and follows are just good enough too :D <3
Join the best Crypto and Technical Analysis Community in the world!
Discord: discord.gg
(Mitch Ray's Channel) Amazing community and I highly recommend checking out Mitch Ray if you haven't yet!


BTC (Prj.Y19.P5.E4).Short.OpportunityAs per chart details.
Target, height of pole to bull flag. 9K
Major resistance at channel border 8750
1 HRLY chart up close.


BTC UPDATE: 10.10.19: 2ND BULL FLAG!Hello all!
Please reference my last post on BTC if you have not already done so!
The flag formation seems to be holding up thus far. We will most likely see this consolidation play out until the end of the daily close before seeing a spike to the upside.
Remember we are not trying to predict the future! Only anticipate it!
The 1H chart is possibly showing us a hidden bullish divergence in the form of increased negative momentum on the MACD with a higher low in the price. Much caution should be had upon approaching the $9,000 range as a higher high in price will most likely show as a lower high in the RSI and MACD at this point. A heavy rejection is likely to take place during such an event. Support at the $8,000 range will be tested if this flag fails to perform as expected.
Let me know what you think!
This is only my opinion and not to be taken as financial advice.
1D chart

BITCOIN bull flag15min lft
looking for something like this and major breakout to upper targeting 9500 as pivotal and 10k ++ full tp closed


Can Bitcoin jump over this 200 Day MA?Bitcoin appears to be trading in a Ascending Triangle. It also looks like a giant W or what I call a Wu Tang pattern may play out, resulting in a gap to the upside.
On a smaller time frame there's clearly a bull flag or descending triangle. I don't see any resistance until 8709ish & 8860ish USD.


Another Descending Triangle for Ethereum.Or maybe a bear flag / bull flag.
Keep in mind that looking for bull patterns in a short term bearish trend with the backing of the federal reserve is not an easy task.
Also, in one of my previous posts I spoke about the CME futures that have launched on Ethereum that are similar to the ones launched in late 2017 for Bitcoin, and we all seen what happened there.
Time will tell per usual

XAUUSD - What's next for GOLD ?- The Head & Shoulder pattern was invalidated due to selloff on US markets and pushed GOLD prices higher
- In my previous analysis, I did mentioned that GOLD is still bullish on long term although it had invalidated the H&S pattern
- Lets see whether GOLD can break the 1520 area or follow the trend channel and retrace to around 1440
Scenario A: Bullish Flag pattern if manage to breakout from the trend channel
Scenario B: Follow the trend channel if it retrace when it reach 1520 zone
Have some patience and wait for it to tell you the direction

Bull Flag - Head & Shoulder Formation Hello Traders,
We are currently watching this pair for a potential bull flag , and a break higher towards the shoulder line.
Major resistance found at 1.6420. We will look to enter a sell position from the shoulder line with a long term target of 1.5900.
The RBA will cut interest rates tomorrow therefore expect volatility on all AUD pairs.
Short term we are expecting further upside, however long term we may see the pair break lower than the neck line of the head and shoulders pattern.
Please let us know your thoughts on the set up,
www.forexstoreau.com
