USDJPY – From Shorts to Longs!USDJPY has been trading within a rising channel, maintaining an overall bullish structure in the medium term.
🔍 Current Setup:
We previously looked for shorts from the weekly resistance near the upper bound of the channel — and price reacted as anticipated.
Now, we are waiting for a retest of the lower bound, which is the intersection of the lower trendline and the daily support area, to look for trend-following longs in line with the prevailing bullish trend.
📌 Plan:
Shorts have already played out from the upper bound.
Next, watch for bullish reversal signals around the lower trendline + support confluence for potential long entries.
🎯 Patience is key — let price come to you before taking action.
📚 Always follow your trading plan regarding entry, risk management, and trade management.
Good luck!
All Strategies Are Good; If Managed Properly!
~Richard Nasr
Disclosure: I am part of Trade Nation's Influencer program and receive a monthly fee for using their TradingView charts in my analysis.
Bullish Patterns

XRP - Wait for It!Hello TradingView Family / Fellow Traders. This is Richard, also known as theSignalyst.
📈XRP has been overall bullish trading within the rising wedge pattern marked in blue, and it is currently retesting the lower bound of the wedge.
Moreover, it is retesting a strong demand zone marked in orange.
🏹 The highlighted blue circle is a strong area to look for buy setups as it is the intersection of the orange demand zone and lower blue trendline acting as a non-horizontal support.
📚 As per my trading style:
As #XRP retests the blue circle zone, I will be looking for bullish reversal setups (like a double bottom pattern, trendline break , and so on...)
📚 Always follow your trading plan regarding entry, risk management, and trade management.
Good luck!
All Strategies Are Good; If Managed Properly!
~Richard Nasr

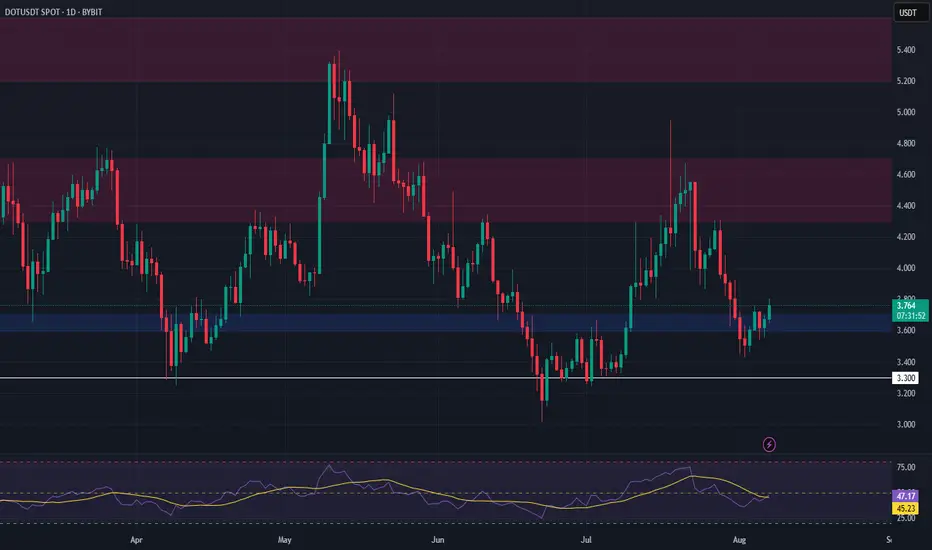
DOT | Bounce Setup from Major Support ZonePolkadot (DOT) has dropped sharply in recent weeks and is now testing a significant support zone between $3.60 – $3.70. This level has historically provided strong demand, making it a potential launch point for a bounce toward higher resistance levels.
Trade Setup:
🔹 Entry Zone: $3.60 – $3.70
🔹 Take Profit Zones:
• TP1: $4.30 – $4.70
• TP2: $5.20 – $5.60
🔹 Stop Loss: Below $3.30
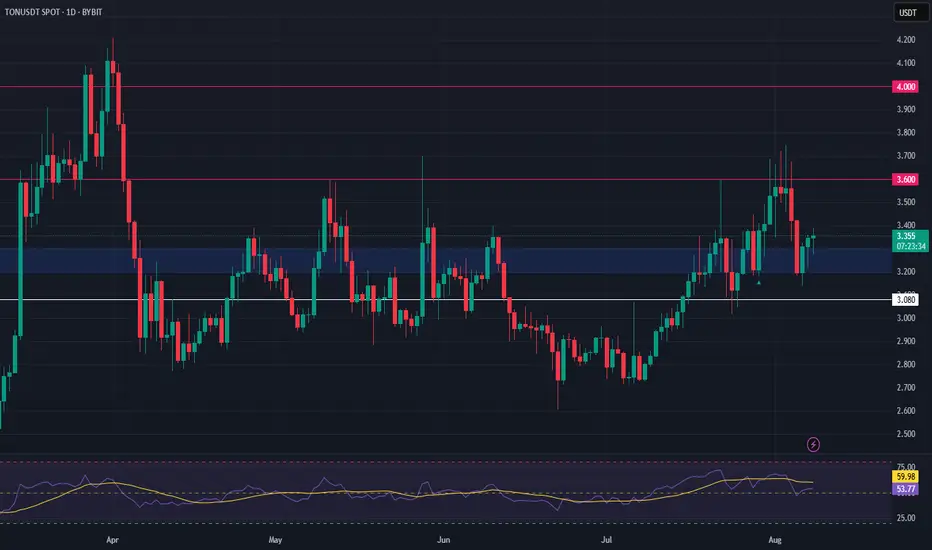
TON Setup – Pullback to Support After 15% SurgeToncoin (TON) has climbed over 15% since our last trade. Price is now pulling back into a key support zone, potentially forming a base for the next upward leg.
📌 Trade Setup:
• Entry Zone: $3.20 – $3.30
• Take Profit Targets:
o 🥇 $3.60
o 🥈 $4.00
• Stop Loss: $3.08
GBPUSD Potential UpsidesHey Traders, in today's trading session we are monitoring GBPUSD for a buying opportunity around 1.33900 zone, GBPUSD is trading in an uptrend and currently is in a correction phase in which it is approaching the trend at 1.33900 support and resistance area.
Trade safe, Joe.

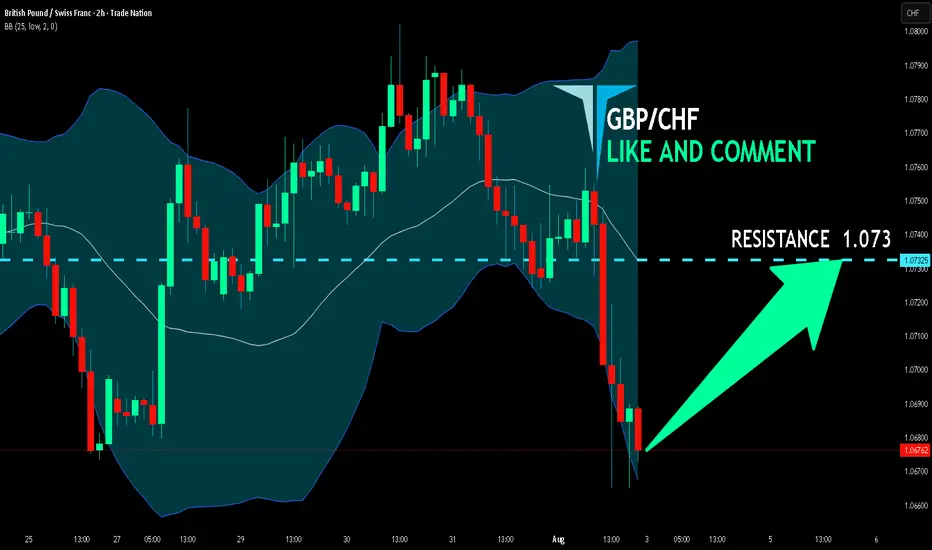
GBP/CHF BEST PLACE TO BUY FROM|LONG
Hello, Friends!
GBP/CHF pair is in the uptrend because previous week’s candle is green, while the price is clearly falling on the 2H timeframe. And after the retest of the support line below I believe we will see a move up towards the target above at 1.073 because the pair is oversold due to its proximity to the lower BB band and a bullish correction is likely.
Disclosure: I am part of Trade Nation's Influencer program and receive a monthly fee for using their TradingView charts in my analysis.
✅LIKE AND COMMENT MY IDEAS✅
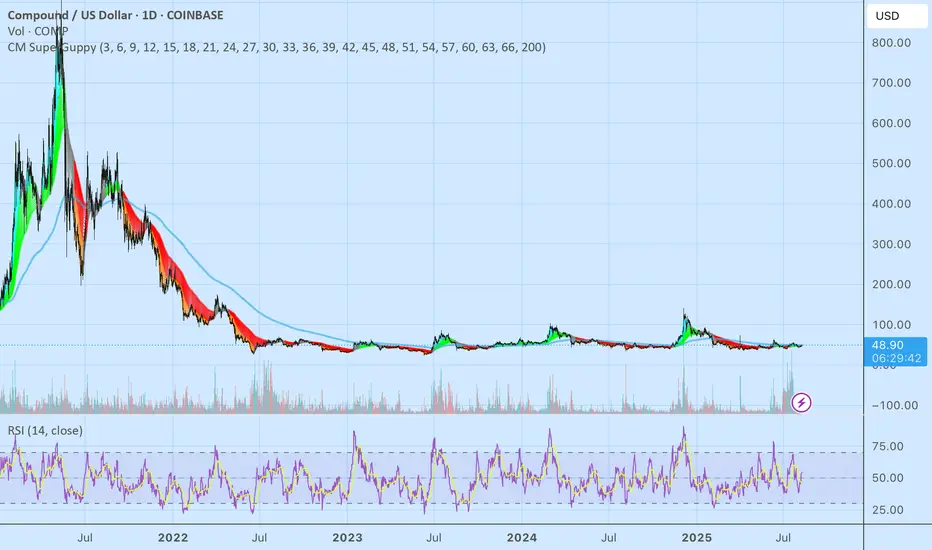
NC HAMMER CRYPTO visuals on other platforms?This is COMPOUND(COMP), comp is like….. Sofia Vergara. Gorgeous as hell but only dates people who make more money then her. Here we are at compounds almost absolute bottom. Removing all my TA and just posting the chart with CM Guppy and RSI, no Ta really needs to be done. We’ve seen compound go from $85 to nearly $1000. And it’s been a couple years we are at the absolute best buying point for this coin. Nothing but up from here.
If you draw a downward trendline from its previous highs, we have broken that line and are buying support and pressure.
Volume is getting pretty ridiculous as well
Sofia here we come.
Good luck and have fun with it
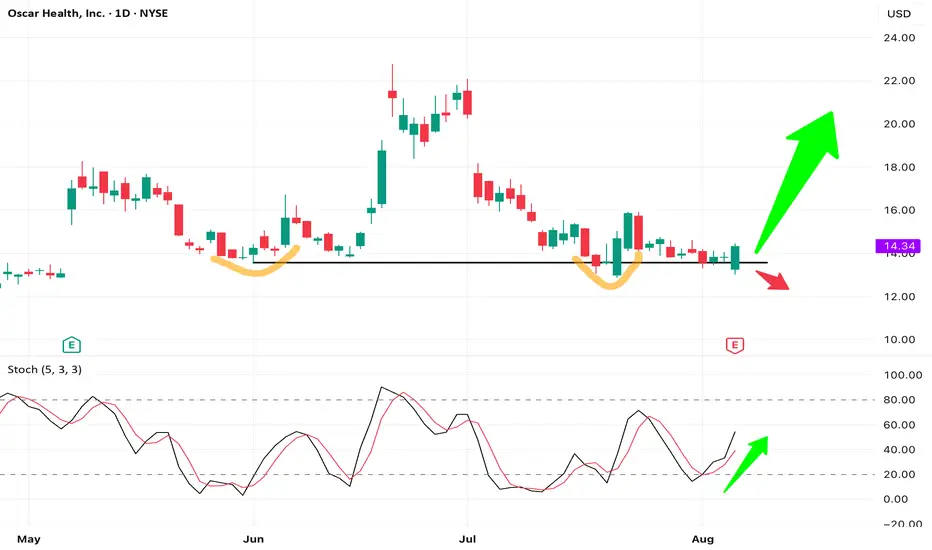
OSCR forming a Double Bottom – Bullish Reversal PotentialNYSE: OSCR - Oscar Health shows a potential double bottom, with a force bottom likely clearing stop-losses. Price has reclaimed key support, and stochastic is turning up, suggesting early bullish momentum.
Despite earnings missing estimates, the stock closed strong above support — a positive reaction to bad news. Risk and reward looks favorable at current levels.
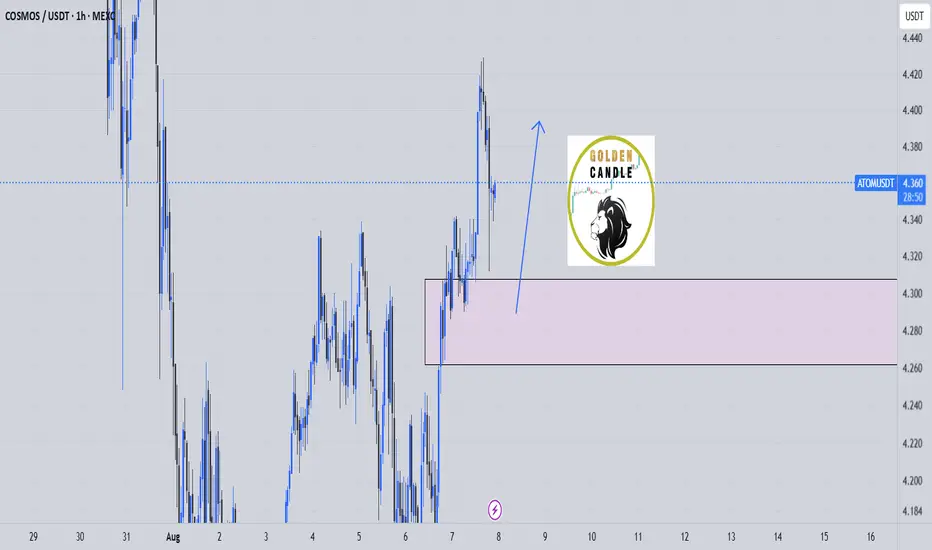
buy midterm atom "🌟 Welcome to Golden Candle! 🌟
We're a team of 📈 passionate traders 📉 who love sharing our 🔍 technical analysis insights 🔎 with the TradingView community. 🌎
Our goal is to provide 💡 valuable perspectives 💡 on market trends and patterns, but 🚫 please note that our analyses are not intended as buy or sell recommendations. 🚫
Instead, they reflect our own 💭 personal attitudes and thoughts. 💭
Follow along and 📚 learn 📚 from our analyses! 📊💡"
RENDER Approaching Key Support – Swing Trade OpportunityRENDER is currently retracing and approaching a significant support zone, offering a potential long swing trade setup. This level has historically acted as a demand area, and price action around it could provide a favorable risk-to-reward entry.
💰 Entry Zone: $3.280 – $3.030
🎯 Targets:
• TP1: $4.00
• TP2: $4.500
🛑 Stop Loss: $2.950
Trade management will be key – look for bullish reversal signals like strong volume, bullish engulfing patterns, or RSI confirmation before entry. Maintain disciplined risk control with your stop loss below the key zone.
#RENDER #CryptoTrading #SwingTrade #Altcoins #TechnicalAnalysis #CryptoSetup #Bullish #SupportZone #CryptoSignals #RENDERUSDT #RiskReward #CryptoMarket

Novo Nordisk NVO It's the time to BUYNovo Nordisk NYSE:NVO For me it is the time to start buying at the current price zone and even buy more if it went lower than this price zone.
My mid-term target is as shown on the chart at 81$

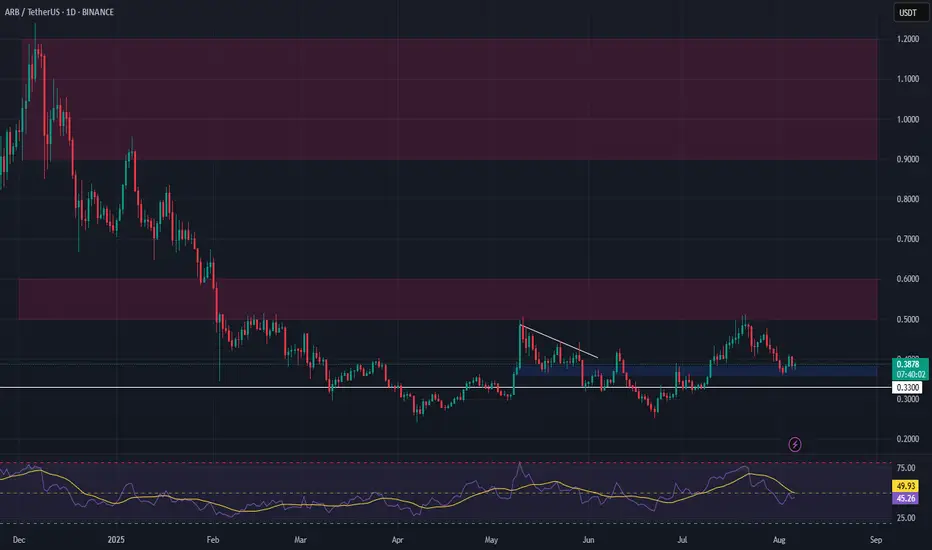
ARB Setup – Watching Key Support for Long EntryArbitrum (ARB) has pulled back into a critical support zone after recent declines. This level is showing strong buyer interest, and we’re eyeing a potential spot long entry as price consolidates near the lows.
📌 Trade Setup:
• Entry Zone: $0.386 – $0.38
• Take Profit Targets:
o 🥇 $0.50 – $0.60
o 🥈 $0.95 – $1.20
• Stop Loss: Just below $0.33
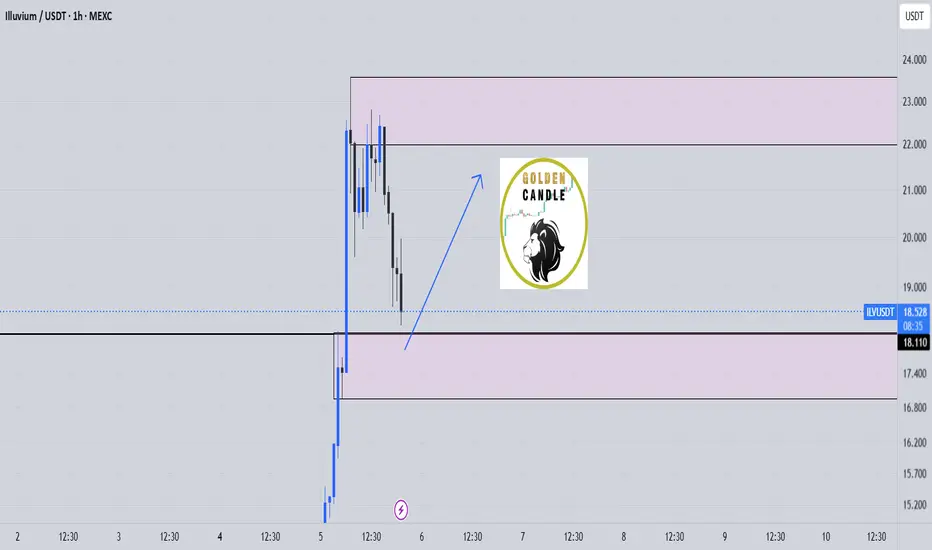
ilv buy midterm"🌟 Welcome to Golden Candle! 🌟
We're a team of 📈 passionate traders 📉 who love sharing our 🔍 technical analysis insights 🔎 with the TradingView community. 🌎
Our goal is to provide 💡 valuable perspectives 💡 on market trends and patterns, but 🚫 please note that our analyses are not intended as buy or sell recommendations. 🚫
Instead, they reflect our own 💭 personal attitudes and thoughts. 💭
Follow along and 📚 learn 📚 from our analyses! 📊💡"
Hedera (HBAR) – Pullback Opportunity After 100% RallyHBAR has surged 100% recently. With the broader market entering contraction, we’re now watching for a healthy retracement into key support, aligning with the 50% Fibonacci level and a fair value gap (FVG). This could be the formation of a higher low before continuation.
🔍 Setup Overview:
Entry Zone: $0.22 – $0.19
Take Profits: $0.26 / $0.32 / $0.37
Stop Loss: Daily close below $0.18
Bias: Bullish continuation from support
🧠 Trade Idea:
Price is approaching a confluence zone of Fib support and unfilled imbalance. As long as daily structure holds above $0.18, the bullish case remains intact. This zone offers an attractive long setup for the next move higher, targeting previous resistance levels.
⚠️ Invalidation:
A daily close under $0.18 would break structure and invalidate the setup. Monitor price action and volume confirmation around this support zone for entry timing.

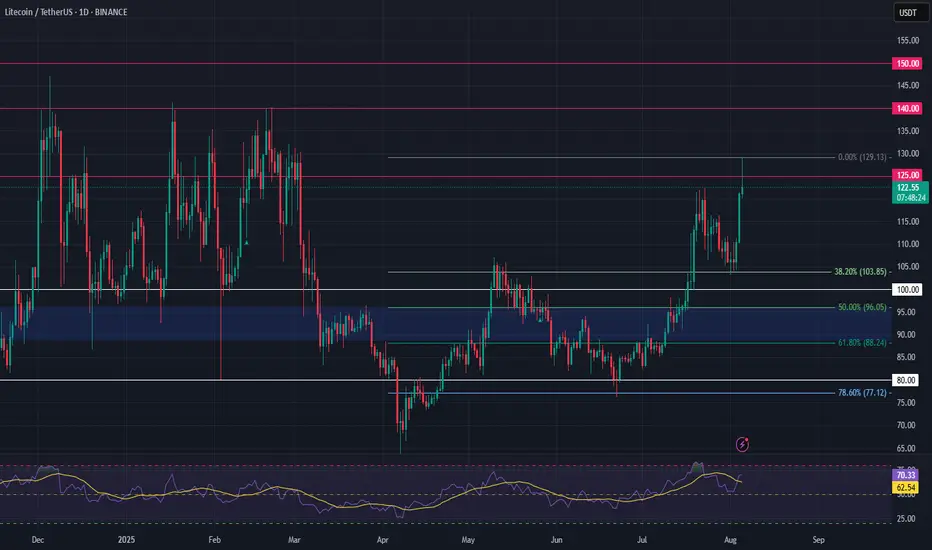
Litecoin (LTC) – Re-Entry After 44% RallyLTC rallied over 44% since our last trade setup. Now, we’re looking for a re-entry opportunity as the broader crypto market shows signs of a potential pullback.
🔍 Setup Overview:
Entry Zone: $108 – $103
Take Profits: $125 / $140 / $150
Stop Loss: Daily close below $100
Bias: Bullish continuation (as long as structure holds)
🧠 Trade Idea:
Expecting a possible sweep of the $104 low before upside resumes. Key condition: Daily candle must not close below $100—wicks are fine. If price respects this level, the bullish structure remains intact.
This is a classic liquidity grab scenario. Entering in the $108–103 zone allows favorable risk-to-reward if LTC catches support and reclaims momentum.
⚠️ Invalidation:
If LTC posts a daily close below $100, trade setup becomes invalid. Monitor price action closely around this key support zone.
Sitting Right on the 200-Day EMATSLA is sitting right on the 200-Day EMA here while holding this wedge for quite some time. TSLA's Bollinger Bands are starting to squeeze, indicating a significant move is forthcoming, and moving averages (MA 5/10/30/60) are flattening, indicating a loss of bullish momentum. It will be interesting to watch from here.

USOIL BULLISH BIAS RIGHT NOW| LONG
USOIL SIGNAL
Trade Direction: long
Entry Level: 66.22
Target Level: 69.94
Stop Loss: 63.73
RISK PROFILE
Risk level: medium
Suggested risk: 1%
Timeframe: 9h
Disclosure: I am part of Trade Nation's Influencer program and receive a monthly fee for using their TradingView charts in my analysis.
✅LIKE AND COMMENT MY IDEAS✅

NZD/JPY BEST PLACE TO BUY FROM|LONG
NZD/JPY SIGNAL
Trade Direction: long
Entry Level: 86.809
Target Level: 88.001
Stop Loss: 86.010
RISK PROFILE
Risk level: medium
Suggested risk: 1%
Timeframe: 8h
Disclosure: I am part of Trade Nation's Influencer program and receive a monthly fee for using their TradingView charts in my analysis.
✅LIKE AND COMMENT MY IDEAS✅

CAD/JPY BULLS ARE STRONG HERE|LONG
Hello, Friends!
We are now examining the CAD/JPY pair and we can see that the pair is going down locally while also being in a downtrend on the 1W TF. But there is also a powerful signal from the BB lower band being nearby indicating that the pair is oversold so we can go long from the support line below and a target at 108.573 level.
Disclosure: I am part of Trade Nation's Influencer program and receive a monthly fee for using their TradingView charts in my analysis.
✅LIKE AND COMMENT MY IDEAS✅

AUD/JPY LONG FROM SUPPORT
Hello, Friends!
The BB lower band is nearby so AUD-JPY is in the oversold territory. Thus, despite the downtrend on the 1W timeframe I think that we will see a bullish reaction from the support line below and a move up towards the target at around 96.130.
Disclosure: I am part of Trade Nation's Influencer program and receive a monthly fee for using their TradingView charts in my analysis.
✅LIKE AND COMMENT MY IDEAS✅

Which altcoin hits the $50 club first? $INJ or $DOT? Which altcoin hits the $50 club first? CRYPTOCAP:INJ or CRYPTOCAP:DOT ? 🚀
3W HTF Technical Breakdown:
1⃣ CRYPTOCAP:INJ (@injective )
✔ Reclaimed structure above $13.31
✔ Targeting $31 → $52.98
✔ Clean 385% R:R setup
⚠ Invalidation below $8.79
2⃣ CRYPTOCAP:DOT (@Polkadot )
✔ Bounced from multi-year TL + demand zone
✔ Hold above $3: Targets $16.67 → $24.37 → $55
✔ Monster 1,660% setup loading
Both charts are screaming high-conviction breakout.
The $50 race is on…
NFA & DYOR

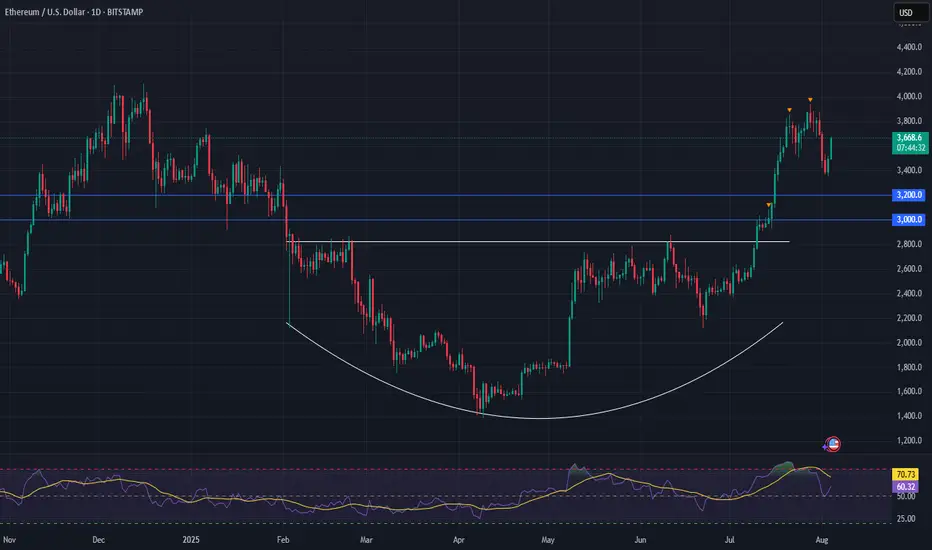
Ethereum (ETH) is setting up for a powerful moveFollowing a strong breakout, ETH has entered a healthy consolidation phase—setting the stage for its next leg higher.
Momentum remains firmly on the bulls’ side, with the breakout from a long-term saucer pattern fueling continued upside pressure.
📈 Technical Highlights:
✅ Short-term target: $4,000+ (breakout continuation)
✅ Long-term potential: $7,000+
🛡️ Key support: $3,000–$3,200 (bullish as long as this holds)
📣 Takeaway:
Ethereum is showing classic bullish structure. With higher-lows forming and strong support below, pullbacks are likely to offer high-probability entries for both traders and long-term holders.
#Ethereum #ETHUSD #Crypto #Trading #TechnicalAnalysis #CryptoTrading #EthereumPrice #Altcoins #Bullish #Breakout
GBP/JPY BULLS ARE GAINING STRENGTH|LONG
Hello, Friends!
Previous week’s red candle means that for us the GBP/JPY pair is in the downtrend. And the current movement leg was also down but the support line will be hit soon and lower BB band proximity will signal an oversold condition so we will go for a counter-trend long trade with the target being at 197.696.
Disclosure: I am part of Trade Nation's Influencer program and receive a monthly fee for using their TradingView charts in my analysis.
✅LIKE AND COMMENT MY IDEAS✅

EUR/GBP BULLS ARE STRONG HERE|LONG
EUR/GBP SIGNAL
Trade Direction: long
Entry Level: 0.863
Target Level: 0.872
Stop Loss: 0.857
RISK PROFILE
Risk level: medium
Suggested risk: 1%
Timeframe: 9h
Disclosure: I am part of Trade Nation's Influencer program and receive a monthly fee for using their TradingView charts in my analysis.
✅LIKE AND COMMENT MY IDEAS✅
