BULL | Unbelievable Move Incoming | LONGWebull Corp. engages in the provision of financial services. It offers trading, wealth management product distribution, market data and information, user community, and investor education. The company was founded by An Quan Wang in 2016 and is headquartered in St. Petersburg, FL.
Bullish Patterns

EURGBP Eyes 0.86700 Support for Potential BounceHey Traders, in tomorrow's trading session we are monitoring EURGBP for a buying opportunity around the 0.86700 zone. EURGBP is trading in an uptrend, with price currently correcting toward this key support/resistance level.
Structure: The broader trend remains bullish, with the current pullback potentially offering fresh entry opportunities.
Key level in focus: 0.86700 — a significant support zone where buyers may look to rejoin the trend.
Fundamentals: Ongoing EUR resilience against GBP could help support a continuation higher if this level holds.
Trade safe,
Joe.

BULL 4H - Bulls are back in town?On the 4H chart, the setup looks solid: a falling wedge breakout with both MA50 and MA200 left below the price. Buyers stepped in with volume, confirming interest in the move. The first target sits around $18.35, and if momentum continues, the next checkpoints are $22 and $27.6.
From a fundamental angle, Webull keeps expanding its client base and strengthening its position in the competitive brokerage market. With retail trading demand still alive, recovery scenarios for the stock look plausible.
The tactical play is simple: as long as the price stays above the moving averages, bulls are in control. Still, watch for pullbacks - markets love to test support after breakouts.
And yes, the ticker “BULL” practically screams the trend. Just make sure you don’t treat it like a real bull - those don’t care about targets.

USDJPY: 150 INTERVENTION ZONE BATTLE! BoJ vs Bulls 🚀 USDJPY: 150 INTERVENTION ZONE BATTLE! BoJ vs Bulls 📊
Current Price: 149.521 | Date: Sept 27, 2025 ⏰
📈 INTRADAY TRADING SETUPS (Next 5 Days)
🎯 BULLISH SCENARIO
Entry Zone: 149.20 - 149.60 📍
Stop Loss: 148.80 🛑
Target 1: 150.20 🎯
Target 2: 150.80 🚀
🎯 BEARISH SCENARIO
Entry Zone: 149.80 - 150.20 📍
Stop Loss: 150.50 🛑
Target 1: 148.50 🎯
Target 2: 147.80 📉
🔍 TECHNICAL ANALYSIS BREAKDOWN
📊 KEY INDICATORS STATUS:
RSI (14): 68.7 ⚡ Overbought Territory
Bollinger Bands: Upper Band Rejection 🔥
VWAP: 149.30 - Critical Support 💪
EMA 20: 148.90 ✅ Bullish Trend Intact
Volume: Intervention Fears Rising 📊
🌊 WAVE ANALYSIS:
Elliott Wave: Wave 5 Extension Risk 🌊
Fibonacci Target: 150.50 Danger Zone 🎯
🔄 HARMONIC PATTERNS:
Bearish Bat Forming at 150.00 ✨
ABCD Completion Warning 🔄
⚖️ SWING TRADING OUTLOOK (1-4 Weeks)
🚀 BULLISH TARGETS:
Intervention Zone: 150.00-150.50 🏆
Extended Target: 151.00 🌙
Gann Resistance: 150.25 ⭐
📉 BEARISH INVALIDATION:
Weekly Support: 148.00 ⚠️
Critical Break: 147.00 🚨
🎭 MARKET STRUCTURE:
Trend: Parabolic Extension 💪
Momentum: Intervention Risk 🔥
Wyckoff Phase: Distribution Risk 📈
Ichimoku: Overbought Signals 🟡
🏛️ CENTRAL BANK DYNAMICS:
BoJ Intervention: 150 Trigger Level 🚨
Verbal Warnings: Intensifying 📢
USD Strength: Fed Policy Support 💵
Rate Differential: Widening 📊
⚡ RISK MANAGEMENT:
Max Risk per Trade: 40 pips 🛡️
R:R Ratio: Conservative 1:1.5 ⚖️
Intervention Alert: Above 149.80 📏
🌍 FUNDAMENTAL CATALYSTS:
Fed Hawkishness vs BoJ Dovish 🏦
US Yields Supporting USD 📈
Japan CPI Remaining Low 📊
Tokyo Session High Volatility 🗾
🔥 INTERVENTION WATCH:
BoJ Trigger: 150.00 Level 💥
Historical Pattern: Verbal → Action 📉
Risk/Reward: Deteriorating 📉
⚠️ DANGER ZONE LEVELS:
Intervention Risk: 149.80+ 🚨
Support: 149.00 | 148.50 | 148.00 🛡️
Resistance: 150.00 | 150.50 | 151.00 🚧
🎯 FINAL VERDICT:
USDJPY at CRITICAL 150 BATTLE! 🚀
BoJ intervention risk MAXIMUM! ⚠️
Bulls vs Central Bank showdown! ⚔️
Trade Management: Reduce size near 150! 💰
Alert Level: 149.80 intervention warning! 🚨
---
⚠️ Disclaimer: High intervention risk. Use tight stops. Educational analysis only.
For individuals seeking to enhance their trading abilities based on the analyses provided, I recommend exploring the mentoring program offered by Shunya Trade. (Website: shunya dot trade)
I would appreciate your feedback on this analysis, as it will serve as a valuable resource for future endeavors.
Sincerely,
Shunya.Trade
Website: shunya dot trade
🔔 Follow BoJ Intervention Alerts | 💬 Share Your 150 Strategy

EURUSD: 1.18 FORTRESS ATTACK! Dollar Weakness Exposed 🚀 EURUSD: 1.18 FORTRESS ATTACK! Dollar Weakness Exposed 📊
Current Price: 1.17020 | Date: Sept 27, 2025 ⏰
📈 INTRADAY TRADING SETUPS (Next 5 Days)
🎯 BULLISH SCENARIO
Entry Zone: 1.1680 - 1.1710 📍
Stop Loss: 1.1650 🛑
Target 1: 1.1750 🎯
Target 2: 1.1790 🚀
🎯 BEARISH SCENARIO
Entry Zone: 1.1720 - 1.1750 📍
Stop Loss: 1.1780 🛑
Target 1: 1.1650 🎯
Target 2: 1.1600 📉
🔍 TECHNICAL ANALYSIS BREAKDOWN
📊 KEY INDICATORS STATUS:
RSI (14): 62.1 ⚡ Euro Strength Building
Bollinger Bands: Expansion Mode 🔥
VWAP: 1.1695 - Dynamic Support 💪
EMA 20: 1.1675 ✅ Bullish Momentum
Volume: Institutional Flow Rising 📊
🌊 WAVE ANALYSIS:
Elliott Wave: Wave C Impulse Active 🌊
Fibonacci Target: 1.1850 (127.2%) 🎯
🔄 HARMONIC PATTERNS:
Bullish Gartley at 1.1660 Support ✨
Cypher PRZ targeting 1.1780 🔄
⚖️ SWING TRADING OUTLOOK (1-4 Weeks)
🚀 BULLISH TARGETS:
Psychological: 1.1800 🏆
Weekly Resistance: 1.1850 🌙
Gann Level: 1.1875 ⭐
📉 BEARISH INVALIDATION:
Weekly Support: 1.1600 ⚠️
Critical Break: 1.1550 🚨
🎭 MARKET STRUCTURE:
Trend: Ascending Channel 💪
Momentum: Dollar Weakness 🔥
Wyckoff Phase: Markup Phase 📈
Ichimoku: Bullish Cloud Break 🟢
🏰 1.18 FORTRESS BATTLE:
Key Resistance: 1.1780-1.1800 ⚔️
Volume Confirmation: Needed Above 1.1750 💥
Breakout Target: 1.1850 Major Level 🔓
⚡ RISK MANAGEMENT:
Max Risk per Trade: 50 pips 🛡️
R:R Ratio: Minimum 1:2 ⚖️
London/NY Sessions: Prime Time 📏
🌍 CENTRAL BANK DYNAMICS:
ECB Policy Divergence Bullish 🏛️
Fed Dovishness Supporting EUR 📈
Dollar Index Weakness Continues 💵
Rate Differential Narrowing 📊
🔥 CRITICAL LEVELS:
Breakout: 1.1750 decisive close 💥
Support: 1.1680 | 1.1650 | 1.1620 🛡️
Resistance: 1.1750 | 1.1780 | 1.1800 🚧
📈 DXY CORRELATION:
Dollar Index: Bearish Divergence 📉
EUR Strength: Independent Rally 💪
Cross-Currency: Bullish Flow 🔄
🎯 FINAL VERDICT:
EURUSD storming 1.18 RESISTANCE! 🚀
Dollar weakness = Euro rocket fuel! 💎
Multi-timeframe bullish alignment! 📈
Trade Management: Scale in above 1.1680 💰
Breakout Alert: Watch 1.1750 hold! 🔔
---
⚠️ Disclaimer: FX trading involves significant risk. Use proper position sizing. Educational analysis only.
For individuals seeking to enhance their trading abilities based on the analyses provided, I recommend exploring the mentoring program offered by Shunya Trade. (Website: shunya dot trade)
I would appreciate your feedback on this analysis, as it will serve as a valuable resource for future endeavors.
Sincerely,
Shunya.Trade
Website: shunya dot trade
🔔 Follow FX Market Updates | 💬 What's Your 1.18 Target Timeline?

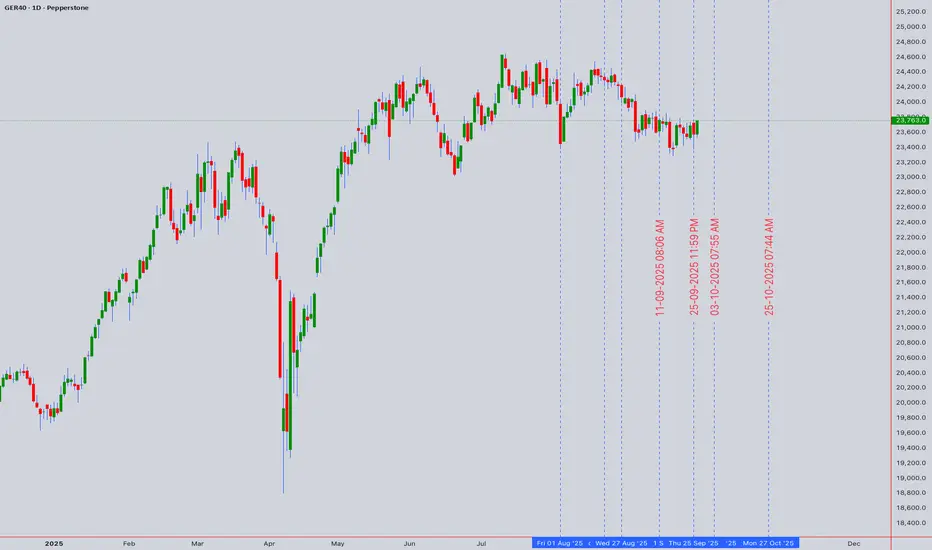
GER40: 24K FORTRESS UNDER SIEGE! European Bull Run 🚀 GER40: 24K FORTRESS UNDER SIEGE! European Bull Run 📊
Current Price: 23,763.00 | Date: Sept 27, 2025 ⏰
📈 INTRADAY TRADING SETUPS (Next 5 Days)
🎯 BULLISH SCENARIO
Entry Zone: 23,720 - 23,780 📍
Stop Loss: 23,650 🛑
Target 1: 23,920 🎯
Target 2: 24,080 🚀
🎯 BEARISH SCENARIO
Entry Zone: 23,800 - 23,850 📍
Stop Loss: 23,920 🛑
Target 1: 23,600 🎯
Target 2: 23,450 📉
🔍 TECHNICAL ANALYSIS BREAKDOWN
📊 KEY INDICATORS STATUS:
RSI (14): 63.7 ⚡ Bullish Territory Hold
Bollinger Bands: Upper Band Test 🔥
VWAP: 23,740 - Critical Pivot 💪
EMA 20: 23,680 ✅ Strong Uptrend Base
Volume: Above Average Flow 📊
🌊 WAVE ANALYSIS:
Elliott Wave: Wave 3 Impulse Active 🌊
Fibonacci Extension: 24,200 Target 🎯
🔄 HARMONIC PATTERNS:
Bullish Gartley Completion at 23,650 ✨
Cypher Pattern PRZ Active 🔄
⚖️ SWING TRADING OUTLOOK (1-4 Weeks)
🚀 BULLISH TARGETS:
Psychological: 24,000 🏆
Weekly Resistance: 24,150 🌙
Gann Square: 24,300 ⭐
📉 BEARISH INVALIDATION:
Weekly Support: 23,500 ⚠️
Critical Break: 23,300 🚨
🎭 MARKET STRUCTURE:
Trend: Ascending Channel 💪
Momentum: Building Steam 🔥
Wyckoff Phase: Mark-up Active 📈
Ichimoku: Bullish Breakout 🟢
🏰 24K FORTRESS BATTLE:
Resistance Cluster: 23,950-24,050 ⚔️
Volume Spike Needed: Above 24,000 💥
Breakout Confirmation: 24,080 hold 🔓
⚡ RISK MANAGEMENT:
Max Risk per Trade: 1.2% 🛡️
R:R Ratio: Minimum 1:2.5 ⚖️
European Session: Prime Trading 📏
🌍 EUROPEAN CATALYSTS:
ECB Policy Supporting Growth 🏛️
German Economic Data Resilient 📈
Export Sector Momentum Strong 🚢
🔥 CRITICAL LEVELS:
Breakout: 23,850 decisive close 💥
Support: 23,700 | 23,620 | 23,500 🛡️
Resistance: 23,900 | 24,000 | 24,150 🚧
🎯 FINAL VERDICT:
DAX storming toward 24K BREAKTHROUGH! 🚀
European strength driving momentum! 💪
Bull channel intact - trend your friend! 📈
Trade Management: Buy dips to VWAP support 💎
Key Battle: 24K psychological fortress! 🏰
---
⚠️ Disclaimer: Trading involves substantial risk. Use proper position sizing. Educational content only.
For individuals seeking to enhance their trading abilities based on the analyses provided, I recommend exploring the mentoring program offered by Shunya Trade. (Website: shunya dot trade)
I would appreciate your feedback on this analysis, as it will serve as a valuable resource for future endeavors.
Sincerely,
Shunya.Trade
Website: shunya dot trade
🔔 Follow European Markets | 💬 Share Your DAX 24K Strategy
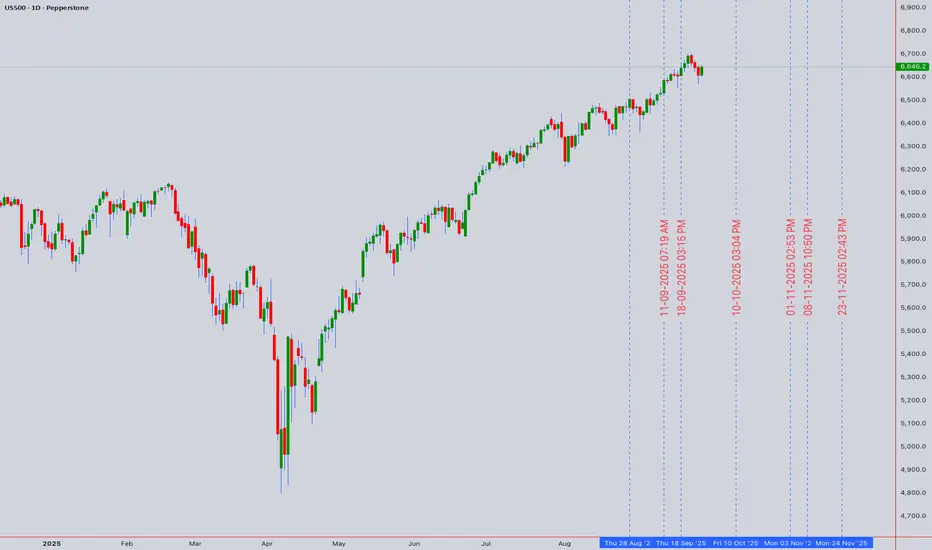
US500: 7K ASSAULT BEGINS! Mega Bull Flag Breakout 🚀 US500: 7K ASSAULT BEGINS! Mega Bull Flag Breakout 📊
Current Price: 6,646.2 | Date: Sept 27, 2025 ⏰
📈 INTRADAY TRADING SETUPS (Next 5 Days)
🎯 BULLISH SCENARIO
Entry Zone: 6,630 - 6,650 📍
Stop Loss: 6,590 🛑
Target 1: 6,720 🎯
Target 2: 6,780 🚀
🎯 BEARISH SCENARIO
Entry Zone: 6,670 - 6,690 📍
Stop Loss: 6,720 🛑
Target 1: 6,580 🎯
Target 2: 6,520 📉
🔍 TECHNICAL ANALYSIS BREAKDOWN
📊 KEY INDICATORS STATUS:
RSI (14): 61.2 ⚡ *Bullish Momentum Building*
Bollinger Bands: Coiling for Expansion 🔥
VWAP: 6,635 - Acting as Launch Pad 💪
EMA 50: 6,610 ✅ *Golden Cross Confirmed*
Volume: Institutional Accumulation 📊
🌊 WAVE ANALYSIS:
Elliott Wave: Wave 4 Triangle Complete 🌊
Target: Wave 5 Extension to 7,000+ 🎯
🔄 HARMONIC PATTERNS:
Bullish Butterfly at 6,600 Support ✨
ABCD Pattern targeting 6,780 🔄
⚖️ SWING TRADING OUTLOOK (1-4 Weeks)
🚀 BULLISH TARGETS:
Psychological: 7,000 🏆
Monthly Target: 6,850 🌙
Gann Resistance: 6,900 ⭐
📉 BEARISH INVALIDATION:
Weekly Support: 6,550 ⚠️
Critical Level: 6,480 🚨
🎭 MARKET STRUCTURE:
Trend: Ascending Triangle 💪
Momentum: Coiling Energy 🔥
Wyckoff Phase: Spring Loading 📈
Ichimoku: Bullish Cloud Break 🟢
🏆 MEGA PATTERN ALERT:
Bull Flag Pole: 6,400 → 6,700 📏
Flag Consolidation: 6,600-6,680 🚩
Breakout Target: 6,980 (300pt move!) 💥
⚡ RISK MANAGEMENT:
Max Risk per Trade: 1.5% 🛡️
R:R Ratio: Minimum 1:2.5 ⚖️
Breakout Confirmation: 6,690 close 📏
🌍 MARKET CATALYSTS:
Q3 Earnings Beating Expectations 📈
Fed Dovish Stance Supporting Risk-On 🏛️
Economic Resilience Narrative Strong 💼
🔥 KEY LEVELS TO WATCH:
Breakout Zone: 6,680-6,700 💥
Support Cluster: 6,620 | 6,580 | 6,550 🛡️
Resistance: 6,720 | 6,780 | 6,850 🚧
🎯 FINAL VERDICT:
S&P500 primed for EXPLOSIVE 7K RALLY! 🚀
Bull flag completion = 300+ point surge! 💯
Multiple timeframes align perfectly! 📈
Trade Management: Scale into dips above 6,620 💎
Breakout Alert: Watch 6,690 decisive close! 🔔
---
*⚠️ Disclaimer: High-risk trading. Use strict risk management. Educational analysis only.*
For individuals seeking to enhance their trading abilities based on the analyses provided, I recommend exploring the mentoring program offered by Shunya Trade. (Website: shunya dot trade)
I would appreciate your feedback on this analysis, as it will serve as a valuable resource for future endeavors.
Sincerely,
Shunya.Trade
Website: shunya dot trade
🔔 Follow for 7K Journey Updates | 💬 What's Your 7K Timeline?
US30: 50K MAGNET ACTIVATED! Historic Breakout Loading# 🚀 US30: 50K MAGNET ACTIVATED! Historic Breakout Loading 📊
Current Price: 49,269.7 | Date: Sept 27, 2025 ⏰
📈 INTRADAY TRADING SETUPS (Next 5 Days)
🎯 BULLISH SCENARIO
Entry Zone: 49,200 - 49,300 📍
Stop Loss: 49,000 🛑
Target 1: 49,600 🎯
Target 2: 49,850 🚀
🎯 BEARISH SCENARIO
Entry Zone: 49,350 - 49,400 📍
Stop Loss: 49,500 🛑
Target 1: 48,900 🎯
Target 2: 48,650 📉
🔍 TECHNICAL ANALYSIS BREAKDOWN
📊 KEY INDICATORS STATUS:
RSI (14): 64.8 ⚡ *Bullish Momentum Zone*
Bollinger Bands: Upper Band Squeeze 🔥
VWAP: 49,180 - Strong Support Base 💪
EMA 20: 49,150 ✅ *Golden Cross Active*
Volume: Above Average 📊 *Institutional Flow*
🌊 WAVE ANALYSIS:
Elliott Wave: Wave 3 Extension in Progress 🌊
Fibonacci Target: 50,200 (161.8% Extension) 🎯
🔄 HARMONIC PATTERNS:
Bullish Cypher Completion at 49,100 ✨
Gartley PRZ Active - 49,050 Zone 🔄
⚖️ SWING TRADING OUTLOOK (1-4 Weeks)
🚀 BULLISH TARGETS:
Psychological: 50,000 🏆
Weekly Target: 50,300 🌙
Gann Square: 50,625 ⭐
📉 BEARISH INVALIDATION:
Weekly Support: 48,800 ⚠️
Critical Break: 48,500 🚨
🎭 MARKET STRUCTURE:
Trend: Strong Bullish Impulse 💪
Momentum: Accelerating 🔥
Wyckoff Phase: Mark-up Phase 📈
Ichimoku: All Systems Green 🟢
🏆 HISTORIC LEVELS:
50K Psychological: Major Magnet 🧲
All-Time High: 49,450 (Breaking Soon!) 💥
Monthly Pivot: 49,100 Support 🛡️
⚡ RISK MANAGEMENT:
Max Risk per Trade: 1% 🛡️
R:R Ratio: Minimum 1:3 ⚖️
Trailing Stops: Every 200 points 📏
🌍 MARKET CATALYSTS:
Economic Data Supporting Rally 📈
Corporate Earnings Momentum 💼
Fed Policy Tailwinds Continue 🏛️
🔥 CRITICAL WATCH ZONES:
Breakout: 49,350 confirmed close 💥
Support: 49,100 | 48,950 | 48,800 🛡️
Resistance: 49,500 | 49,750 | 50,000 🚧
🎯 FINAL VERDICT:
US30 poised for HISTORIC BREAKOUT to 50K! 🚀
Multiple confluences aligning perfectly! 💯
Bull flag formation targeting new ATH! 📈
Trade Management: Buy dips to VWAP support 💎
Key Level: Hold above 49,100 crucial 🔑
---
*⚠️ Disclaimer: Trading involves significant risk. Use proper position sizing. Educational purposes only.*
For individuals seeking to enhance their trading abilities based on the analyses provided, I recommend exploring the mentoring program offered by Shunya Trade. (Website: shunya dot trade)
I would appreciate your feedback on this analysis, as it will serve as a valuable resource for future endeavors.
Sincerely,
Shunya.Trade
Website: shunya dot trade
🔔 Follow for Live Updates | 💬 Drop Your 50K Predictions Below

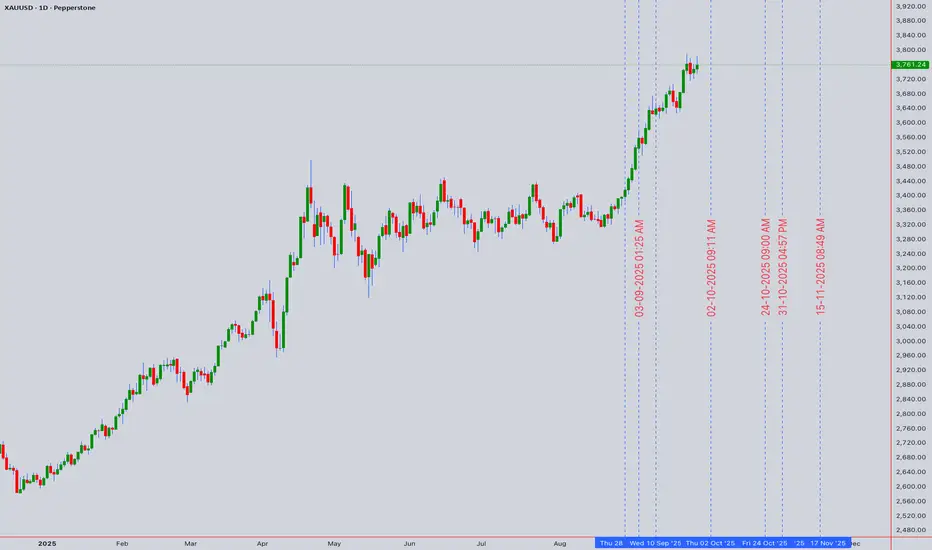
XAUUSD: MASSIVE BREAKOUT IMMINENT! Multi-Timeframe Analysis# 🚀 XAUUSD: MASSIVE BREAKOUT IMMINENT! Multi-Timeframe Analysis 📊
Closing Price: $3,761.24 | Date: Sept 27, 2025 ⏰ UTC +4
📈 INTRADAY TRADING SETUPS (Next 5 Days)
🎯 BULLISH SCENARIO
Entry Zone: $3,755 - $3,760 📍
Stop Loss: $3,740 🛑
Target 1: $3,785 🎯
Target 2: $3,810 🚀
🎯 BEARISH SCENARIO
Entry Zone: $3,770 - $3,775 📍
Stop Loss: $3,790 🛑
Target 1: $3,730 🎯
Target 2: $3,700 📉
🔍 TECHNICAL ANALYSIS BREAKDOWN
📊 KEY INDICATORS STATUS:
RSI (14): 67.2 ⚡ *Approaching Overbought*
Bollinger Bands: Price at Upper Band 🔥
VWAP: $3,752 - Acting as Dynamic Support 💪
EMA 20: $3,748 ✅ *Bullish Cross Confirmed*
Volume: Above Average 📊 *Institutional Interest*
🌊 WAVE ANALYSIS:
Elliott Wave suggests we're in Wave 3 of larger uptrend 🌊
Fibonacci Extension: $3,820 (161.8% target) 🎯
🔄 HARMONIC PATTERNS:
Bullish Gartley completion at $3,745 ✨
PRZ (Potential Reversal Zone) active 🔄
⚖️ SWING TRADING OUTLOOK (1-4 Weeks)
🚀 BULLISH TARGETS:
Weekly Resistance: $3,820 🏆
Monthly Target: $3,880 🌙
Gann Square of 9: $3,900 ⭐
📉 BEARISH INVALIDATION:
Weekly Support: $3,680 ⚠️
Critical Level: $3,650 🚨
🎭 MARKET STRUCTURE:
Trend: Strong Bullish 💪
Momentum: Accelerating 🔥
Wyckoff Phase: Mark-up Phase 📈
Ichimoku: All systems GREEN 🟢
⚡ RISK MANAGEMENT:
Max Risk per Trade: 2% 🛡️
R:R Ratio: Minimum 1:2 ⚖️
Position Size: Based on volatility 📏
🌍 MARKET CATALYSTS:
- Fed Policy Meeting Next Week 🏛️
- Geopolitical Tensions Supporting Gold 🌐
- Dollar Weakness Continuing 💵
🎯 FINAL VERDICT:
Gold shows STRONG BULLISH BIAS with multiple confluences aligning! 🚀
Watch for breakout above $3,775 for explosive move to $3,820+ 💥
Trade Management: Trail stops every 4H close above entry 📈
Key Level to Watch: $3,752 VWAP support 👀
---
*⚠️ Disclaimer: Trading involves risk. Always use proper risk management and never risk more than you can afford to lose. This analysis is for educational purposes only.*
For individuals seeking to enhance their trading abilities based on the analyses provided, I recommend exploring the mentoring program offered by Shunya Trade. (Website: shunya dot trade)
I would appreciate your feedback on this analysis, as it will serve as a valuable resource for future endeavors.
Sincerely,
Shunya.Trade
Website: shunya dot trade
🔔 Follow for Daily Updates | 💬 Comment Your Thoughts Below
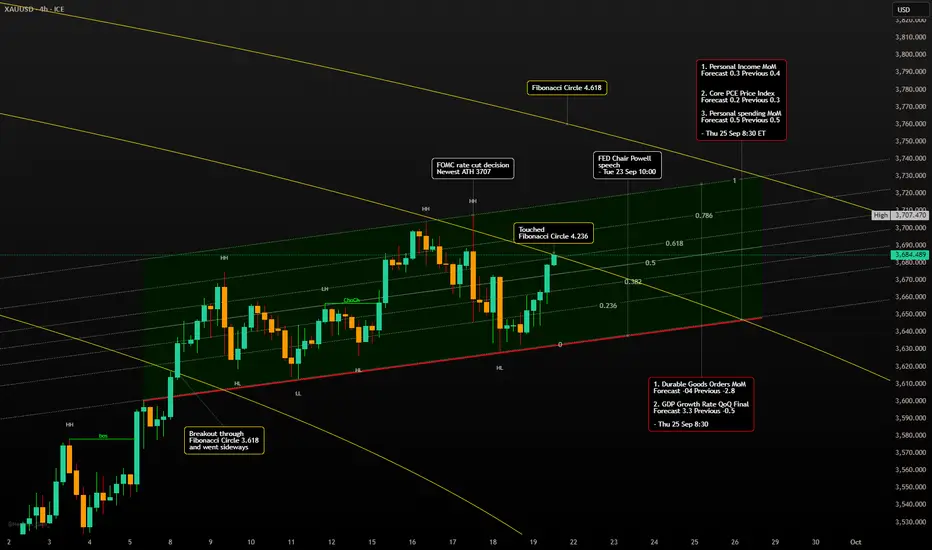
Gold Week Sep 22 - Sep 26 - Fibonacci Circles Breakout?🎢 Last Friday was a rollercoaster, and not the fun kind for me. 😅 My trading plan went completely haywire, and I'm pretty sure everyone reading was like, "What is this noob doing? 😂" But hey, we learn from our mistakes, right? So let's break down what happened.
FX_IDC:XAUUSD Crazy Friday 💥
I usually trade during the European session, and everything was going smoothly. Gold was behaving just as I expected, dropping to $3643. Then, chaos! 😱
First, it shot up to $3659, and just when I thought it was done, it decided to fall back down to $3643. But wait, there's more! At the start of the US session 🇺🇸, it went on a bullish rampage, soaring to $3685, the high of the day. 🚀 I was totally caught off guard! My bias was short because of the recent highs after the FOMC and rate cut news. That was a big lesson learned. 😩
What's Up Next? A Big Week Ahead! 🔮
Get ready, because this week is going to be HUGE! 🎉 My analysis shows that Gold is in a **super important spot** right now. It's in the perfect position to try and make a big move higher! 📈
You might not believe me, but my Fibonacci circle analysis is screaming "breakout!" 📢 If you draw a Fibonacci circle on the daily chart from **$3500.200 (April 21, 2025)** to **$3246.550 (June 29, 2025)**, you'll see a pattern of breakouts. And guess what? We're on one of those circles right now! It's no joke, you should totally try it yourself. 🤯
As long as Gold holds this level, it's primed for a surge. 🌊 I even drew an image showing that Gold is sitting right on the 4.236 Fibonacci circle level from Friday's close. This is serious stuff! 🧐
I'm expecting a sideways "ping pong" 🏓 kind of week until Thursday, bouncing around the 0.382 and 1 Fibonacci levels. The ascending parallel channel gives us a clue on where it might go in the short term.
Heads Up: This Week's Economic Events 📅
Keep an eye on these key events, as they can really shake things up! 🔔
Thursday, September 25th, 8:30 AM EST
- Durable Goods Orders MoM: Forecast -0.4% (Previous -2.8%)
- GDP Growth Rate QoQ Final: Forecast 3.3% (Previous -0.5%)
Friday, September 26th, 8:30 AM EST
- Personal Income MoM - Forecast 0.3 Previous 0.4
- Core PCE Price Index - Forecast 0.2 Previous 0.3
- Personal spending MoM - Forecast 0.5 Previous 0.5
My Two Cents: A Word of Caution 🙏
Things can change in the blink of an eye, so be careful! I don't know what the next Asian and EU session will bring, but I have a feeling the US session is gearing up to buy Gold again. 💰
Remember, different trading sessions (Asia 🌏, Europe, and the US) have different biases. Don't make the same mistake I did last Friday! 😔 Stay sharp and happy trading! 🚀
-------------------------------------------------------------------------
This is just my personal market idea and not financial advice! 📢 Trading gold and other financial instruments carries risks – only invest what you can afford to lose. Always do your own analysis, use solid risk management, and trade responsibly.
Good luck and safe trading! 🚀📊
GBP/CHF BULLISH BIAS RIGHT NOW| LONG
GBP/CHF SIGNAL
Trade Direction: long
Entry Level: 1.067
Target Level: 1.075
Stop Loss: 1.062
RISK PROFILE
Risk level: medium
Suggested risk: 1%
Timeframe: 1D
Disclosure: I am part of Trade Nation's Influencer program and receive a monthly fee for using their TradingView charts in my analysis.
✅LIKE AND COMMENT MY IDEAS✅

Treasury General Account MAJOR Impact on $BTC PriceI’ll be the first to admit I failed to closely follow and analyze the impact of the Treasury General Account (TGA).
We all know it’s a liquidity suck on ₿itcoin and cryptocurrencies, which are the most highly sensitive assets to liquidity, but have you ever dove into the data to see just how impactful it is?
I went through all the refills and calculated how much it drew down the CRYPTOCAP:BTC price.
Note how TGA refills also marked cycle tops in 2017 and 2021.
This really is something to closely monitor going forward alongside Total Global Liquidity (TGL).
What I have found is when TGA refills are occurring, they have more impact on the price of BTC than TGL.
We can see this in the current state of market, where TGL is at an ATH and the TGA is currently being refilled.
GOOD NEWS: The TGA refill is just about complete 🏁
Moon on brave soldiers 🌛

Gold Pullback Toward 3,700 Within Ongoing UptrendHey Traders, in today's trading session we are monitoring XAUUSD (Gold) for a buying opportunity around the 3,700 zone. Gold is trading in an uptrend, with price currently correcting toward this key support/resistance level.
Structure: The broader bias remains bullish, but price is retracing after recent highs.
Key level in focus: 3,700 — a critical area where buyers may look to step in and resume the upward move.
Fundamentals: Softer USD sentiment and steady safe-haven demand continue to favor the bullish case for Gold on dips.
Trade safe,
Joe.

Global news might have us Stalling on Gold! Chart Context (MGC Futures, H1/H4)
Price stalled out after rejecting the H4 bearish zone (3791.4–3769.9).
Yesterday’s downside move lost steam before fully reaching the deeper H4 bullish demand (3746.3–3735.2).
We’re now compressing between Daily High (3792.1) and Daily Low (3752.0).
Fundamentals:
U.S. geopolitical/military headlines (Defense Secretary Pete Hegseth ordering hundreds of generals/admirals to an urgent meeting at Quantico, Sep 30) are creating uncertainty, which could trigger safe-haven flows in gold.
Bias Going Into Friday:
Watching for liquidity sweep of yesterday’s lows (~3752/DL). If swept and reclaimed, could trigger bullish continuation.
Alternatively, a clean break & hold above yesterday’s high (~3792/DH) sets up momentum longs targeting 3812+ (previous imbalance).
No trade in the middle of the chop — patience until liquidity is taken on one side.

ETHUSD - Expect a bounce ... now? lets go above ATHLong time no see !
I was in vacations with the cult of the CME Gap that I joined
Soooo, Eth took some logic profits, it was a quasi straight line from 2400 to 4800 (not mentionning that its coming before from under 1500), a 10% correction is totally ok
we are actually in the middle of the last CME GAP, its filling daddy
Dec 2024 high
100 MA 4H
0.5 fib resistance from last low
0.236 is 4K so we still have room to be in denial if it dips more
as you can see thats a lot of convergences, not even talking about BTC, BTC.D, USDT.D, GOLD and all the other tickers aligning perfectly for the big ritual of the big last leg of the big bull run (B.R.B.L.L.B.B.R.) (I know how to make it since those vacations)
Sooo SL is slightly under first bullish Order Block that u can see in this chart @ around 3440, yes sry I can't mess with the levs even with this perfect entry opportunity
TP1 : 7000
TP2 : 9000
TP3 : 11000 (0.618 fib extension)
Will update the TPs if momentum changes
XX
not advise

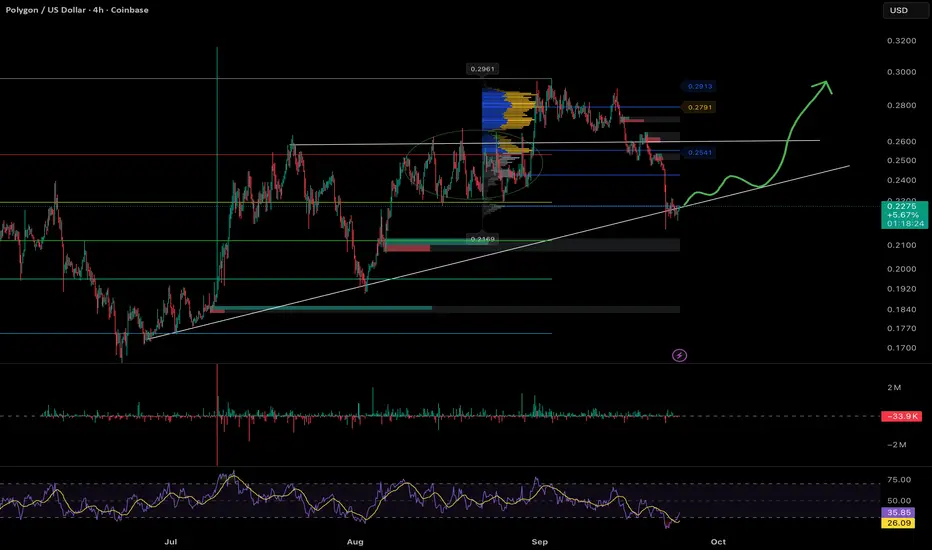
POLUSD Polygon (ex-Matic) Second attempt here following the trendline for now,
SL at 0.1990 if it wicks. And will close below the trendline if theres a clear daily breakdown
TPs : Same as the first try
0.75
1.5
3
6.5
18
cheers
WAFD Stock Going UP, Bullish Momentum ConfirmedHello,
Ayrfolio trade ideas are based on weekly charts and momentum, so remember to be patient! No day trades here unless the stock soars up intraday. Today we’re covering:
COMPANY: WaFd, Inc.
STOCK SYMBOL: WAFD
POSITION: Long
TP1 Risk-Reward Ratio: 1.79
TP2 Risk-Reward Ratio: 3.59
Stop Loss: must wait AFTER daily candle closes to exit trade (regular candle, NOT Heiken Ashi)
Ultimate Stop Loss: can exit IMMEDIATELY if price reaches this level during any trading hours
EXPLANATION: Weekly momentum increased and confirmed on Monday 8/18/25 at $31.73/share. Although the stop losses are listed on the chart, if momentum has been lost then we can exit before the price reaches the stop loss.
DISCLAIMER: Please do your own due diligence before making any decisions. I am not an investment advisor, and I do not personally trade these stocks. These posts are stock trade ideas that follow my same weekly momentum strategy. Past results are not indicative of future performance.
P.S. - Stocks can soar. YOU can soar. Soaring is possible!
-Ayrfolio

HBAR Long Spot Setup – Retesting Major SupportHBAR is pulling back into a key support zone between $0.19–$0.21, a historically significant area where buyers have previously stepped in with strength. With the broader market showing signs of stabilization, this zone may offer a solid opportunity for laddered spot accumulation.
Price action shows confluence with previous demand levels, and volume is beginning to stabilize, which could signal waning selling pressure. If this level holds, a bounce toward higher resistance zones becomes likely in the coming sessions or weeks.
🔁 Trade Setup:
• Entry Zone: $0.19–$0.21 (laddered entries)
• Target 1: $0.28–$0.31
• Target 2: $0.36–$0.40
• Stop Loss: Below $0.18

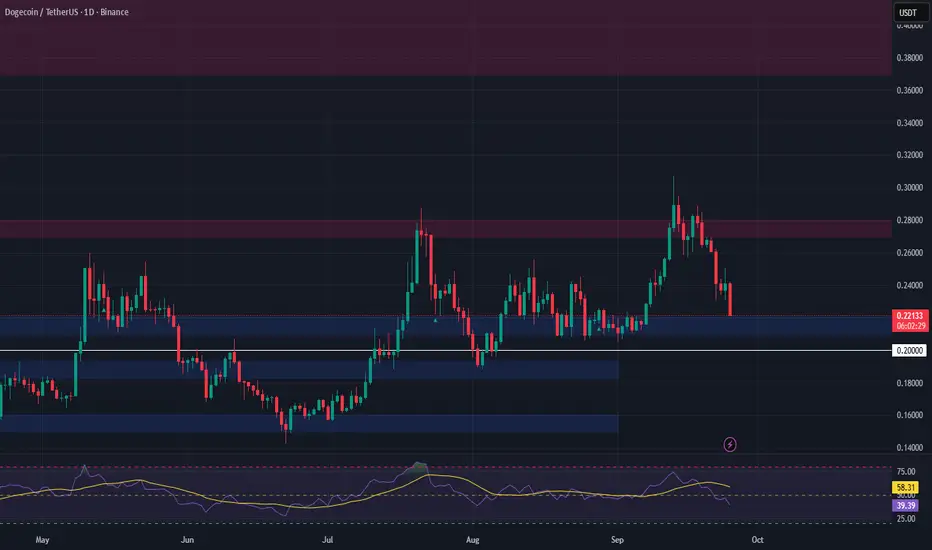
DOGE — Watching for a Relief Bounce from SupportDogecoin has pulled back into a key support zone at $0.21–$0.22, a level that has historically acted as both resistance and support. With the broader market showing signs of consolidation, this area could offer a short-term bounce opportunity.
That said, this is likely a relief rally within a broader downtrend, so managing risk is critical. A failure to hold this support could lead to a deeper correction later this month.
🔹 Trade Plan:
• Entry Zone: $0.21–$0.22
• Targets: $0.27–$0.28, $0.37–$0.44
• Stop Loss: Below $0.20
This is a spot-only setup with an asymmetric risk-reward profile if the bounce materializes. Avoid overleveraging and stick to your plan.
Bullish Setup, Swing Trade Opportunity in XAGUSDJust wait for a Price to Enter in our Discount Zone and then we are Ready to go Long with Proper Risk Management

Bitcoin Elliott Wave Projection – Bullish Setup AheadBitcoin has recently completed a corrective ABC pattern, with the C leg finding strong support in the highlighted buy zone. At Level (A), a small bullish divergence appeared, signaling that the correction was nearing its end and a new impulsive cycle was likely to begin.
Wave Structure
Wave 1 has already formed, showing the first sign of strength after the correction.
Wave 2 is currently unfolding, retesting the buy zone and offering a strong accumulation opportunity.
The next major move is expected to be Wave 3, which is projected to extend toward 128300.
After a corrective pullback in Wave 4, the final push of Wave 5 could carry Bitcoin toward 134200.
Key Levels
Buy zone: 110000 – 112000
Wave 3 target: 128300
Wave 5 target: 134200
Summary
The bullish divergence, combined with the completed ABC correction and the developing impulsive wave structure, suggests that Bitcoin is preparing for a strong continuation to the upside. Holding above the buy zone keeps this bullish outlook intact, with significant upside potential in the coming weeks.

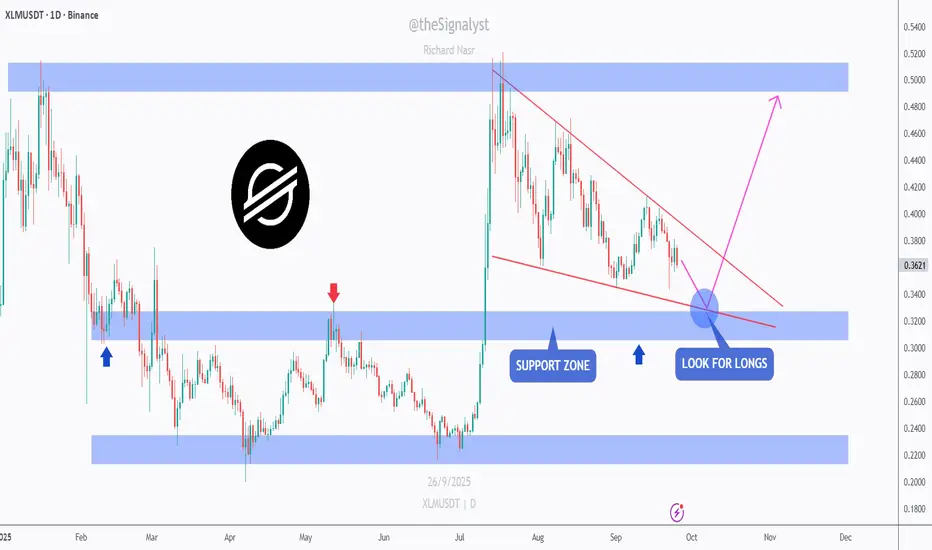
XLM - Waiting for the Wedge × Support RetestXLM is drifting inside a falling wedge and approaching the 0.34–0.32 blue support. I’m waiting for a retest of the intersection between the wedge’s lower trendline and this support to look for longs.
If buyers defend that confluence, I’ll look for a move toward 0.39–0.41, then 0.46–0.52 into the upper supply. A daily close below 0.32 invalidates and puts 0.24–0.23 back in play.
What’s your plan => bid the retest at the intersection, or wait for a clean wedge break first? 🤔
⚠️ Disclaimer: This is not financial advice. Always do your own research and manage risk properly.
📚 Stick to your trading plan regarding entries, risk, and management.
Good luck! 🍀
All Strategies Are Good; If Managed Properly!
~Richard Nasr
USDJPY - Support Holding Strong!📈USDJPY has been overall bullish trading within the rising channel marked in blue.
This week, USDJPY has been bearish trading within the falling red wedge and it is currently rejecting the lower bound of it!
Moreover, the orange zone is a strong support.
🏹 Thus, the highlighted blue circle is a strong area to look for buy setups as it is the intersection of the lower red trendline and orange support.
📚 As per my trading style:
As #USDJPY is around the blue circle zone, I will be looking for trend-following bullish reversal setups (like a double bottom pattern, trendline break , and so on...)
📚 Always follow your trading plan regarding entry, risk management, and trade management.
Good luck!
All Strategies Are Good; If Managed Properly!
~Richard Nasr
