AUDUSD Breakout and Potential RetraceHey Traders, in the coming week we are monitoring AUDUSD for a buying opportunity around 0.65400 zone, AUDUSD was trading in a downtrend and successfully managed to break it out. Currently is in a correction phase in which it is approaching the retrace area at 0.65400 support and resistance area.
Trade safe, Joe.
Bullish Patterns

$BTC 200DMA Date With Destiny & ISM PMI RelationshipIn every prior cycle when CRYPTOCAP:BTC lost the 200DMA it retested it well into the midterm year.
Everyone still believed in the 4-year cycle even with this failed relief rally.
But all of a sudden this time is supposed to be different 🤓
My base-case is that we do finally see a proper business cycle in 2026.
I would give it a 50% probability that CRYPTOCAP:BTC does see a higher price IF that does occur.
My hesitation here is that BTC got a higher high in November 2021 with a declining ISM vs March.
Additionally, in April 2014 and February 2018 the ISM printed a slightly higher high, but BTC printed a lower high.
This is the conundrum ₿itcoin has with the ISM, and part of the Twin Peaks thesis (pinned tweet).

BTC not over yet.BTC is not over yet, As you can see on the chart there are still 2 major trends remaining as BTC is having a reaction of the 85k level. As long as we can remain this area, there are still possibilities fo a push to a new ath.

DOGEUSDT | Break & Retest Setup – Long OpportunityWe’re closely watching DOGE for a classic break-and-retest setup at a key resistance zone. The area around $0.1550 has been a significant overhead barrier. A confirmed breakout followed by a clean retest of this level as support would provide a solid long spot entry opportunity.
📈 Entry Plan: Long on a positive retest of $0.1550
🎯 Take Profit Zones:
TP1: $0.18 – $0.21
TP2: $0.24 – $0.29
🛑 Stop Loss: Below $0.135

Gold Eyes 4,110 — USD Weakness Could Fuel the Next Leg Up!!Hey Traders,
In today's trading session we are monitoring GOLD (XAUUSD) for a potential buying opportunity around the 4,110 zone. Gold continues to trade firmly within an established uptrend, and the current pullback is bringing price right into a key support + trend confluence at 4,110 — a zone where buyers have consistently stepped in.
Macro context supports this setup:
The US Dollar has been losing momentum, pressured by rising expectations of a December FED rate cut and increasingly soft economic data. Weak labor market signals, cooler inflation trends, and shifting rate expectations have collectively weighed on the DXY.
A softening USD typically acts as a tailwind for gold, especially in environments where monetary policy is turning more accommodative.
If the Dollar continues to slide, it could provide the catalyst needed for Gold to resume its bullish leg off the 4,110 support zone.
Trade safe,
Joe

Gold Buyers Regain Momentum — Aiming for 4,240 RetestHello traders! Let’s break down the current XAUUSD structure. Gold is trading within a broad ascending structure after forming a strong local bottom around the Support Line, where buyers entered the market and started to push the price higher. This upward movement follows a long corrective phase, during which the price respected the diagonal Support Line multiple times — confirming the presence of a stable bullish trend. Earlier, XAUUSD broke out of the Buyer Zone (4,110–4,120), retested it, and successfully held above it. This zone now acts as a key demand area and the primary level where buyers continue defending the trend. A previous bearish attempt failed here, forming a fake breakout and leading to a new bullish impulse. The price is now approaching the descending Resistance Line, which has repeatedly pushed gold lower during the recent correction. A clean breakout above this trendline may open the way for the price to move toward the major Resistance Level at 4,240.00, which also aligns with the first take-profit area (TP1). This Resistance Level has acted as a strong reaction zone multiple times, causing sharp pullbacks and marking the boundaries of the Seller Zone. Buyers will likely face significant opposition here once again. If gold respects the Buyer Zone and maintains trading above 4,110, the bullish scenario remains intact, and the price may push toward TP1 → 4,240. A confirmed breakout above this level would signal continuation toward higher targets within the broader bullish structure. However, if XAUUSD fails to hold the Buyer Zone and breaks below 4,110, the bullish outlook becomes invalid. In this case, the price may revisit the lower trendline or enter a deeper correction toward previous support areas. For now, the structure remains moderately bullish, with buyers dominating as long as the price stays above demand and respects the ascending Support Line. Please share this idea with your friends and click "Boost" 🚀

AUD/USD: Strong Support Fuels Bullish MomentumCurrently, AUD/USD is testing the strong support at 0.6465, with the price sitting at 0.64990. After touching this support level, the market could rebound strongly due to the solid consolidation trend and support from lower levels.
Technical Analysis:
The chart shows that AUD/USD is in a consolidation pattern, with strong support at 0.6465. If the price maintains above this support, AUD/USD could continue its bullish momentum, aiming for the next resistance level at 0.6540.
News Factor:
The weaker-than-expected CPI (Consumer Price Index) data in the U.S. has increased the likelihood that the Federal Reserve (Fed) will cut interest rates in December. This provides favorable conditions for risk assets like AUD/USD. The Australian Dollar benefits from the weakening USD as investors expect the Fed to reduce rates, boosting demand for the Australian Dollar.
Next Scenario:
If AUD/USD stays above the 0.6490 support level and does not drop below 0.6465, there is a high probability of breaking the 0.6540 resistance level and continuing upward.

Coca-Cola Is Attacking All-Time HighsCoca-Cola is basically one of the most famous drink brands in the world. It started in the late 1800s in the U.S., and over time it turned into a huge global company. They’re known for their classic Coke, but they also make tons of other drinks—juices, waters, teas, and even energy drinks.
After that gap up, Coca-Cola filled that gap as expected and then turned higher and broke above 71.77 resistance. So the wave structure remains bullish, and we could still see a push to new highs, as wave C — possibly the final leg of an ending diagonal — may target the 76–78 area. So latest retracement toward 68 might have been just temporary setback ideally wave two and bulls are now ready for new highs. We remain bullish as long as price stays above 66.
Highlights:
Trend: Bullish (wave C continuation in w. 5)
Support: 71, 68, 66
Resistance: 74, 78
Note: Bullish above 66, watching for wave C resumption towards new highs.

Arcus Biosciences (RCUS) — Late-Stage Immuno-Oncology MomentumCompany Overview
Arcus NYSE:RCUS is a clinical-stage biotech advancing next-gen cancer & immunology therapies, led by TIGIT inhibitor domvanalimab and HIF-2α inhibitor casdatifan—with growing validation from big-pharma partnerships.
Key Catalysts
Domvanalimab (TIGIT) — NSCLC Breakthrough: Phase 3 data showed a 37% reduction in progression risk vs. Keytruda, positioning Arcus at the front of a $50B+ immuno-oncology market.
Casdatifan (HIF-2α) — Rapid Path in RCC: Advanced to Phase 3 in renal cell carcinoma after ~80% response rates in early trials, reinforcing best-in-class potential.
De-Risking Partnerships: Collaborations with AstraZeneca and Gilead provide funding, development scale, and commercial reach across high-value solid tumor indications.
Why It Matters
✅ Multiple late-stage shots on goal in large indications
✅ Combination-ready checkpoint assets with clear differentiation
✅ Strategic partners reduce capital & execution risk
Investment Outlook
Bullish above: $17–$17.50
Target: $32–$33 — supported by Phase 3 TIGIT win, HIF-2α expansion, and partner-enabled commercialization.

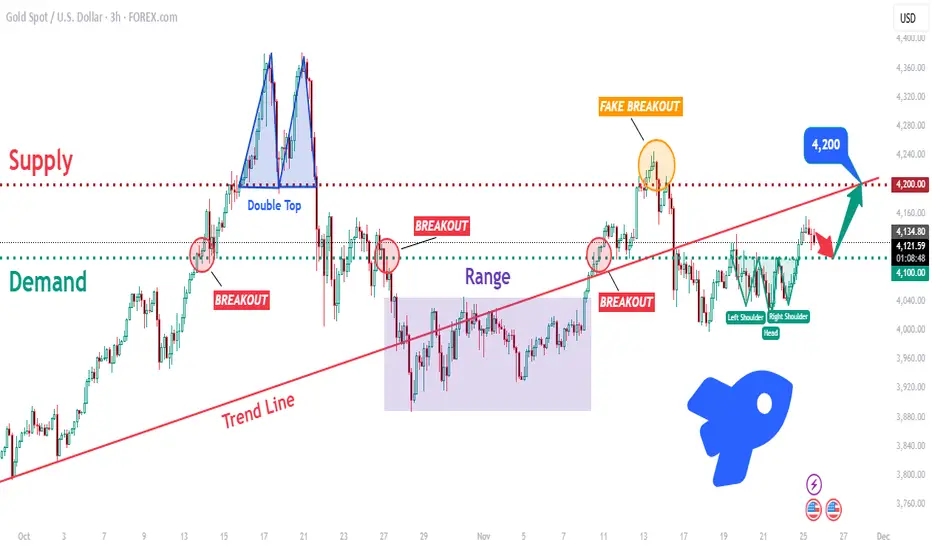
XAUUSD: Bulls Defend 4100! Is a Breakout to 4220 Imminent?Hello traders! XAUUSD continues to trade within a broader bullish structure, but with repeated volatility around key zones. The chart highlights how Gold has reacted multiple times to the major Demand Zone near 4,100, which has consistently acted as a strong support area. Each dip into this zone triggered a bullish response, confirming active buyers. Earlier in the structure, price formed a clear Double Top inside the Supply Zone around 4,220–4,230, which led to a strong bearish reversal and a breakdown below the trend line. After that, Gold entered a prolonged Range Phase, where the market consolidated sideways before breaking out to the upside. Recently, XAUUSD attempted a bullish continuation, but the move resulted in a Fake Breakout above the supply zone, signaling that buyers lacked the strength to maintain momentum above 4,220. This rejection pushed price downward and back below the main Trend Line, which now acts as dynamic resistance.
Currently, Gold is trading above the 4,100 Demand Zone, forming a potential Inverse Head and Shoulders pattern — an early sign that buyers may be preparing for another upward push. As long as price holds above 4,100 and stays above local structure, the bullish scenario remains valid.
My scenario, if XAUUSD holds above the 4,100 Demand Zone, buyers may gain momentum and attempt another breakout toward the 4,200–4,220 Supply Zone, which is the next major resistance and the primary upside target. A sustained break above 4,220 would confirm bullish strength and could open the path toward higher continuation targets. However, if buyers fail to hold the 4,100 level, Gold may drop back into the previous range or retest lower support areas before attempting another reversal. For now, the bias is moderately bullish, supported by demand reactions and reversal patterns — but a confirmed breakout above 4,200 is needed for stronger trend continuation. Manage your risk!
GBPUSD Breakout and Potential RetraceHey Traders, in today's trading session we are monitoring GBPUSD for a buying opportunity around 1.31100 zone, GBPUSD was trading in a downtrend and successfully managed to break it out. Currently is in a correction phase in which it is approaching the retrace area at 1.31100 zone.
Trade safe, Joe.

Market Mispricing? EURUSD Ready to Surge on FED PivotHey Traders,
In today’s trading session we are monitoring EURUSD for a buying opportunity around the 1.15300 zone. The pair has been trading in a clear uptrend, and is now entering a healthy correction phase, approaching a key trend support / S&R confluence at 1.15300.
Fundamentals continue to lean strongly in favor of EURUSD bulls:
Markets now expect the FED to cut rates in December, a clear bearish driver for the USD as easing expectations gain traction.
Rumors yesterday suggested that Kevin Hassett is now the top contender for the next FED Chair.
Hassett is widely viewed as the most dovish possible pick, which only deepens downside pressure on the Dollar.
With USD sentiment turning increasingly soft and price nearing a major technical support, the 1.15300 area becomes a highly strategic zone to look for bullish continuation.
Trade safe,
Joe.

DOGE Ready to Break $0.16000 – Strong Bullish Momentum Ahead!Currently, DOGE is fluctuating within a clear accumulation structure with strong support at $0.14700 and resistance near $0.16000. After testing this support zone, the price could break above the resistance, signaling the potential for a strong continuation of the bullish trend.
Reasons for the increase:
- ETF Hype & Institutional Confidence: The listing of the DOGE spot ETF on the US exchange has drawn attention from both institutional and retail investors. This could lead to a large influx of capital into DOGE, creating strong buying pressure.
- Technical Accumulation & Bullish Setup: The current price structure indicates a strong breakout potential if DOGE surpasses $0.154, with solid support levels below, such as $0.14700, which reinforces the likelihood of continued upward momentum.
- FOMO Opportunity & Market Sentiment: As a meme-coin, Dogecoin is highly sensitive to news and market "hype." When positive factors such as ETF announcements or favorable news arise, DOGE is likely to create a strong surge due to FOMO (Fear of Missing Out) sentiment.
Next scenario:
If DOGE surpasses $0.15400, it is likely to continue the bullish rally, targeting $0.16000, and possibly extend towards $0.17000. Both market factors and technical analysis suggest strong potential for further upward movement in the near term.
In summary: DOGE currently has strong upside potential thanks to ETF support and solid technical accumulation. If the market maintains a positive sentiment and DOGE breaks resistance, the bullish trend will continue.

SOL to Bottom Out Around $103-104SOLANA – Eyes on the Final Flush? 🔥 Key Confluence at $103–$104
Solana is approaching what might be the most important support zone of this entire macro structure. Several major technical factors are all pointing to the same potential bottom area:
🟢 1. Head & Shoulders Breakdown Target
The measured move from the H&S pattern puts the projected downside right into the $103–$104 zone, creating a textbook target alignment.
🟠 2. Long-Term Trendline Support (Orange)
Price is now dropping toward a multi-year rising trendline that has held since early 2024.
This line has acted as major dynamic support across multiple cycles, and SOL is now coming back to retest it.
🟣 3. Fibonacci 0.886 Retracement
The 0.886 retrace of the full macro move lands perfectly in the same area.
This fib level is often where deep retracements reverse during strong bullish expansions.
📉 Current Structure
– Breakdown from right shoulder confirmed
– Momentum still down, but seller exhaustion showing up
– Volume declining on the drop → typical late-stage correction behavior
📌 Key Zone to Watch
$103–$104 (Green Box)
This is my “high-probability reaction zone” where I expect Solana to bottom or at least produce a significant bounce.

Webull Corporation (BULL) Spike 6% Gearing for 800% Surge The price of Webull Corporation (NASDAQ: NASDAQ:BULL ) saw a noteworthy uptick of 6% today as it is gearing for 800% move should it break through the $16 resistant point.
With the RSI at 68, the stock is poised to achieve that fit amidst growing interest among investors and traders alike.
In another news, - Webull Corporation (NASDAQ: BULL) announced financial and operating results for the third quarter ended September 30, 2025.
Total revenues grew 55% year-over-year to $156.9 million, driven by user engagement and high-trading volumes
Customer assets increased 84% year-over-year, primarily due to broad-based market recovery and continued strong net deposits
Strong profitability performance while investing in geographic expansion, AI and new and enhanced product offerings
Financial Performance
In 2024, Webull's revenue was $388.97 million, an increase of 0.12% compared to the previous year's $388.50 million. Losses were -$517.78 million, 55.0% more than in 2023.
Analyst Summary
According to 2 analysts, the average rating for BULL stock is "Strong Buy." The 12-month stock price target is $16.5, which is an increase of 78.77% from the latest price.
About BULL
Webull Corporation operates as a digital investment platform. Its platform enables retail investors to trade securities through its licensed broker dealer in the United States, Canada, the United Kingdom, Australia, Hong Kong, Indonesia, Singapore, Malaysia, Thailand, Japan, South Africa, the Netherlands, and internationally. The company was founded in 2016 and is headquartered in Saint Petersburg, Florida.

XAUUSD: Buyers Aiming for a Rebound Toward $4,170 ResistanceHello everyone, here is my breakdown of the current Gold setup.
Market Analysis
XAUUSD continues to trade within a corrective structure, forming a broad Triangle Pattern defined by the Triangle Resistance Line above and the Triangle Support Line below. After a strong impulsive rally earlier, gold entered a prolonged consolidation phase, highlighted by a clear Range Zone where price repeatedly tested both the upper and lower boundaries without establishing a directional breakout. Several Breakouts occurred during this period, but each bullish attempt failed to secure continuation, leading to pullbacks that kept the market inside the broader consolidation. This showed clear indecision and a balanced battle between buyers and sellers.
Currently, gold retested the Support Zone around $4,040–$4,060, which coincides with the Triangle Support Line. A fake breakdown occurred below this level, but the market quickly bounced back, confirming strong demand and rejecting the bearish attempt. This rebound signals that buyers are actively defending the structure. Price is now stabilizing above support and showing early signs of bullish pressure. If buyers maintain control, the next logical target becomes the major Resistance Level at $4,170, which has acted as a key cap on previous bullish attempts. As long as XAUUSD stays above the Support Zone and trades within the rising trendline structure, the overall market bias remains moderately bullish.
Scenario & Strategy
I expect gold to gradually move upward from the current support area and retest the $4,170 Resistance Level. Minor corrections may occur along the way, but as long as price holds above $4,040, the bullish scenario remains valid. A clean breakout above $4,170 could trigger a stronger bullish continuation toward the next supply zone.
However, a breakdown below the Support Zone and Triangle Support Line would invalidate the bullish scenario and open the way for deeper correction. For now, buying the dips remains the more favorable approach as long as gold respects demand and stays within the triangle structure.
That's the setup I'm tracking. Thank you for your attention, and always manage your risk.

Gold Reload Zone… Bulls Waiting Patiently!📈Gold remains overall bullish, respecting both its rising structure and the major support zones beneath current price. After breaking above the light-blue resistance area, XAUUSD is now pushing higher, but a pullback remains very likely before the next impulse.
⚔️On the upcoming retest of the blue structure zone and the rising trendline, we will be looking for trend-following longs. This area has acted as support multiple times and now aligns with the bullish context, making it a high-probability buy zone.
🏹As long as Gold remains above the red demand area and respects the rising structure, the next wave upward toward the 4,385 resistance remains the most likely scenario. Only a clean break below the red zone would weaken the bullish outlook.
For now, patience is key… wait for the retest, then look for longs from structure. 🤔
⚠️ Disclaimer: This is not financial advice. Always do your own research and manage risk properly.
📚 Stick to your trading plan regarding entries, risk, and management.
Good luck! 🍀
All Strategies Are Good; If Managed Properly!
~Richard Nasr

Dianthus — Precision Complement Medicine for gMG & CIDPCompany Overview
Dianthus Therapeutics NASDAQ:DNTH is a clinical-stage biotech developing next-generation monoclonal antibodies that modulate the complement system for severe autoimmune and neuromuscular diseases. Lead asset DNTH103 uses convenient subcutaneous dosing every two weeks, aiming to disrupt the gMG and CIDP markets projected to exceed $10B by 2030.
Key Catalysts
Phase 2 Momentum in gMG: The MaGic trial showed meaningful symptom improvement, supporting advancement toward Phase 3 and reinforcing a best-in-class profile.
CIDP Expansion: Planning a potentially registrational CIDP trial, extending the neuromuscular franchise and adding a second, sizable indication.
Platform Validation: Positive data backs DNTH’s precision immunology approach; q2w SC dosing directly addresses patients’ convenience and adherence needs.
Diversified Pipeline: Additional programs in rare inflammatory disorders create a multi-catalyst path through 2026, broadening the complement footprint.
Why It Matters
✅ High-value indications with unmet needs
✅ Differentiated dosing + mechanism
✅ Clear clinical path with near/medium-term readouts
Investment Outlook
Bullish above: $35.00–$36.00
Target: $80.00–$82.00 — driven by Phase 3 readiness in gMG, CIDP registrational potential, and complement-medicine leadership.

GOLD (XAU/USD) : Strong Bullish ConfirmationGOLD is going to continue rising in an uptrend
that the pair established.
A completion of a consolidation and the formation of a new local Higher High
indicate a highly probable bullish continuation soon.
Next resistance - 4180 - 4200

EUR/CHF: Important Bullish BreakoutThe EURCHF has successfully violated a significant daily/intraday horizontal resistance level, and closed above it.
It is highly probable that this previously broken structure will now serve as a strong support.
I anticipate a subsequent upward movement and a continuation of the bullish trend towards the 0.9364 resistance level.

Bitcoin Bull TrapDo not get fooled by this trap that is underway in BTC. Trump will start QE again soon in early December which will cause BTC and stocks to rise which will either form a head and shoulders pattern or a double top. I believe this rally will fail once Inflation starts to rise rapidly and possibly cause a spike in the 10-year interest rates. I think Nvidia and the Tech stocks crash once people realize they are "cooking the books" and lying about earnings. I believe the Fed will also finally stop with-holding important economic data from the public after the Government shutdown and will really get this market down trending. Possible swing trades to the upside are possible but if you are a longer term investor and do not want to ride this wave down I definably recommend getting out and be ready to pull the trigger on an Inverse BTC ETF. After this crash plays out fortunes will be made in the next bull run.

36 COMING ??Based on tech analysis, this stock could hit 36 next year. It may retest 10 and it must hold 10, otherwise its going lower than 10, in that case I may revisit my $36 target. I would buy at 10.
Happy trading!! Not a financial advice. I may change my mind anytime and may not post any future updates.

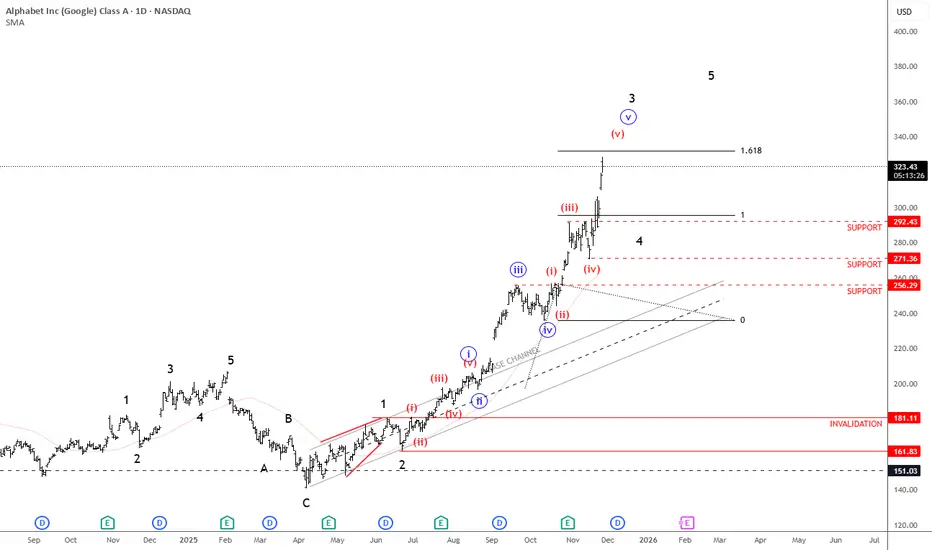
Google Is In Strong Bullish Trend; Unfolding A Five-Wave ImpulseAlphabet (Google) is a huge tech company best known for its search engine, but it also makes things like Android, YouTube, Gmail, and cloud services. Google is pushing hard into AI and cloud computing. They’re rebuilding search with AI, making stronger chips, and growing Google Cloud fast. They’re also investing in long-term tech like self-driving cars and quantum computing.
Google is in a very strong uptrend as expected, but we can now count five waves up within the black wave three cycle from around 160. Ideally, the next pullback would be wave four, stabilizing near the previous fourth-wave area around 292–271. And once or if we see that kind of correction, that's when new buying opportunities could appear, but for now, it’s better to stay cautious since we may already be in the later stages of this cycle.
Highlights:
Trend: Strong uptrend, but nearing late stages of wave three
Potential: Pullback in wave four before continuation higher
Support: 292–271 zone
Invalidation: Below 200
Note: watch for a correction before new long setups