36 COMING ??Based on tech analysis, this stock could hit 36 next year. It may retest 10 and it must hold 10, otherwise its going lower than 10, in that case I may revisit my $36 target. I would buy at 10.
Happy trading!! Not a financial advice. I may change my mind anytime and may not post any future updates.
Bullish Patterns

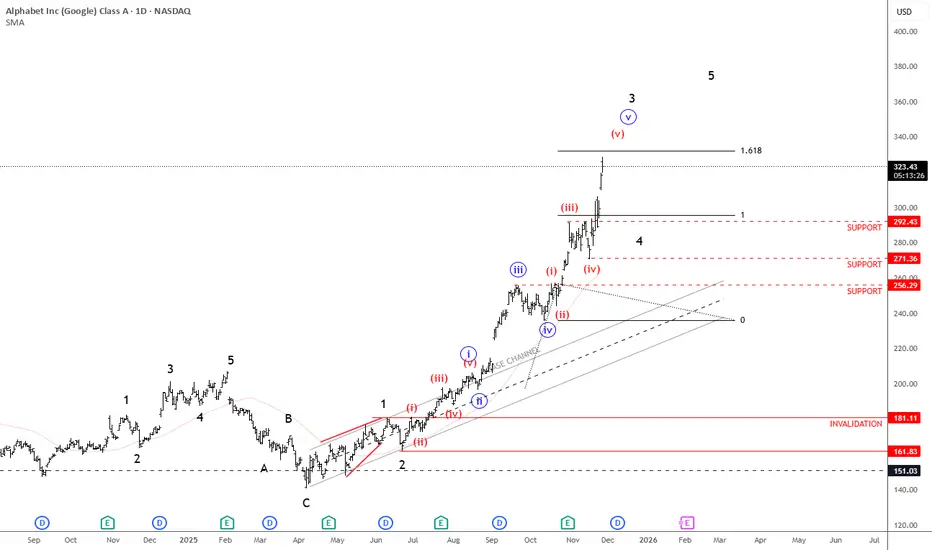
Google Is In Strong Bullish Trend; Unfolding A Five-Wave ImpulseAlphabet (Google) is a huge tech company best known for its search engine, but it also makes things like Android, YouTube, Gmail, and cloud services. Google is pushing hard into AI and cloud computing. They’re rebuilding search with AI, making stronger chips, and growing Google Cloud fast. They’re also investing in long-term tech like self-driving cars and quantum computing.
Google is in a very strong uptrend as expected, but we can now count five waves up within the black wave three cycle from around 160. Ideally, the next pullback would be wave four, stabilizing near the previous fourth-wave area around 292–271. And once or if we see that kind of correction, that's when new buying opportunities could appear, but for now, it’s better to stay cautious since we may already be in the later stages of this cycle.
Highlights:
Trend: Strong uptrend, but nearing late stages of wave three
Potential: Pullback in wave four before continuation higher
Support: 292–271 zone
Invalidation: Below 200
Note: watch for a correction before new long setups
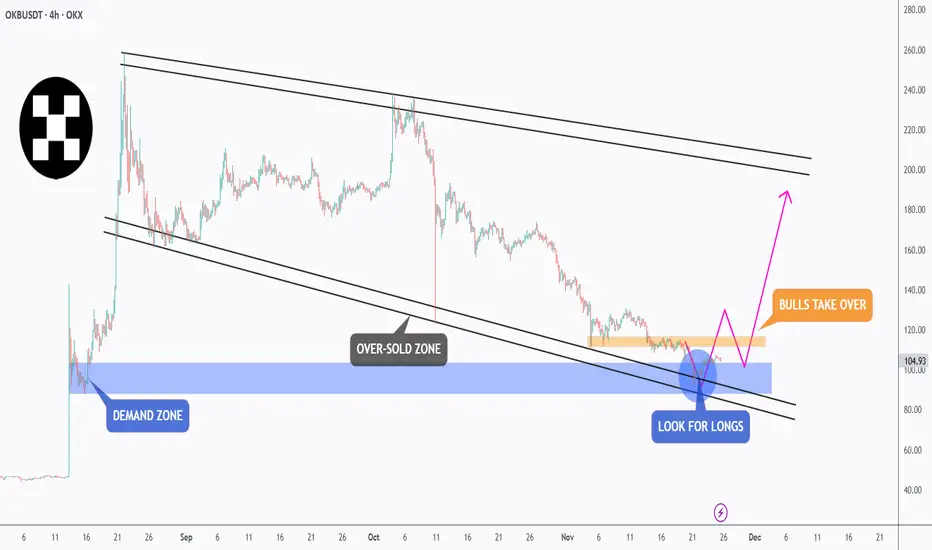
OKB - Demand Holding Strong… Correction on the Horizon?📉OKB is currently trading inside a broad falling channel , but price has just reacted from a major demand zone, which also aligns with the lower bound of the black channel. This confluence creates a strong oversold area where buyers typically step in.
⚔️As long as this demand zone continues to hold, we will be looking for bullish correction setups toward the upper bound of the falling channel. This would be the natural corrective wave after an extended sell-off.
🏹However, for the bulls to fully confirm control, price must break and hold above the orange high. A breakout above that structure would signal a shift in momentum and open the way for a larger trend reversal.
For now, demand is holding, the channel is intact, and the market is positioned for a potential rebound… will OKB deliver the correction we’re waiting for? 🤔
⚠️ Disclaimer: This is not financial advice. Always do your own research and manage risk properly.
📚 Stick to your trading plan regarding entries, risk, and management.
Good luck! 🍀
All Strategies Are Good; If Managed Properly!
~Richard Nasr
"Heads Down" With Hopes Up For EUFX:EURUSD seems to have found Support at a Weekly Low formed earlier this month.
Now, since having visited this Support, you can notice that price has begun to form a Higher Low suggesting that price action is forming a strong bullish reversal pattern, the Inverse Head and Shoulders!
If price can continue pushing higher to the Neckline once more, this will complete the reversal pattern.
Once the pattern is complete, we will want to wait for a Breakout and Retest to generate potential long opportunities to take the price up to test the overhead resistance levels.

GBPUSD Breakout and Potential RetraceHey Traders, in today's trading session we are monitoring GBPUSD for a buying opportunity around 1.30900 zone, GBPUSD was trading in a downtrend and successfully managed to break it out. Currently is in a correction phase in which it is approaching the retrace area at 1.30900 support and resistance area.
Trade safe, Joe.

Gold Breakout and Potential RetraceHey Traders, in today's trading session we are monitoring XAUUSD for a buying opportunity around 4,080 zone, Gold was trading in a downtrend and successfully managed to break it out. Currently is in a correction phase in which it is approaching the retrace area at 4,080 support and resistance area.
Trade safe, Joe.

Daqo New Energy (DQ) — Polysilicon Scale for the Solar SupercyclCompany Overview
Daqo NYSE:DQ is a top global producer of high-purity polysilicon, giving direct exposure to the accelerating shift toward solar and renewables.
Key Catalysts
Solar Demand Inflection: Global PV installs projected to exceed 1 TW annually by 2030, positioning Daqo’s large-scale, high-efficiency capacity to capture structural growth.
Resilient Operations: Q2’25 showed improving cost structure and margin stabilization as polysilicon prices recover—highlighting cost discipline in a cyclical market.
Vertical Expansion: Entry into wafer production deepens integration, captures more value, and reduces raw-material risk—appealing to buyers seeking reliable end-to-end partners.
Clean-Energy Leverage: As policy and corporate decarbonization accelerate, Daqo remains a core supplier to the PV supply chain.
Investment Outlook
Bullish above: $27.00–$28.00
Target: $50.00–$52.00 — supported by scale, cost leadership, and vertical integration amid a multi-year solar upcycle.

SMCI - Bull Flag Breakout SetupSMCI formed a strong bullish impulse followed by a bull flag pattern.
A breakout above the flag structure may signal continuation if confirmed with strong price action.
Trade Plan:
• Entry: On breakout or retest
• Stop Loss: Below flag support
• TP1: Recent high
• TP2: Measured flagpole extension
This setup is worth monitoring for potential bullish continuation.
Disclaimer: This is not financial advice. For educational purposes only.

Ripple Is Still Bullish Despite Recent Spike LowerRipple is still bullish despite the recent spike lower, which can act as a strong support from a technical and Elliott wave perspective.
Ripple is a blockchain-based digital payment protocol designed for fast, low-cost international money transfers. Its native cryptocurrency, XRP, helps facilitate transactions between different currencies, making cross-border payments quicker and cheaper compared to traditional systems like SWIFT.
Ripple sold-off recently and it made a huge spike lower due to the market manipulation, but these spikes usually act as a strong support. It still looks like a complex W-X-Y correction in wave IV on a daily chart, which can now resume the bullish trend within final wave V of (V).
In the 4-hour chart, we can see a massive spike down, but out of wave (B) triangle pattern, so it’s a penultimate move into wave (C) of Y. With the current strong rebound and recovery, seems like bulls are back in the game, and it looks to be forming a bullish setup with waves 1 and 2. So watch out for further rally within wave 3 of a five-wave bullish cycle, especially if jumps back into 2.7 area and later above 3.10 bullish confirmation level.

EURGBP Potential UpsidesHey Traders, in today's trading session we are monitoring EURGBP for a buying opportunity around 0.87800 zone, EURGBP is trading in an uptrend and currently is in a correction phase in which it is approaching the trend at 0.87800 support and resistance area.
Trade safe, Joe.

XAUUSD Ascending Channel Strengthens: Bulls Target $4,130 TP1Hello traders! I want to share my view on the current XAUUSD setup. After a deep corrective move, gold has formed a local bottom around the Support Level at $4,000–$4,030, where strong buying pressure has re-entered the market. As shown on the chart, price is gradually climbing within a well-defined ascending channel, supported by the rising trendline and a parallel upper boundary. Inside this structure, the Buyer Zone has played a crucial role, providing the base for previous impulsive breakouts. Several fake breakdowns below the channel support confirmed the presence of significant demand. After these rebounds, XAUUSD twice reached the Seller Zone and the Resistance Level near $4,130, where it faced clear rejection and rotated back toward the Buyer Zone. Currently, gold is holding above the ascending channel support. If buyers continue to defend the $4,030 level and price remains stable within the Buyer Zone, I expect a move toward TP1 → $4,130, which is the nearest resistance. A clean breakout above this level would open the door for further bullish continuation toward the upper supply area around $4,200–$4,230. However, if the price breaks below the Buyer Zone and drops out of the channel, the bullish scenario becomes invalid, and the market may revisit the $4,000 support area. For now, the structure remains moderately bullish as long as price holds above demand and stays inside the ascending channel. Please share this idea with your friends and click Boost 🚀

EUR/JPY BULLS ARE STRONG HERE|LONG
Hello, Friends!
It makes sense for us to go long on EUR/JPY right now from the support line below with the target of 180.945 because of the confluence of the two strong factors which are the general uptrend on the previous 1W candle and the oversold situation on the lower TF determined by it’s proximity to the lower BB band.
Disclosure: I am part of Trade Nation's Influencer program and receive a monthly fee for using their TradingView charts in my analysis.
✅LIKE AND COMMENT MY IDEAS✅

GOLD (XAU/USD): Bullish Sentiment ConfirmedGold is currently exhibiting a bullish trend.
Following the establishment of a new higher high, the pair retraced to a rising trend line.
Upon testing this trend line, the market formed a double bottom formation and subsequently violated its neckline.
It is anticipated that buyers will continue to drive the pair upward.
The target is 4,200.

Get Ready for a Strong Recovery on Theta in the Near Future! I believe Theta will see a strong recovery very soon based on this ABC correction, the same pattern BCH experienced. This will lead to a sharp recovery and a strong bullish move in the near future. It could be very profitable and mark the beginning of a massive run for this coin in the bigger picture. Theta is heavily undervalued and ready for big things.
As always, stay profitable.
– Dalin Anderson

Algorand ALGO USDT Upcoming TAKE PROFIT POINTSHi Traders, Investors and Speculators of Charts📈📉
New Year 2026 loading....🥂🥳
Algorand is a decentralized network built to solve the Blockchain Trilemma of achieving speed, security, and decentralization simultaneously.
Algorand is designed to be a payments-focused network with rapid transactions and a strong focus on achieving near-instant finality which aims to be processing over 1,000 transactions per second (TPS) and achieving transaction finality in less than five seconds.
As a public smart contract blockchain that relies on staking, Algorand is also capable of hosting decentralized application (dApp) development and providing scalability. Rising gas fees on Ethereum have led many dApp developers and decentralized finance (DeFi) traders to look for alternative blockchain solutions. Algorand is capable of managing the high-throughput requirements of widespread global usage and a variety of use cases.
Technical Chart Analysis:
Algorand is still "in prison", but holding the 50d Moving Averages is the first step towards a new bullish cycle. Look at all of this upside potential!
Technical indicator Analysis:
If ALGO can get back ABOVE the 50d moving averages (0,18), that is when we can expect to see some serious bullish/parabolic price action.
You don't have to wait until then to trade algo. In the daily timeframe, there are some great setups for those who have a bit of patience, with low buy and high sells from 15% - 30% over a few weeks (in both shorts and longs).
Tis market is still moving, even though it doesn't neccesarily seem like it from a macro outlook.

24/11/25 Weekly OutlookLast weeks high: $96,057.33
Last weeks low: $93,034.53
Midpoint: $80,642.73
Has Bitcoin found its low, or is there more downside to come?
After yet another brutal week of downtrend BTC tags $80,000 before bouncing back towards the weekly range midpoint at $88,000, a +10% bounce. It's important to note that back in April during the Tariff War sell-off, the $80,000 area was the origin of the subsequent move up to $110,000. So historically this area should provide support when retested as it has initially.
What this does mean to me, the high time frame trend has shifted from bullish with areas of choppy rangebound consolidation before the next leg up, to now a new lower high ($108,000 rejection) which confirmed the 1d 200 EMA as resistance, and much lower low ($80,000 last weeks low) which confirms a bearish flip.
For me this week it's about finding out if the bottom is already in or if not, where will it be? In terms of bullish target should the bottom already be in, it's the $98,000-$100,000 area. This key s/r level has been an important battleground since December '24, it's a big even level too so psychologically important, and the origin of this 20% sell-off. Fear & Greed Index currently sits at 19 but hit as low as 11 over the weekend, the lowest so far this bull run. These factors have me leaning towards the local bottom is in.
However, if the bottom is not in then $74,000 comes into play, the Tariff war low. That would complete a full retrace of this years move up to $126,000 (-40% from high). The current weekly low sits at -36% move which is the largest of the bull run so far but not uncommon in previous cycles.
Good luck this week everybody!

USD/CHF BULLS ARE GAINING STRENGTH|LONG
Hello, Friends!
USD/CHF is trending up which is clear from the green colour of the previous weekly candle. However, the price has locally plunged into the oversold territory. Which can be told from its proximity to the BB lower band. Which presents a classical trend following opportunity for a long trade from the support line below towards the supply level of 0.806.
Disclosure: I am part of Trade Nation's Influencer program and receive a monthly fee for using their TradingView charts in my analysis.
✅LIKE AND COMMENT MY IDEAS✅

BITCOIN BULLISH BIAS RIGHT NOW| LONG
BITCOIN SIGNAL
Trade Direction: long
Entry Level: 84,546.32
Target Level: 101,066.22
Stop Loss: 73,559.02
RISK PROFILE
Risk level: medium
Suggested risk: 1%
Timeframe: 1D
Disclosure: I am part of Trade Nation's Influencer program and receive a monthly fee for using their TradingView charts in my analysis.
✅LIKE AND COMMENT MY IDEAS✅

BUY GOLDGood day to everyone, in todays TRAP Friday we are monitoring GOLD for buys. Our entry is at 4037.33 and stops below 4012. Target 4093. Use proper risk management.

Potential Downside Short-term - Long Term EntriesCOINBASE:BTCUSD has broken below the ascending channel that has held for several months, indicating a possible shift in momentum from bullish to bearish. BITSTAMP:BTCUSD is overbought on the RSI and broke below it's 200-day EMA as well. I'll certainly be adding to my long-term position on the way down and will likely grab a long position at some point- will post an update then. Until then, some RSI-based supply and demand zones to keep an eye on, watching closely

BTCUSDT – Blue Box Reversal IncomingHi fellow traders,
On the 1D BTCUSDT chart, I am applying Elliott Wave principles to outline a potential long setup. Price has tapped into the blue box after completing a ZIGZAG correction, and this region may provide the foundation for the next impulsive leg within the higher-degree structure.
I am entering at the current price, with a Stop Loss at 73,900.00. My Take Profit is set at 132,366.25, based on the projected continuation of the larger impulsive count.
If price breaks below the structural low around the stop level, this trade is no longer valid.
Good luck and trade safe!

EURGBP Potential UpsidesHey Traders, in today's trading session we are monitoring EURGBP for a buying opportunity around 0.88000 zone, EURGBP is trading in an uptrend and currently is in a correction phase in which it is approaching the trend at 0.88000 support and resistance area.
Trade safe, Joe.

HBAR | Retraced into Key Support Zone – Long Spot SetupHBAR has pulled back into a major support zone at $0.13–$0.14, which has historically acted as a strong demand area. This presents a potential long spot opportunity for traders watching for a bounce or trend continuation.
🟢 Trade Idea
Entry Zone: $0.13 – $0.14
Take Profit 1: $0.19 – $0.21
Take Profit 2: $0.25 – $0.29
Stop Loss: $0.12
🔁 The plan is to ladder in through the support zone and scale out at the outlined targets, aligning with previous resistance levels. A clean break below $0.12 would invalidate the setup and suggest reevaluating the trend.
📌 Watching price action and volume closely in this zone. Always use proper risk management and size positions accordingly.
