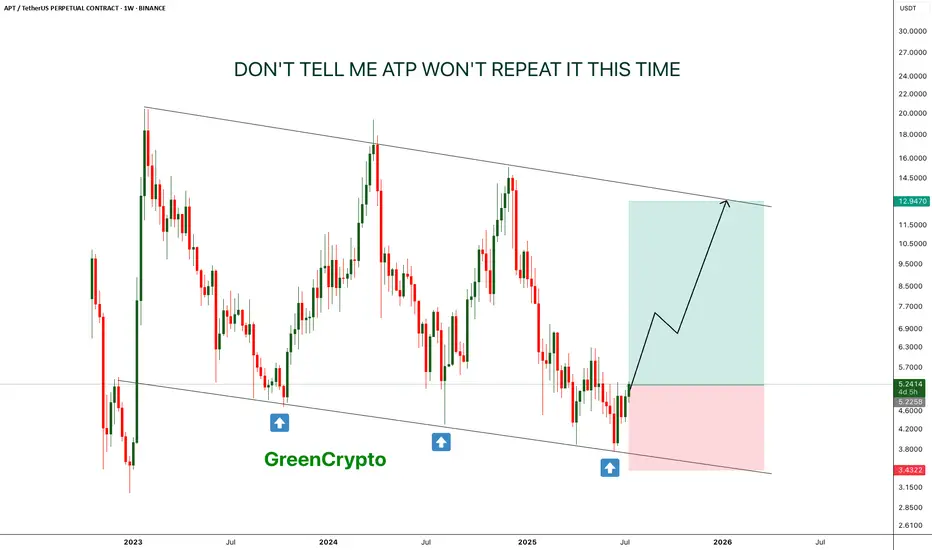
APT - Don't tell me this pattern won't repeat- This time is the charm, APT is is reversing from lower low on weekly chart.
- just like last two time, it is expect to forma new HL.
- there is a high chance that previous two patterns will repeat again
Entry Price: 5.22
Stop Loss: 3.4
TP1: 6.6632
TP2: 8.5059
TP3: 12.6945
Max Leverage: 5x
Don't forget to keep stoploss
Cheers
GreenCrypto
Bullish Patterns
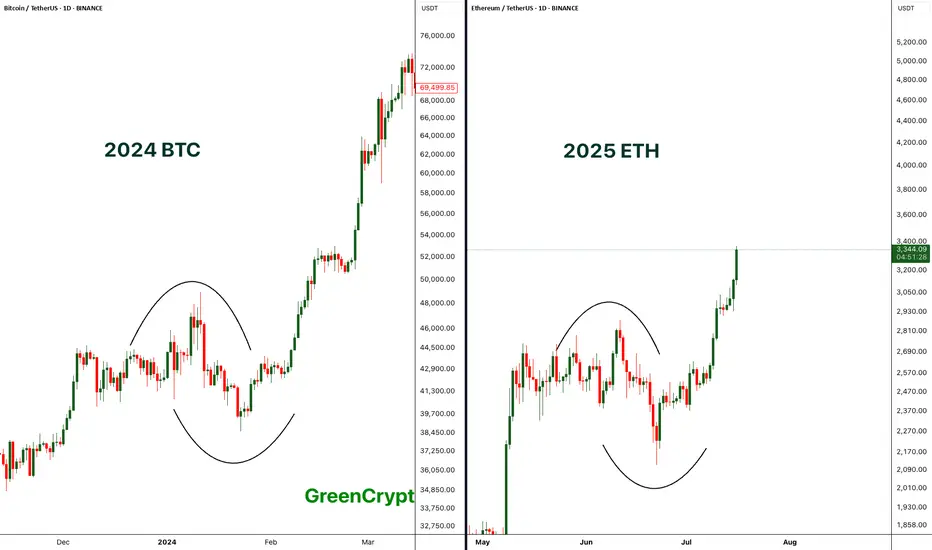
Comparing BTC 2024 with ETH 2025 - Perfect Match- If compare the chart pattern of BTC from 2024 with the current 2025 ETH pattern, wee see exactly similar chart patterns being formed here.
- Price started consolidating then it had fake breakout towards both the sides and finally the real breakout.
- BTC breakout push the price towards the new all time high above 69K, if we ETH follows similar trend then we can expect new all time high on ETH.
Let's see how it plays out.
Stay tuned for more updates.
Cheers
GreenCrypto
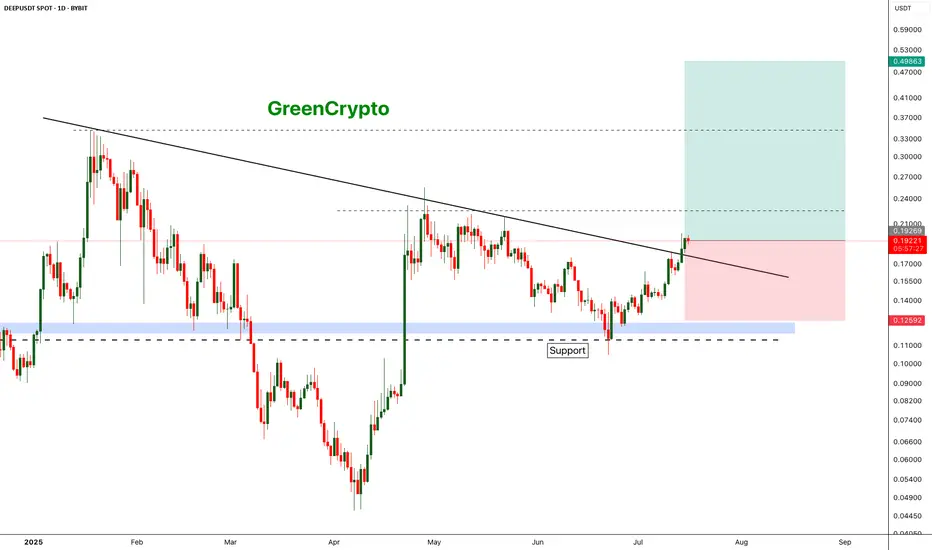
DEEP is deep Bullish DEEP has broken out from the resistance trend line and headed towards the next resistance around 0.22
We have good opportunity for a long trade here
Entry Price: 0.19219
Stop Loss: 0.12592
TP1: 0.22558
TP2: 0.27615
TP3: 0.34703
TP4: 0.49342
Don't forget to keep stop loss
Cheers
GreenCrypto
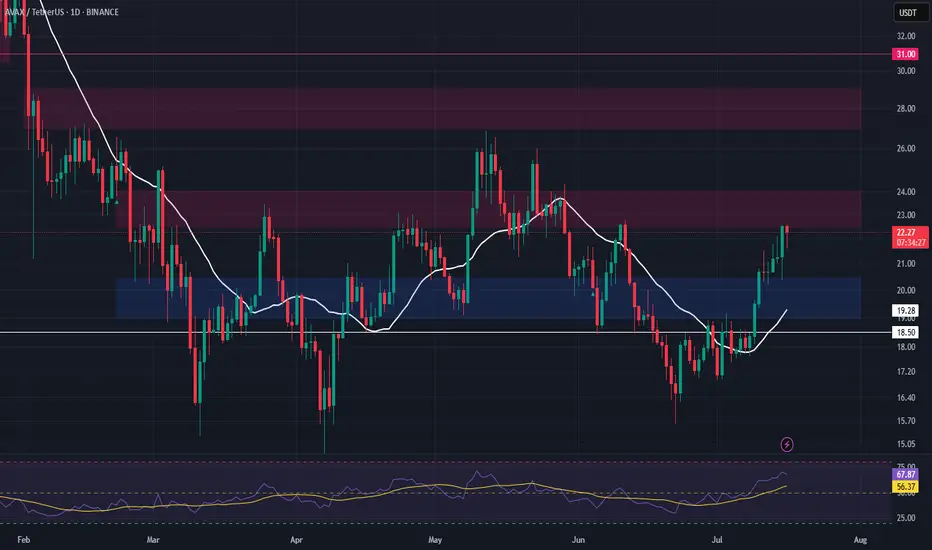
AVAX – Watching for Support Retest After Resistance TestAVAX is currently testing a major resistance level, and we’re anticipating a potential retrace into support. The $19.00–$20.45 zone offers a strong area to enter a long swing position on confirmation of the retest.
📌 Trade Setup:
• Entry Zone: $19.00 – $20.45
• Take Profit Targets:
o 🥇 $22.50 – $24.00
o 🥈 $27.00 – $30.00
• Stop Loss: Daily close below $18.50
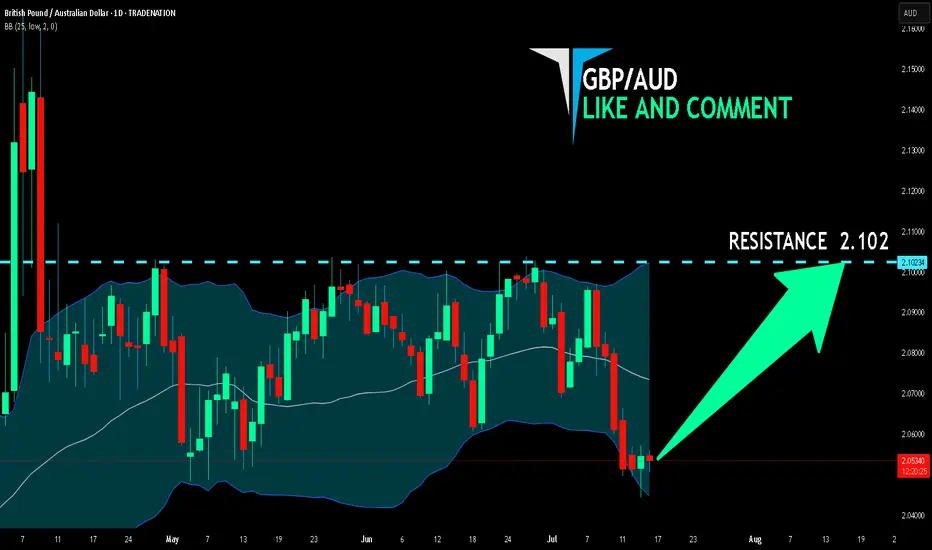
GBP/AUD BULLS ARE STRONG HERE|LONG
Hello, Friends!
Previous week’s red candle means that for us the GBP/AUD pair is in the downtrend. And the current movement leg was also down but the support line will be hit soon and lower BB band proximity will signal an oversold condition so we will go for a counter-trend long trade with the target being at 2.102.
Disclosure: I am part of Trade Nation's Influencer program and receive a monthly fee for using their TradingView charts in my analysis.
✅LIKE AND COMMENT MY IDEAS✅
eth buy longterm"🌟 Welcome to Golden Candle! 🌟
We're a team of 📈 passionate traders 📉 who love sharing our 🔍 technical analysis insights 🔎 with the TradingView community. 🌎
Our goal is to provide 💡 valuable perspectives 💡 on market trends and patterns, but 🚫 please note that our analyses are not intended as buy or sell recommendations. 🚫
Instead, they reflect our own 💭 personal attitudes and thoughts. 💭
Follow along and 📚 learn 📚 from our analyses! 📊💡"

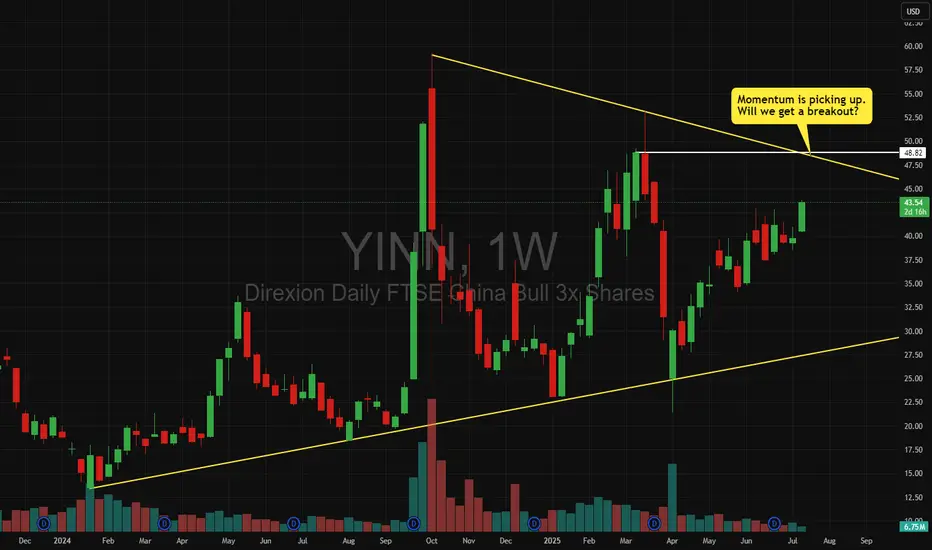
YINN - We could get a bullish breakout of the triangleMomentum seems to be picking up.
Will we a break out of the triangle?
Let's watch the $48 level.
COTI - Crazy Breakout Soooooon- COTI is trading inside the falling wedge pattern
- Price is currently nearing the resistance trendline,
- A clear breakout of this trendline will push the price higher
- we will enter a long trade after the breakout
Entry Price: 0.06696
Stop Loss: 0.03793
TP1: 0.07746
TP2: 0.10366
TP3: 0.14599
TP4: 0.25150
Don't forget to keep stoploss
Cheers
GreenCrypto

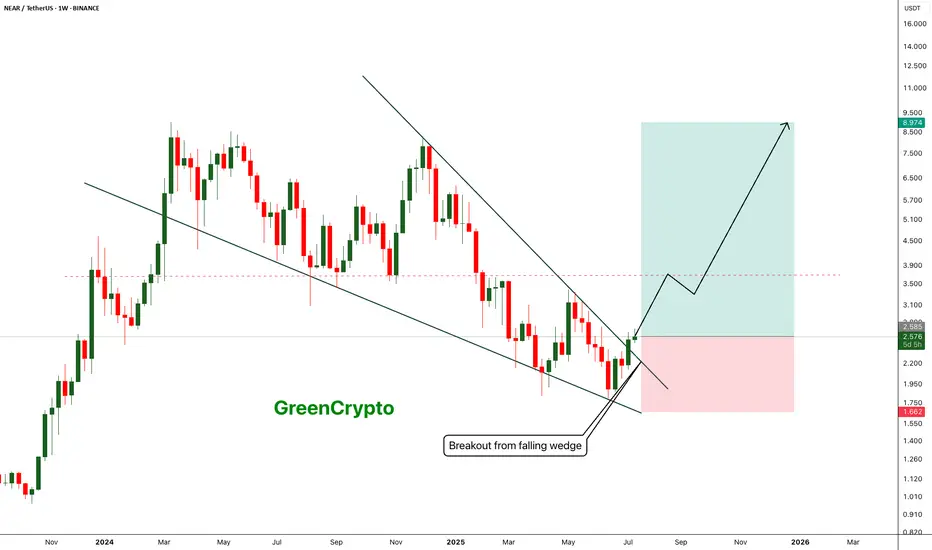
NEAR - Breakout from falling wedge pattern- Near has successfully broken out from the falling wedge pattern and now heading towards the next minor resistance around 3.6 range
- breakout from the minor resistance should push price towards the 9$ range
Entry Price: 2.57
Stop Loss: 1.66
TP1:2.935
TP2: 3.256
TP3: 3.986
TP4: 5.461
TP5: 7.102
TP6: 8.948
Stay tuned for more updates.
Cheers
GreenCrypto
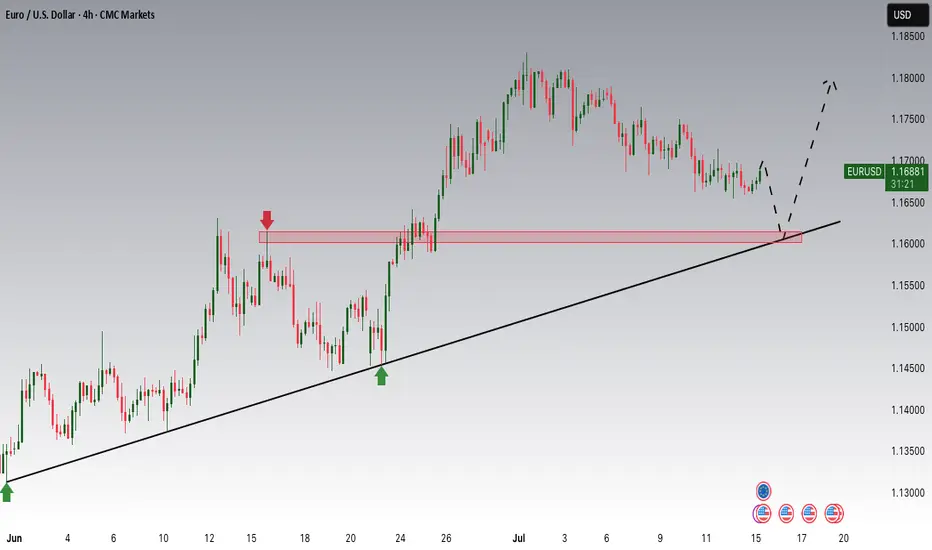
EURUSD: Consolidation Phase Nearing the Main Trend!!Hey Traders, in today's trading session we are monitoring EURUSD for a buying opportunity around 1.16100 zone, EURUSD is trading in an uptrend and currently is in a correction phase in which it is approaching the trend at 1.16100 support and resistance area.
Trade safe, Joe.
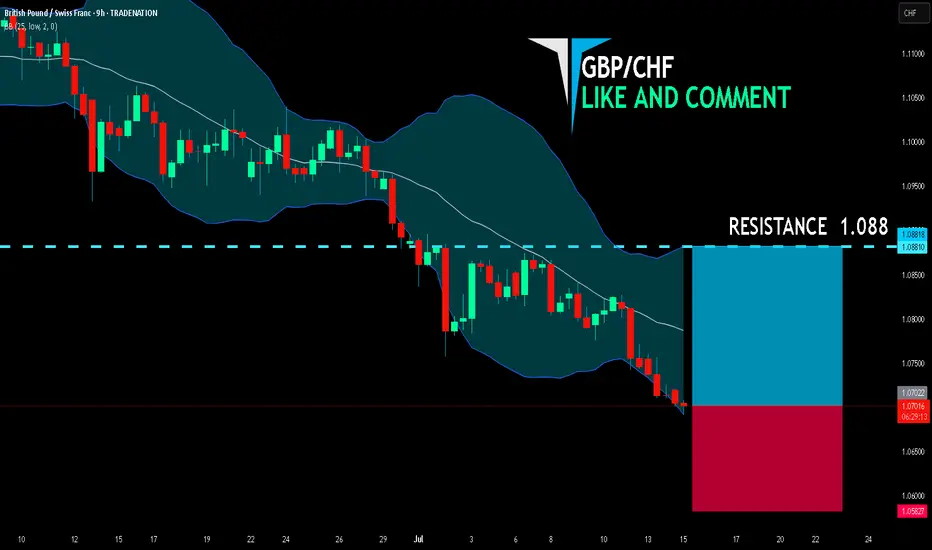
GBP/CHF BULLS WILL DOMINATE THE MARKET|LONG
GBP/CHF SIGNAL
Trade Direction: long
Entry Level: 1.070
Target Level: 1.088
Stop Loss: 1.058
RISK PROFILE
Risk level: medium
Suggested risk: 1%
Timeframe: 9h
Disclosure: I am part of Trade Nation's Influencer program and receive a monthly fee for using their TradingView charts in my analysis.
✅LIKE AND COMMENT MY IDEAS✅
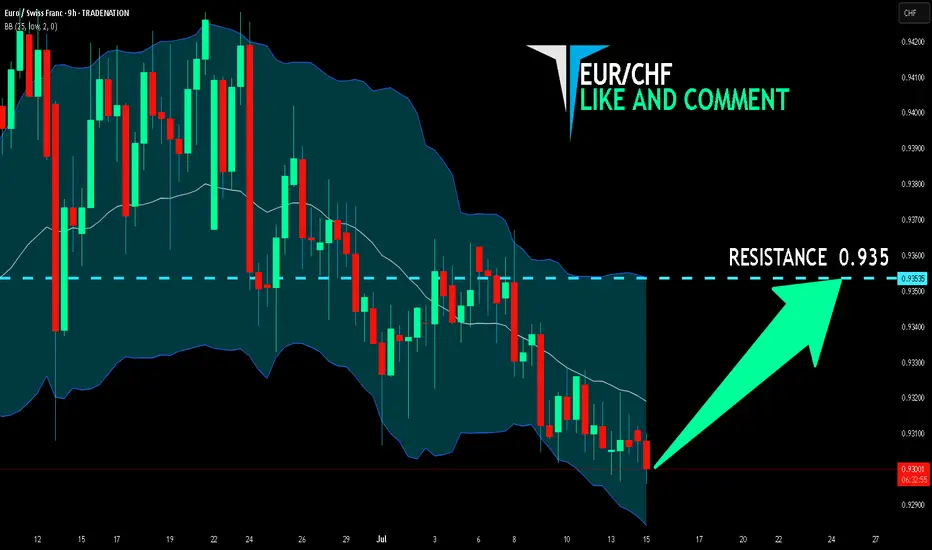
EUR/CHF SENDS CLEAR BULLISH SIGNALS|LONG
Hello, Friends!
EUR-CHF downtrend evident from the last 1W red candle makes longs trades more risky, but the current set-up targeting 0.935 area still presents a good opportunity for us to buy the pair because the support line is nearby and the BB lower band is close which indicates the oversold state of the EUR/CHF pair.
Disclosure: I am part of Trade Nation's Influencer program and receive a monthly fee for using their TradingView charts in my analysis.
✅LIKE AND COMMENT MY IDEAS✅
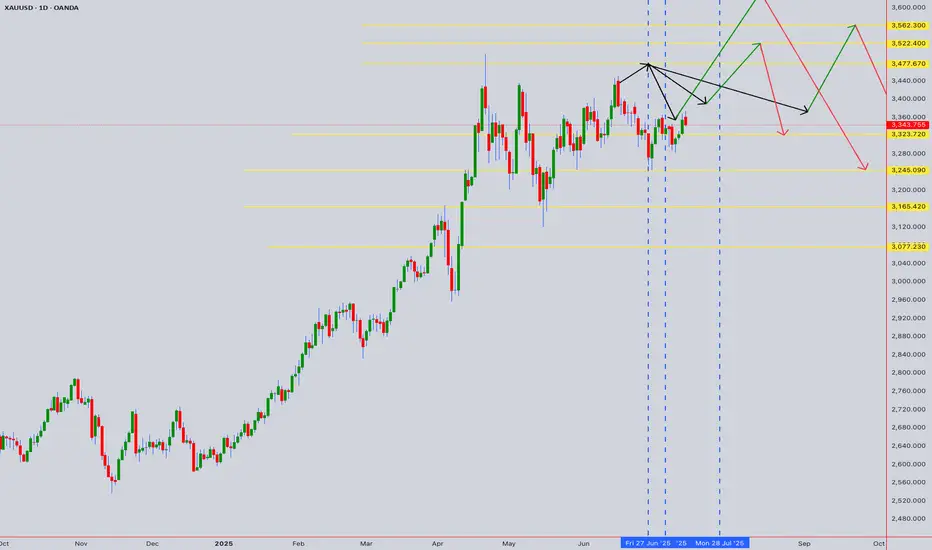
XAUUSD 1440M forecast Based on the latest available information for July 15, 2025, the overall sentiment for XAUUSD (Gold) in the next 24 hours leans towards a bullish outlook, though with potential for short-term fluctuations and pullbacks.
Key Drivers for Bullish Outlook:
Escalating Trade Tensions: US President Donald Trump's ongoing tariff and trade policies are a significant factor. New tariffs and threats against various countries (EU, Mexico, Japan, South Korea, Brazil, Canada) are creating global economic uncertainty, which typically boosts gold's appeal as a safe-haven asset.
Geopolitical Uncertainty: Broader geopolitical risks, including those related to Russia and Ukraine, also contribute to safe-haven demand for gold.
Inflation Concerns: Tariffs are linked to inflation concerns. Gold performs strongly in a high-inflation environment, and market expectations are shifting towards a more gradual easing of interest rates by the Fed, allowing for inflation to be a potential driver.
Central Bank Demand: Central banks globally, particularly the US and China, continue to be strong buyers of gold, indicating a sustained structural trend of higher gold purchases.
Technical Support: Several analyses point to gold finding support at key levels (e.g., around $3340-3345, 200 EMA), suggesting potential for bounces and continuation of an upward trend.
"Buy on Dip" Strategy: Many analysts are recommending a "buy on dip" strategy, indicating an underlying bullish bias and viewing any short-term declines as buying opportunities.
Factors to Watch (Potential for Pullbacks/Volatility):
Short-Term Weakness/Consolidation: Some technical indicators suggest short-term weakness or consolidation, with gold testing resistance levels (e.g., $3375-3380, $3400).
US Dollar Strength: While trade tensions can weaken the dollar, there are mixed signals. A stronger US dollar can put downward pressure on gold prices as it makes gold more expensive for holders of other currencies.
Inflation Data and Fed Signals: Investors are closely watching US inflation data (CPI) and signals from Federal Reserve officials regarding interest rate cuts. While some expect cuts later in the year, any hawkish surprises could temper gold's rise.
Trade Deal Hopes: Any signs of de-escalation in trade tensions or progress towards agreements could temporarily reduce safe-haven demand for gold.
Specific Price Levels Mentioned:
Resistance: $3375-3380, $3400, $3432, $3450-3470, $3500 (all-time high).
Support: $3340-3345, $3325-3330, $3289-3303, $3240-3246.
In summary, the prevailing sentiment for XAUUSD over the next 24 hours appears to be bullish, driven by ongoing global trade tensions and safe-haven demand. However, be prepared for potential short-term pullbacks or consolidation as the market digests new information and tests key resistance levels.
For those interested in further developing their trading skills based on these types of analyses, consider exploring the mentoring program offered by Shunya Trade.
I welcome your feedback on this analysis, as it will inform and enhance my future work.
Regards,
Shunya Trade
⚠️ Disclaimer: This post is educational content and does not constitute investment advice, financial advice, or trading recommendations. The views expressed here are based on technical analysis and are shared solely for informational purposes. The stock market is subject to risks, including capital loss, and readers should exercise due diligence before investing. We do not take responsibility for decisions made based on this content. Consult a certified financial advisor for personalized guidance.
ETH - Confirmed target is 4100- After successfully breakout from the major resistance price is heading towards the next resistance line.
- From the previous all time high, we have a clear resistance around 4100 range.
- We can expect this bullish trend to continue easily and reach the next resistance around 4100.
Stay tuned for more updates
Cheers
GreenCrypto

ADA - Beginning of something crazy- ADA is looking forward to the successfully breakout of the trendline resistance.
- A clean breakout from this resistance must to fuel the bullish trend.
- I'm expecting a target of 3$ from this trend.
Entry Price: 0.72
Stop Loss: 0.4838
TP1: 0.8602
TP2: 1.0342
TP3: 1.3379
TP4: 2.0144
TP5: 2.4818
TP6: 3.0329
Stay tuned for more updates
Cheers
GreenCrypto

WALUSDT - Change in the trend and let's capture itWAL is currently showing a change in the trend, after a continous downtrend finally we are seeing change in the trend.
Price has held the support strongly and now we are seeing the reversal.
We have decent trade opportunity here.
Entry Price: 0.4319
StopLoss: 0.3500
TP1: 0.4828
TP2: 0.5292
TP3: 0.6374
TP4: 0.7817
Cheers
GreenCrypto

SPX - Next Target is 7000- SPX is currently trading around 6200 after breakout previous all time high.
- Price has formed a nice broadening wedge pattern and currently heading towards the next resistance line.
- We can expect a slight correction upt o 6100, and reversal towards 7000.
- I'm expecting SPX to hit 7000 target by Q1 of 2026.
Trade Opportunity
Entry: 6200
TP1: 6400
TP2: 6600
TP3: 6800
TP4: 7000
SL at: 6057
Stay tuned frequent updates
Cheers
GreenCrypto

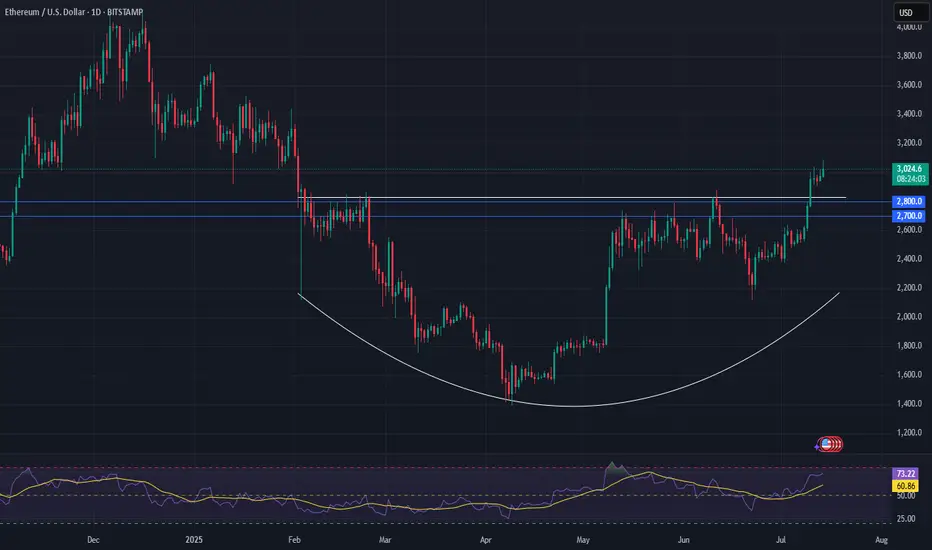
Ethereum Set for a Major Move — Watch $2,700–$2,800Epic Base Forming:
Ethereum is building a powerful base, and the fundamental dynamics have shifted significantly in recent weeks. With ETF fund flows hitting new highs, institutional interest is clearly growing.
Tight Setup for a Short Squeeze:
Meanwhile, the futures market shows a near-record short position, creating a high-potential setup for a massive short squeeze. Even without the chart, this kind of positioning mismatch is rare—and explosive.
Technical Watch Zone:
Ethereum is pressing into key resistance from a rounding bottom. The critical level to watch is $2,700–$2,800. A clean breakout here could ignite a sharp rally, with $4,000+ back on the table in short order.
This is a textbook setup—fundamentals, sentiment, and technicals are aligning.
#Ethereum #ETH #Crypto #TechnicalAnalysis #ShortSqueeze #ETFFlows #MarketSetup #Bullish #Altcoins #CryptoTrading #WatchList
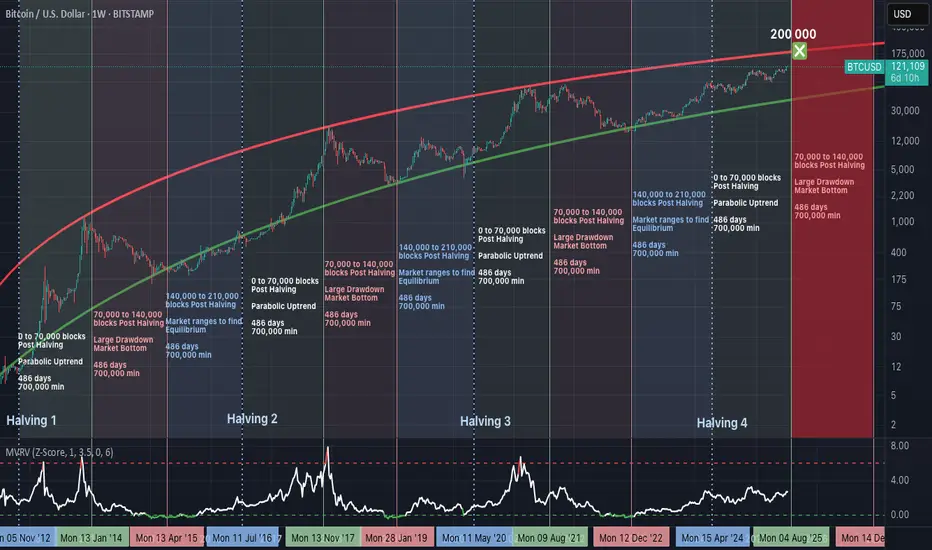
Bitcoin’s 486-Day Halving Blueprint: The $200,000 Blowoff?Summary
Bitcoin’s price consistently follows a 3-phase structure after each halving, with ~486 days per phase. If history repeats, we are nearing the end of the parabolic phase, with a potential peak around $200,000, before entering a structured drawdown.
Halving Cycles: The Real Clock Behind Bitcoin
Bitcoin’s monetary policy is pre-programmed.
A halving occurs approximately every 210,000 blocks (~4 years), and market behaviour after each halving follows this repeating pattern:
Phase 1: Parabolic Rally (0 to 70,000 blocks post-halving).
Phase 2: Major Drawdown (70,000 to 140,000 blocks).
Phase 3: Equilibrium Phase (140,000 to 210,000 blocks).
Each phase lasts approximately 486 days, and this structure has repeated reliably since 2012.
Phase 1: The Parabolic Rally (Current Phase)
We are currently in the growth segment of the cycle:
Price rising rapidly.
Miner profitability at highs.
Hashrate and network security increasing.
MVRV Z-Score steadily climbing, but not yet overextended.
Roughly 700,000 BTC are mined during this period, creating a supply shock as issuance is halved while demand accelerates.
Phase 2: The Drawdown (Expected Next)
Historically begins between block 70,000 to 140,000 post-halving.
Market peaks and begins to correct.
Miner margins compress.
Hashrate may plateau or decline.
Forced selling and miner capitulation drive volatility.
Price retraces significantly from the peak.
This phase resets the market and eliminates unsustainable excess.
Phase 3: The Equilibrium Phase
Occurs between block 140,000 to 210,000 post-halving.
Price enters consolidation.
Realized value and market price converge.
Ideal accumulation period for long-term investors.
Network fundamentals stabilize ahead of the next halving.
This phase is critical in building the base for the next cycle.
MVRV Z-Score: Market Thermometer
The chart includes the MVRV Z-Score, a key metric showing how far price deviates from realized value:
Readings above 6.0 have consistently marked cycle tops.
Readings near or below 0 have marked major bottoms.
Current value is around 2.67 — indicating a rising trend, but not overheated.
This metric reflects market-wide profitability and speculative pressure.
Why $200,000 Is in Sight
The projected resistance curve on the chart suggests that:
$200,000 aligns with the top of the long-term parabolic channel.
It corresponds with the expected end of the parabolic phase (Q1–Q2 2026).
It fits prior extension patterns following each halving.
It is a strong psychological target, likely to trigger heavy profit-taking.
This price level is not arbitrary—it is derived from the same structure that defined previous peaks.
What Comes After
If the historical cycle structure remains intact:
The peak should occur before mid-2026.
A deep correction phase follows, likely into 2027.
True bottoms tend to occur as miner capitulation concludes and difficulty adjusts downward.
This is where conviction and preparation matter most.
Final Thoughts
Bitcoin cycles are not random. They are structured around block height, issuance, and miner economics.
Every cycle since 2012 has followed this 486-day framework, divided across parabola, crash, and reset. This model has outperformed calendar-based predictions and technical narratives.
Disclaimer
This content is for educational and informational purposes only and does not constitute financial, investment, or trading advice. Past performance is not indicative of future results. Always do your own research and consult with a qualified financial advisor before making investment decisions. The author holds no responsibility for any losses incurred as a result of using the information presented herein.
BTC Massive SetupConsolidation for months between 91k and 106k
- Classic Wyckoff setup as an accumulation/distribution
- Price targets of: 121.878 (122k is the popular target) to the upside with 75,827 on the down
- Saylor today put out news to be raising another $2 billion to buy BTC. Either he is going to be able to hold the floor or get washed out
- Trade can be taken with confirmation of breakout on either side pretty easily as momentum will be so strong that being on the wrong side will most likely be an immediate stop out

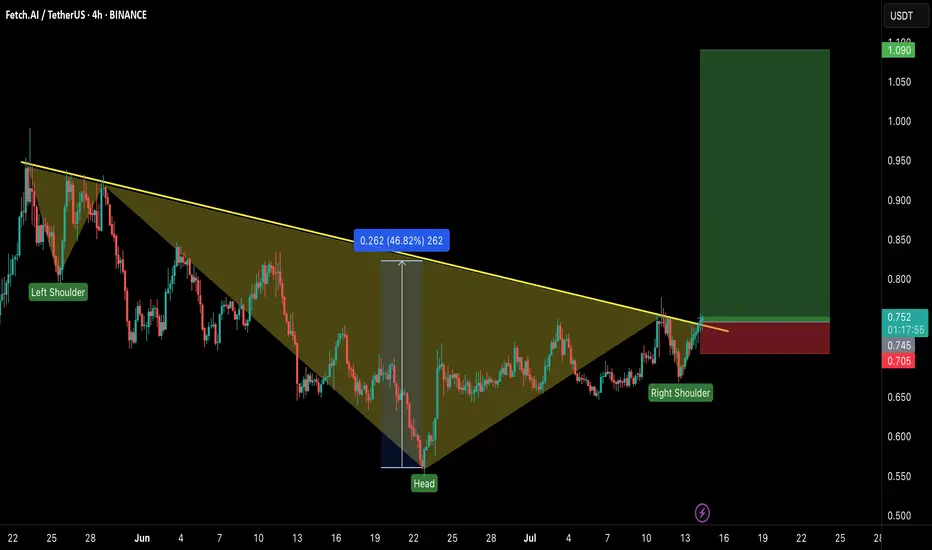
FET/USDT – Head & Shoulders Breakout!Hey Traders — if you're into high-conviction setups with real momentum, this one’s for you.
ONDO is trading inside a falling wedge on the daily chart — a classic bullish structure that often leads to explosive breakouts. 📈
FET just broke out of a classic inverse head & shoulders pattern — a strong bullish reversal structure! The breakout looks clean with a confirmed close above the neckline and volume starting to pick up.
💼 Entry: CMP ($0.75)
🎯 Targets: $0.85 / $0.95 / $1.09
🛑 Stop-loss: $0.705
📈 Risk-Reward: Favorable
🧠 Why it matters:
Clean breakout above resistance
Strong trend reversal structure
Potential for 40%+ move ahead.
💬 Are you in this breakout play or watching from the sidelines? Let’s talk below!
👉 Smash that LIKE and FOLLOW for more real-time setups!
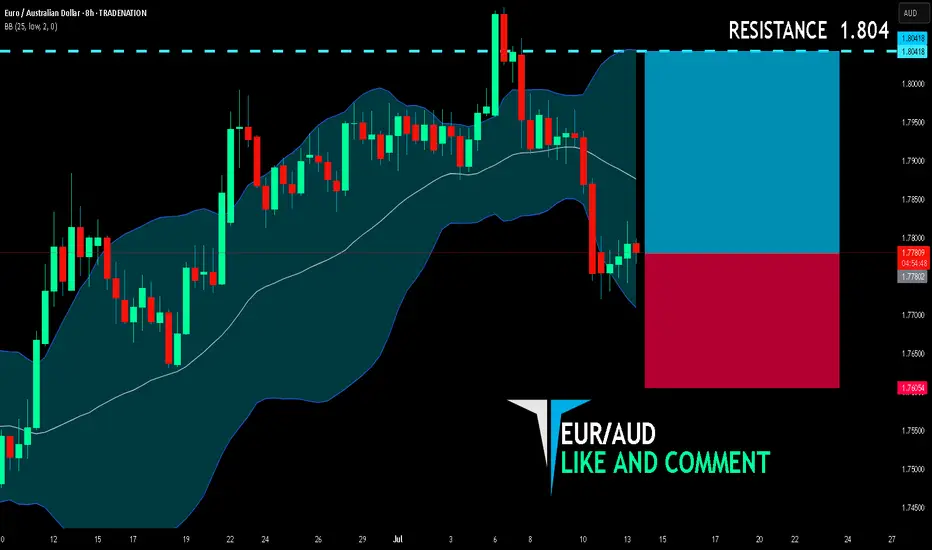
EUR/AUD BULLISH BIAS RIGHT NOW| LONG
EUR/AUD SIGNAL
Trade Direction: long
Entry Level: 1.778
Target Level: 1.804
Stop Loss: 1.760
RISK PROFILE
Risk level: medium
Suggested risk: 1%
Timeframe: 8h
Disclosure: I am part of Trade Nation's Influencer program and receive a monthly fee for using their TradingView charts in my analysis.
✅LIKE AND COMMENT MY IDEAS✅
btc buy longterm"🌟 Welcome to Golden Candle! 🌟
We're a team of 📈 passionate traders 📉 who love sharing our 🔍 technical analysis insights 🔎 with the TradingView community. 🌎
Our goal is to provide 💡 valuable perspectives 💡 on market trends and patterns, but 🚫 please note that our analyses are not intended as buy or sell recommendations. 🚫
Instead, they reflect our own 💭 personal attitudes and thoughts. 💭
Follow along and 📚 learn 📚 from our analyses! 📊💡"
