Advance Auto Parts, Inc. $AAP ~ Old DinoS RiSe ~ Bullish!Advance Auto Parts, Inc. engages in the supply and distribution of aftermarket automotive products for both professional installers and do-it-yourself customers. It operates through the following segments: Advance Auto Parts/Carquest U.S., Carquest Canada, Worldpac, and Independents. The company was founded by Arthur Taubman in 1929 and is headquartered in Raleigh, NC.
Bullishpattern

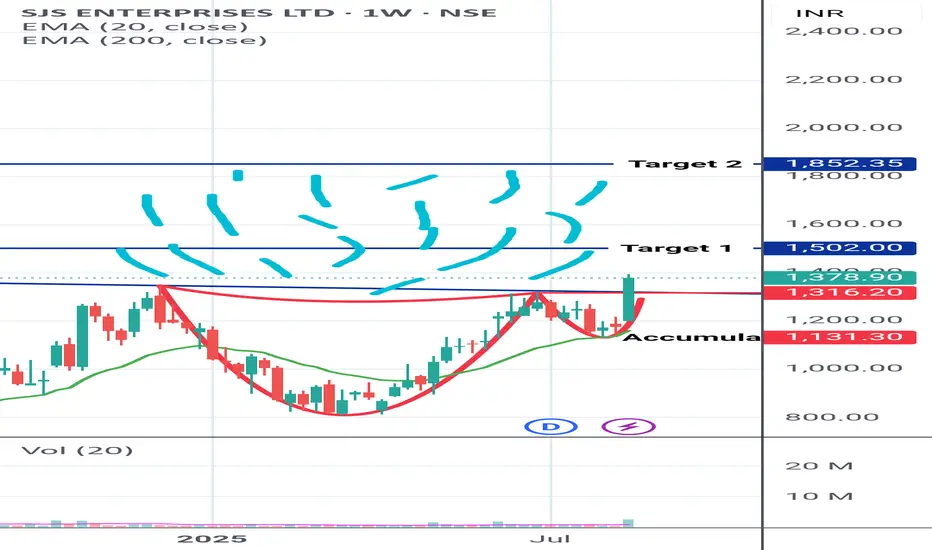
SJS ENTERPRISES VERY HOTSJS ENTERPRISES
Presents you a Hot Beautiful Cup of Coffee for tasting.
Those who wish to Enjoy the Taste can pay and start tasting it
Note Levels mentioned in chart itself. Kindly go through it
ADAUSTP LONG TERM BYBIT:ADAUSDT.P maybe we gonna be see this flag formation on ADA I think its blow up before the rate

PLTR still bullish - Cup n Handle patternPLTR in Cup and handle pattern, broke out.
The price closed on Friday is $131.78 (05.30.2025).
Desired entry price $127.88.
Target $147.58/ 164.99/ 183.41.
Stop loss $119.41.
IMO.

Cardano ADA Short-Term Correction in Play📉 COINBASE:ADAUSD is currently unwinding its August rally through a 3-wave pullback, with the ideal support zone between $0.85–$0.81.
Buyers are expected to step in there, setting the stage for the next bullish reaction.

ETH — Right-Angled Broadening BreakoutEthereum (ETH) has completed a Right-Angled Descending Broadening Pattern that developed over a period of 515 days. Such long-term structures are rare and often mark significant turning points in the market.
🔎 Pattern Breakdown
A–E → swings inside the broadening formation.
F → breakout above the flat resistance.
G (anticipated) → Retest of the breakout zone near $4000, where former resistance may establish itself as support.
The flat top resistance between $4000–$4100 has already given way. A successful retest and hold above this zone would confirm breakout validity and strengthen the probability of continuation toward ATH and beyond.
Trade Setup View
Retest entry zone (G): ~$4000
Invalidation (Stop-Loss): To be determined based on price action during the retest
TP1: Retest of ATH $4867
TP2: $5390
Final target (measured move): $6800
Risk-to-Reward: 1:7+ potential
Why $6800?
The measured move of a broadening formation is its full height projected upward from the breakout point:
Broadening low: $1383.26
Broadening high: $4109
➡️ Height = $2725.74
Add that to the breakout zone (~$4100) → $6825. Rounded, that gives a final target of $6800.
💡 Educational Takeaway
Right-Angled Descending Broadening Formations show growing volatility with buyers holding a ceiling steady while sellers run out of steam. Once that flat resistance breaks, momentum usually shifts in favour of the bulls. Since this one lasted over 500 days, the breakout isn’t just noise. It’s a macro signal that could define ETH’s next major trend leg.
Level to Watch Closely:
$4000 → the expected retest (G). Holding here would be a strong confirmation that ETH is ready to aim for ATH and price discovery.
_________________________________
💬 If you found this helpful, drop a like and comment!

Spotlight on WIPRO: Building Momentum for Potential GainsThis is the daily chart of WIPRO.
WIPRO has a strong support zone in the 230–240 range.
If this level holds, we may see higher prices in WIPRO.
Thank You !!

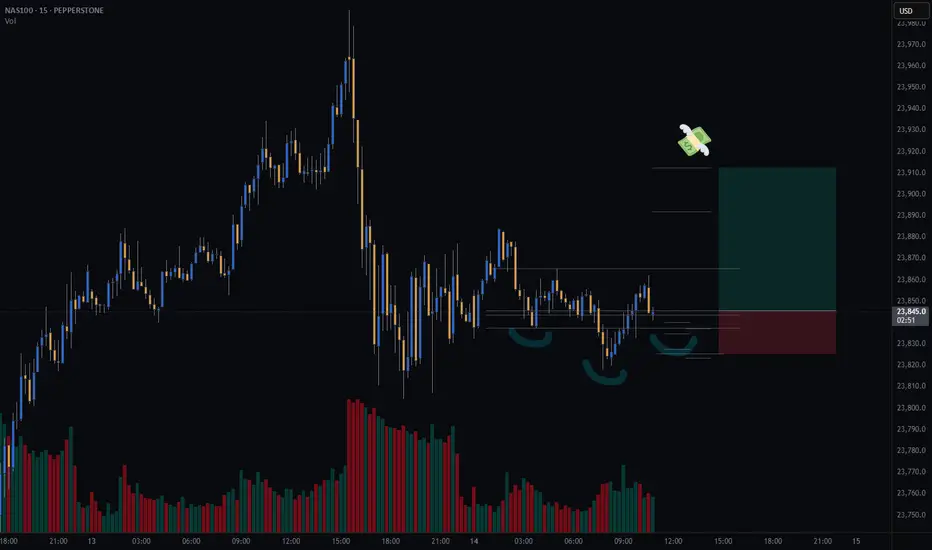
Potential inverse head and shoulders on NASDAQ (CASH100) - 15minI’m watching the Cash100 for a potential long setup.
On the 15min chart, an inverse head and shoulders pattern appears to be forming — potentially a continuation pattern following this week’s strong upward move.
I’m still waiting for confirmation of key variables, which will be assessed at 11:30am (GMT+1).
Trade Details:
📊 Risk/Reward: 2.4
🎯 Entry: 23 845
🛑 Stop Loss: 23 825
💰 Take Profit 1 (50%): 23 891
💰 Take Profit 2 (50%): 23 912
#GTradingMethod Tip: Lower volume on the right shoulder vs. the left shoulder strengthens the setup.
Please note: This is not financial advice. This content is to track my trading journey and for educational purposes only.
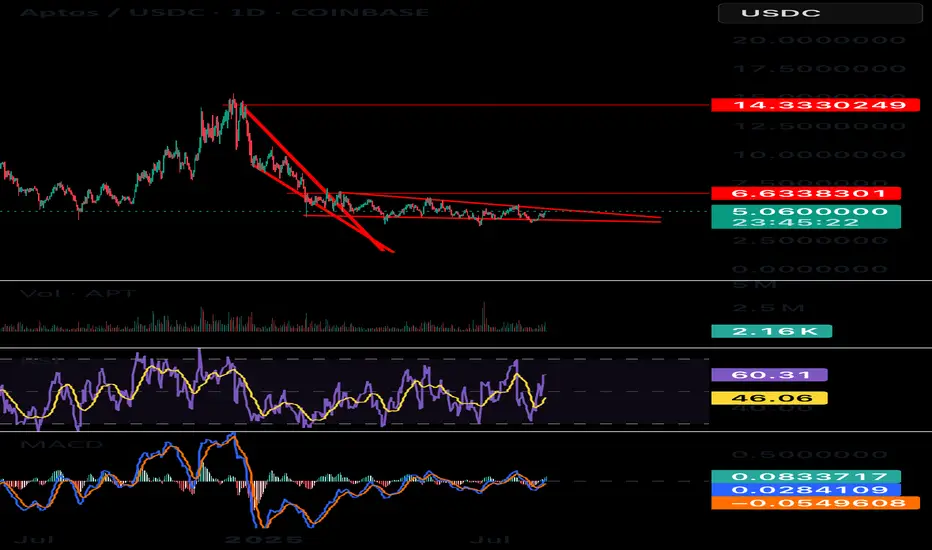
2 falling wedges on aptos Both wedges still valid gives you 2 targets, this is not short term this is long term! Bullish lets go!
XVG/USDT LONG SET-UPBINANCE:XVGUSDT
Waiting for a small retracement
FVG = Buying Area
keep an eye , spot buy only

DYDX LONG SET-UPBINANCE:DYDXUSDT
dydx Looking Bullish , waiting for a small retracement
expecting 40-50% Upside Rally
spot buy only

CPOOLUSDT Daily Chart Analysis | Momentum Surge & Key TargetsCPOOLUSDT Daily Chart Analysis | Momentum Surge & Key Targets
🔍 Let’s dive into the CPOOL/USDT 1D chart and break down the latest price action that’s catching attention, with an eye on bullish setups and critical zones.
⏳ Daily Overview
The chart shows a dynamic breakout above the accumulation box (range), with price riding a clear yellow trendline and volume spiking hard — classic momentum signals. RSI is entering the overbought zone, which confirms surging buying interest and the possibility for rapid moves.
🔺 Long Setup:
- The breakout from the range box suggests accumulation and fresh interest. Immediate upside looks at the mid-range target of $0.26010.
- Next, if momentum holds, price could rally towards $0.34350, which lines up with the risk-reward (RR1) from the box.
- Sustained momentum and continued volume spikes could unlock even higher targets beyond these levels.
📊 Key Highlights:
- Yellow trendline supports the move, tracking bullish sentiment.
- Volume spikes show real participation — this isn’t a low-liquidity fakeout.
- RSI entering the overbought zone is a momentum engine, but keep an eye out for possible pullbacks or cooling periods as price tests higher levels.
- Fake breakout earlier in the range now confirmed by the strong candle and volume surge.
🚨 Conclusion:
Momentum is accelerating. If buyers stay in control above current support, price could climb to the mid-box target of $0.26010, with $0.34350 as the next bullish destination. This setup favors longs as long as volume and trendline support remain intact. Aggressive momentum could push price even further — time to watch those critical resistance levels.

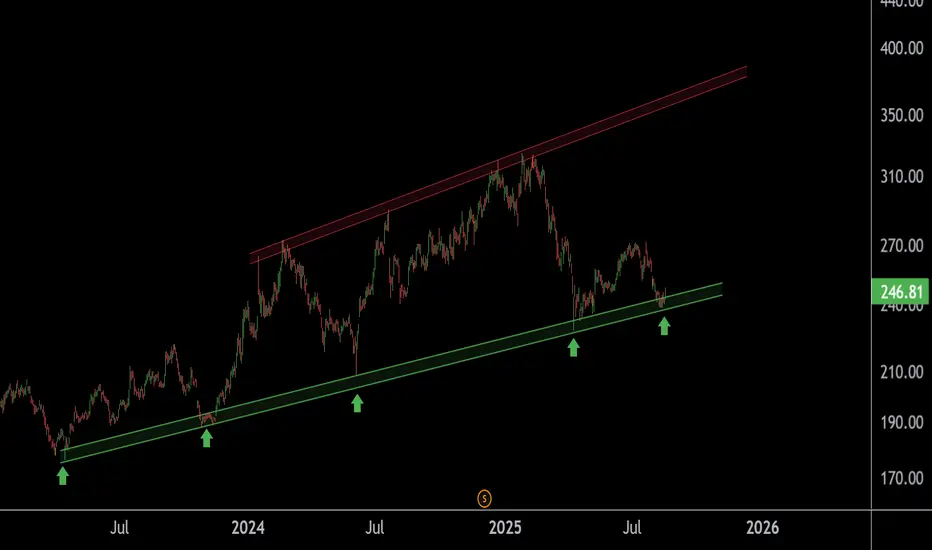
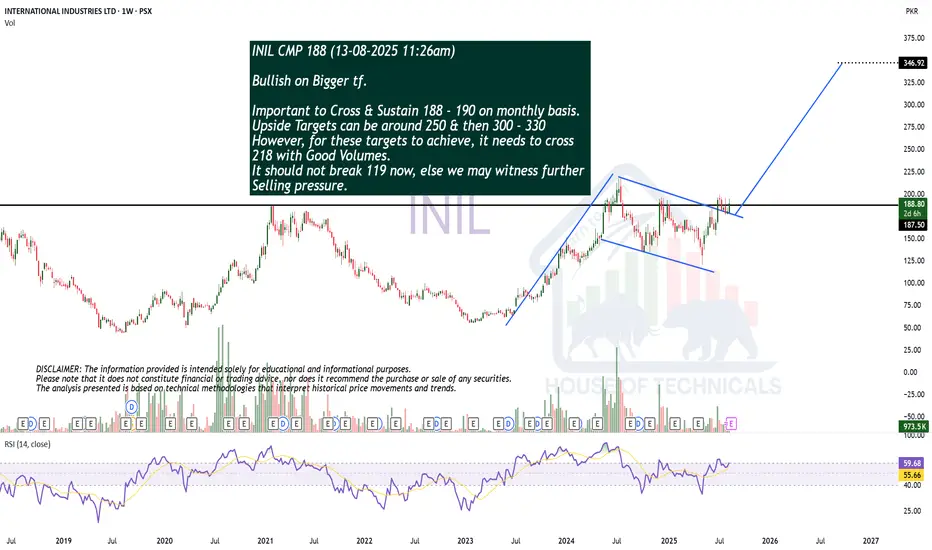
Bullish on Bigger tf.INIL CMP 188 (13-08-2025 11:26am)
Bullish on Bigger tf.
Important to Cross & Sustain 188 - 190 on monthly basis.
Upside Targets can be around 250 & then 300 - 330
However, for these targets to achieve, it needs to cross
218 with Good Volumes.
It should not break 119 now, else we may witness further
Selling pressure.
"Gold’s Critical Bounce Zone – Is $3,400 the Next Magnet Level?""Gold’s Critical Bounce Zone – Is $3,400 the Next Magnet Level?"
📊 XAUUSD is showing a textbook bullish structure setup after forming a Higher Low right above strong support at $3,339. Price is now trading inside the Entry Zone ($3,348 – $3,339), an area that aligns with:
✅ Order Block Support
✅ Previous Break of Structure (BOS)
✅ Smart Money Fair Value Gap (FVG) retest
🧐 Market Structure Insight
Recent BOS flipped bias to bullish after buyers pushed through prior resistance.
A bullish FVG from earlier in the trend still holds influence, attracting price back for a healthy retest.
The current Higher Low shows buyers stepping in early, maintaining upward momentum.
Strong resistance is located at $3,400 – $3,440, which also acts as a psychological magnet for traders.
🎯 Trade Plan (Educational Example)
Entry Zone: 3,348 – 3,339 📍
Stop Loss: below 3,339 🛑
Target 1: 3,380 🎯 (partial profits)
Target 2: 3,400 ⭐ (main target)
Extended Target: 3,420 – 3,440 💎
📈 Reward to Risk: ~1.6R to the main target, with potential 2.9R to extended resistance if momentum accelerates.

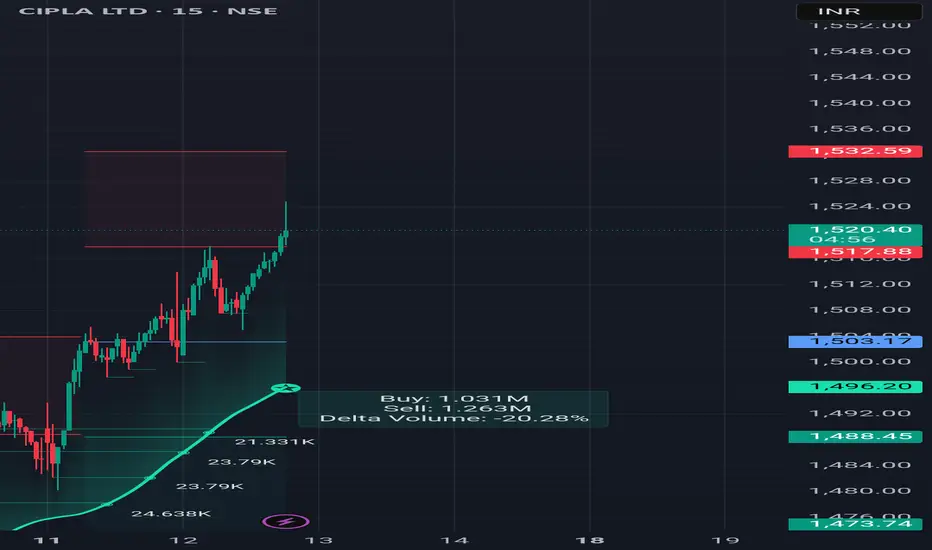
Cipla Break out📊 1–2 Days Technical Call
📌 Stock: CIPLA Ltd
💵 Buy Above: 1519.0
🎯 Target Price: 1557.0 (Upside: +2.50%)
🛑 Stop Loss: 1500.0 (Downside: -1.25%)
⚖ Risk–Reward Ratio: ~1 : 2.0
📅 Holding Period: 1–2 trading days
📌 Rationale: Positive technical setup; breakout expected above 1519 with momentum likely to push towards 1557 in short term.
D-Mart Breakout 📢 PJV FINANCIAL – 1-2 DAYS TECHNICAL CALL 📢
🔷 SCRIPT: DMART
🔷 Action: BUY above ₹4260
🔷 Stop Loss: ₹4180 (📉 -1.88%)
🔷 Target: ₹4420 (📈 +3.76%)
🔷 Risk–Reward Ratio: 1 : 2.00 ✅
📌 Short-term momentum trade idea – strictly follow SL.
🚀 #PJVSignals | 💼 #TechnicalCall

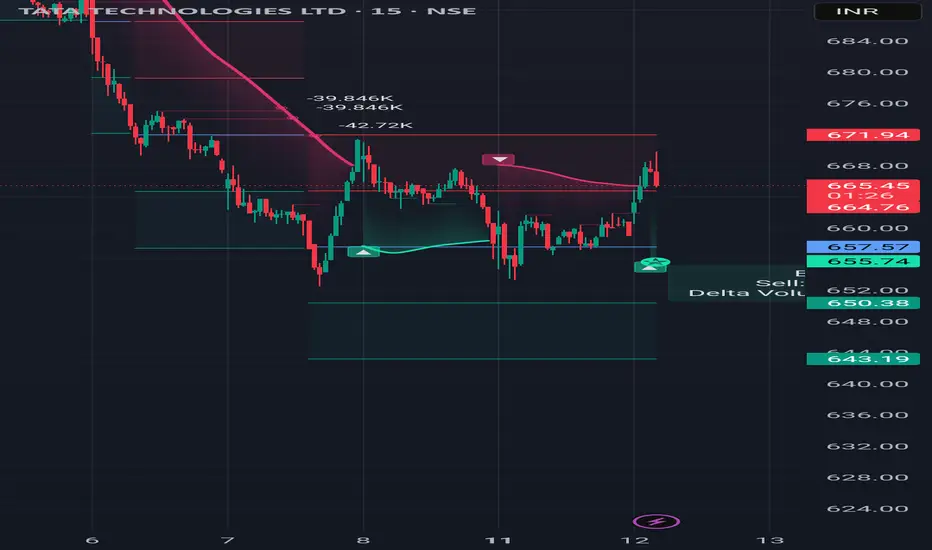
Short term Technical Idea TATATECH📢 PJV FINANCIAL – 1-2 DAYS TECHNICAL CALL 📢
🔷 SCRIPT: TATATECH
🔷 Action: BUY above ₹667.40
🔷 Stop Loss: ₹656 (📉 -1.71%)
🔷 Target: ₹688 (📈 +3.08%)
🔷 Risk–Reward Ratio: 1 : 1.80 ✅
📌 Short-term momentum trade idea – strictly follow SL.
🚀 #PJVSignals | 💼 #TechnicalCall
$AAVE / 1H Trade plan CRYPTOCAP:AAVE / 1H Trade plan 📊
Price just broke market structure after forming clean Equal Lows (EQL), signaling bearish intent.
Currently holding below the $296–$297 zone — my eyes are on a retracement into the $303 supply area for a potential short entry.
🛑 Bearish Plan:
🟢 Pullback Zone: $302–304
✅ Main Target: $269–272 📉
⛔ Invalidation: Above $313
If the 1H candle gives a strong close above $303, I won’t take the entry. But if it gets rejected, I’ll enter.
The game plan stays simple — execute the setup, ignore the noise. The chart is telling the story; we just need to follow the script.
CRYPTOCAP:AAVE

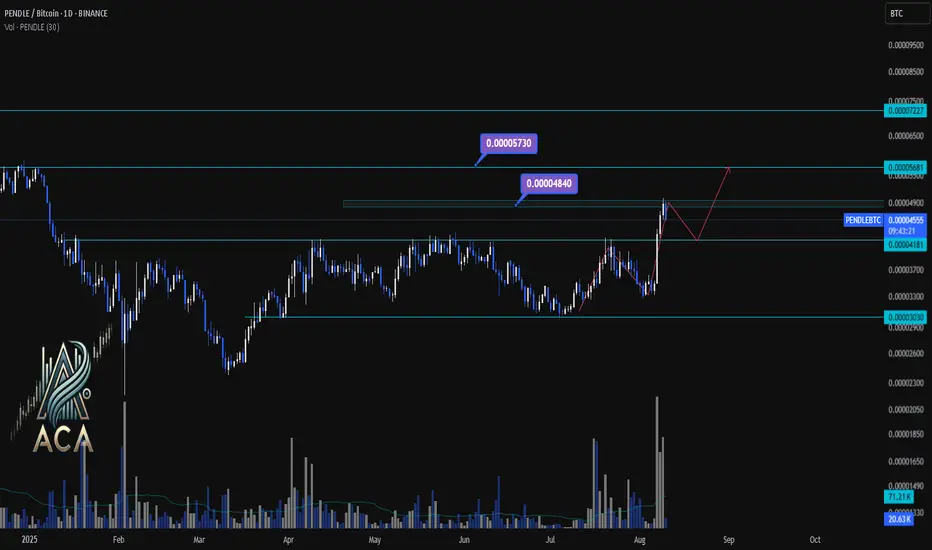
PENDLE/BTC Daily Chart Analysis | Momentum Building for the NextPENDLE/BTC Daily Chart Analysis | Momentum Building for the Next Move
🔍 Let’s dive into PENDLE/BTC and highlight the current technical landscape with key areas to watch for traders.
⏳ Daily Chart Overview
PENDLE/BTC recently broke above a multi-month resistance near 0.00004500, confirming strong bullish momentum on the daily timeframe. Volume surges are supporting this upward move, indicating increased market participation and renewed interest from buyers.
🔺 Bullish Scenario:
If the uptrend continues, look for a push toward the first target:
- 0.00004840 (major supply/target zone)
- On further strength, 0.00005730 is in sight as the next resistance.
Expect short-term consolidation or minor pullbacks before any strong breakout.
🔻 Bearish/Consolidation Scenario:
If sellers step in or the rally loses steam, support is found at:
- 0.00004181 (immediate level)
- If this breaks, look for deeper retracement toward 0.00003300 (structural support).
📊 Key Highlights:
- Daily breakout from a consolidation range signals bullish continuation potential.
- Volume spikes confirm genuine buyer interest at current levels.
- Major upside targets: 0.00004840 and 0.00005730.
- Critical downside supports: 0.00004181 and 0.00003300.
- Price action may oscillate (range/consolidate) between the support and resistance before a major move.
🚨 Conclusion:
Momentum favors bulls as long as price holds above 0.00004181. Watch for a confirmed breakout above 0.00004840 for additional upside. Stay nimble—volatility will likely provide both breakout and pullback opportunities.
Keep an eye on PENDLE/BTC and PENDLE/USDT📈📊
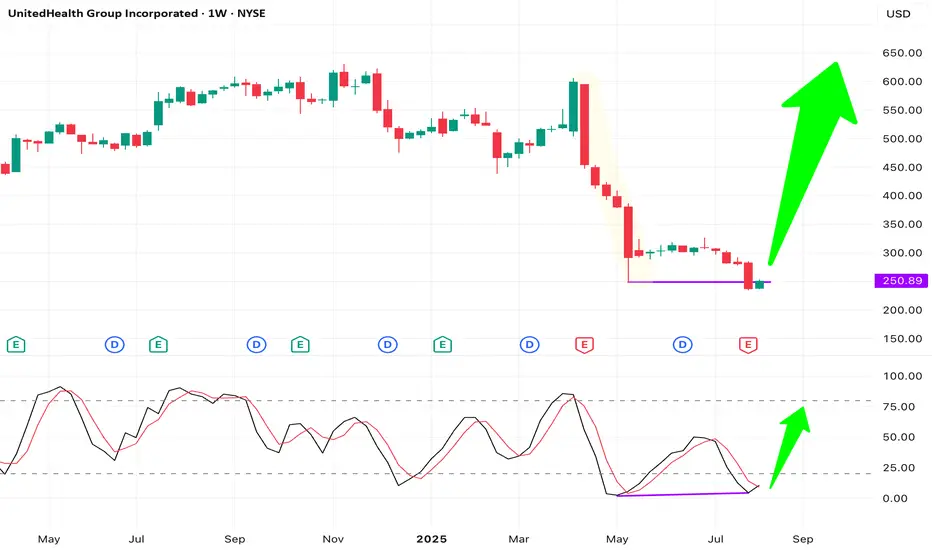
UNH – Force Bottom with Bullish Divergence at Support(Weekly Chart) NYSE: UNH remains a fundamentally strong company, even though healthcare is not currently the market’s leading sector. On the weekly chart, price action shows a force bottom (double bottom with take-out stops pattern), flushing stop-losses below the previous low at $248.88.
Last week, price closed back above the $250 support with a bullish candle. Price action and stochastic show a bullish divergence, with stochastic oversold and starting a golden cross. Risk-reward looks very favorable from this level.
XRP Consolidation pattern breakout imminentLooks to me like XRP is breaking out of a rectangle or consolidation pattern as we speak.
Pattern formed since NOvember 2024 and since then XRP has been trading in this range.
Our current weekly candle is clearly in the process of attempting a breakout above the upper band or resistance trendline of the consolidation pattern.
We still have a day for candle close of this week.
Look to see if a potential engulfing candle print occurs or not.
Also note, this is by no means confirmation of the pattern break. We would need a concise bullish candle pattern for the next week to print for COnfirmation.
If we do confirm breakout. XRP will be back in price discovery mode like BTC. And i personally wouldn't sleep on it.
Its one of the better performers in crypto and seems like to me with every passing day a major player like BTC. (Opinion based on TA)
I would also monitor the MACD indicator. Observe for increasing histogram bars and deep green color as well as bullish cross.
On Macro timeframes, being above the 0 line on MACD is always bullish until we cross below.

"BTCUSD Technical Outlook: Support Holds, Bulls Aim for $117K""BTCUSD Technical Outlook: Support Holds, Bulls Aim for $117K"
Market Structure Overview
BOS (Break of Structure): Multiple BOS points indicate strong shifts in market direction, confirming both bullish and bearish trends across different zones.
Bearish Fair Value Gap (FVG): This zone, marked after a BOS on July 23–24, acted as a rejection area, initiating a sharp sell-off — a classic bearish imbalance fill and reversal.
Equal Lows & Sell-side Liquidity: This area attracted liquidity grabs, as smart money hunts resting stop losses below these equal lows before reversing direction.
🔸 Key Supply & Demand Zones
Previous Resistance Zone (~118,000 - 120,000): Price rejected this area after filling the imbalance, confirming it as a strong supply zone.
Support Zone (~112,000 - 113,000): Currently acting as a high-probability demand zone. Liquidity accumulation here suggests a possible bullish reversal.
📉 Liquidity Zones
Sell-side Liquidity Sweep: Price dipped below equal lows to collect liquidity, often a signal of institutional accumulation.
Liquidity/Fair Value Zone (~116,000): Acts as a magnet for price, offering potential retracement targets before any major trend continuation.
📈 Forecast & Target
Current Price: $114,061
Short-term Target: $117,546 — aligning with previous FVG imbalance and liquidity zone.
Bias: Bullish Reversal expected from support zone toward the previous inefficiency and resistance levels.
🎓 Educational Takeaways
BOS Confirmation is critical in validating trend shifts and structure breaks.
FVGs (Fair Value Gaps) highlight inefficiencies and offer high-probability reversal or continuation zones.
Liquidity Sweeps near equal lows/highs often precede smart money moves — useful for spotting entries and exits.
Volume Profile (left side) suggests higher activity zones — these areas often align with major turning points.
✅ Conclusion
BTCUSD has swept liquidity below support and is showing signs of reversal. If the bullish pressure holds above $113,000, a move toward the $117,500 zone is likely, targeting previously unfilled imbalance and trapped liquidity.
