SOL ANALYSIS🔮 #SOL Analysis 🚀🚀 Update
💲💲 As we said #SOL performed the same. #SOL is trading in a Ascending Broadening Wedge Pattern and there was a breakdown of the pattern. Now we can expect a breakout of the resistance and a bullish move
💸Current Price -- $151
⁉️ What to do?
- We have marked crucial levels in the chart . We can trade according to the chart and make some profits. 🚀💸
#SOL #Cryptocurrency #DYOR
Bullishsentiment

ZEC ANALYSIS🔮 #ZEC Analysis
🌟🚀 #ZEC is trading in an Ascending Triangle Pattern and here we can see that #ZEC testing the ascending trendline. Also there is an instant major support zone. We can see a pullback from its major support zone.
🔖 Current Price: $32
⏳ Target Price: $40
⁉️ What to do?
- We have marked crucial levels in the chart . We can trade according to the chart and make some profits. 🚀
#ZEC #Cryptocurrency #Breakout #DYOR

ETH ANALYSIS🔮 #ETH Analysis :: Support & Resistance Trading
💲💲 #ETH is trading between support and resistance area. If #ETH sustains above major support area then we will a bullish move and if not then we will see more bearish move in #ETH then could expect a pullback.
💸Current Price -- $1564
⁉️ What to do?
- We have marked crucial levels in the chart . We can trade according to the chart and make some profits. 🚀💸
#ETH #Cryptocurrency #DYOR

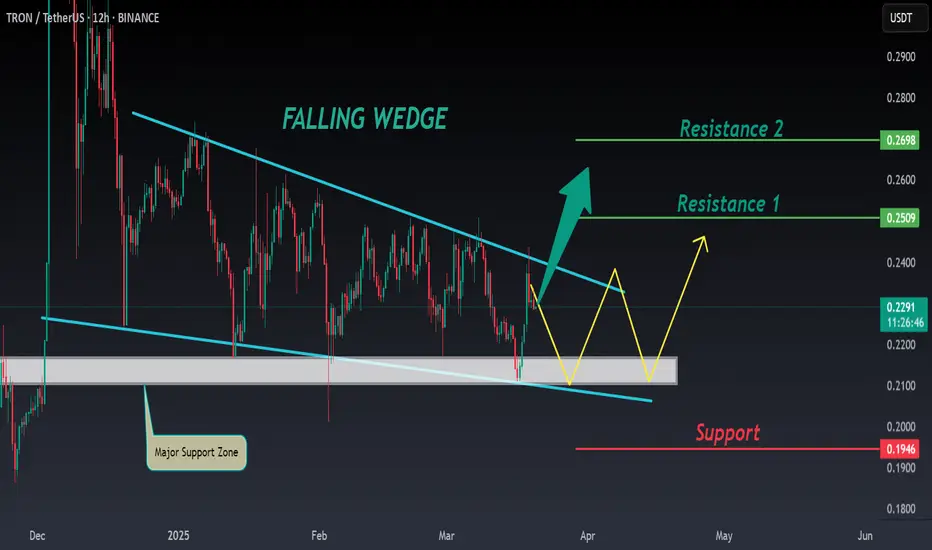
TRX ANALYSIS📊 #TRX Analysis
✅There is a formation of Falling Wedge Pattern on 12 hr chart and currently trading around its major support zone🧐
Pattern signals potential bullish movement incoming after a breakout
👀Current Price: $0.2290
🚀 Target Price: $0.2500
⚡️What to do ?
👀Keep an eye on #TRX price action and volume. We can trade according to the chart and make some profits⚡️⚡️
#TRX #Cryptocurrency #TechnicalAnalysis #DYOR
ONDO ANALYSIS 🔮 #ONDO Analysis 💰💰
🌟🚀In 1hr chart we can see a formation "Rising Wedge Pattern in #ONDO. There is a strong resistance zone near at $0.8840 and we could see a rejection from that level but if the price breaks the resistance zone then we would see a bullish move 💲💲
🔖 Current Price: $0.8640
⏳ Target Price: $0.9350
⁉️ What to do?
- We have marked some crucial levels in the chart. We can trade according to the chart and make some profits in #ONDO. 🚀💸
#ONDO #Cryptocurrency #DYOR #PotentialBreakout

AUCTION ANALYSIS📊 #AUCTION Analysis
✅There is a formation of Falling Wedge Pattern on daily chart with a good breakout and currently retesting the major resistance zone🧐
Pattern signals potential bullish movement incoming after a breakout of major resistance zone
👀Current Price: $18.85
🚀 Target Price: $29.90
⚡️What to do ?
👀Keep an eye on #AUCTION price action and volume. We can trade according to the chart and make some profits⚡️⚡️
#AUCTION #Cryptocurrency #TechnicalAnalysis #DYOR

OM ANALYSIS🔴 #OM Analysis :
🔮There is a formation of "Bullish Pennant Pattern" in #OM in 4hr time frame. #OM is trading around its all time high level. We may see a little retest before a bullish move
⚡️What to do ?
👀Keep an eye on #OM price action. We can trade according to the chart and make some profits. ⚡️⚡️
#OM #Cryptocurrency #Breakout #DYOR

OGN ANALYSIS🔮 #OGN Analysis 💰💰
🌟🚀 As we can see that #OGN is trading in a symmetrical triangle and given a perfect breakout with a huge volume. But there is an instant resistance. If #OGN breaks the resistance 1 then we will see a good bullish move in few days . 🚀🚀
🔖 Current Price: $0.0940
⏳ Target Price: $0.1260
#OGN #Cryptocurrency #DYOR

RUNE ANALYSIS🔮 #RUNE Analysis
🌟🚀 As we sail earlier, #RUNE performed the same. Currently #RUNE is trading above its major support zone and we could see a retest before our next target
🔖 Current Price: $5.575
⏳ Target Price: $7.232
🏷Remember, the crypto market is dynamic in nature and changes rapidly, so always use stop loss and take proper knowledge before investments.
#RUNE #Cryptocurrency #DYOR

PHB ANALYSIS🚀#PHB Analysis :
🔮As we can see in the chart of #PHB that there is a formation of "Falling Wedge Pattern". Also there is a breakout and retest of the pattern and currently retesting the major support zone. Expecting a bullish move in few days.📈
🔰Current Price: $2.100
🎯 Target Price: $2.800
⚡️What to do ?
👀Keep an eye on #PHB price action. We can trade according to the chart and make some profits⚡️⚡️
#PHB #Cryptocurrency #TechnicalAnalysis #DYOR

BTC ANALYSIS (Update)🔮 #BTC Analysis - Update 🚀🚀
💲 As we said earlier #BTC performed the same. More than 8.65% done move done in #BTC. Now we can see that there is a formation of Descending Broadening Wedge Pattern in #BTC and we can see a more retest before a pullback.
💸Current Price -- $60760
📈Target Price -- $66000
⁉️ What to do?
- We have marked crucial levels in the chart . We can trade according to the chart and make some profits. 🚀💸
#BTC #Cryptocurrency #Breakout #DYOR

PEPE ANALYSIS (update)🔮 #PEPE Analysis - Update 🚀🚀
💲 As we said earlier #PEPE performed the same. More than 48% move already done in #PEPE. Now we can see a little retest towards it's major support zone and after that a bullish move would be seen
💸Current Price -- $0.00001109
📈Target Price -- $0.00001670
⁉️ What to do?
- We have marked crucial levels in the chart . We can trade according to the chart and make some profits. 🚀💸
#PEPE #Cryptocurrency #Breakout #DYOR

ROSE ANALYSIS🚀#ROSE Analysis : What Next ??💲
✅As we can see that there was a formation of "FALLING WEDGE PATTERN" in #ROSE. We are expecting a bullish move in #ROSE after a breakout of falling wedge pattern
🔰Current Price: $0.06235
🎯 Target Price: $0.09755
⚡️What to do ?
👀Keep an eye on #ROSE price action. We can trade according to the chart and make some profits. Stay tuned for further analysis and stay updated with market sentiments and news.⚡️⚡️
#ROSE #Cryptocurrency #TechnicalAnalysis #DYOR

SOL ANALYSIS🔮 #SOL Analysis 🚀🚀
As we can see that #SOL is trading in a Descending Channel Pattern in daily time frame. After a small retest towards it's support zone we would see a reversal in #SOL 💸 💯🚀
💸Current Price -- $140.99
📈Target Price -- $200.00
⁉️ What to do?
- We have marked crucial levels in the chart . We can trade according to the chart and make some profits. 🚀💸
#SOL #Cryptocurrency #DYOR

NOT ANALYSIS🔴 #NOT Analysis : ❓❓
🔮There is a formation of "Bullish Pennant Pattern" in #NOT in 8hr time frame. We can expect around $0.02100 bullish move if the price brake the pattern.📈
⚡️What to do ?
👀Keep an eye on #NOT price action. We can trade according to the chart and make some profits. ⚡️⚡️
#NOT #Cryptocurrency #Breakout #DYOR

DOGE ANALYSIS🔮 #DOGE Analysis - Breakout 🚀🚀
💲💲 In 12hr Timeframe,Falling Wedge Breakout is Done✅
But right now we can see that #DOGE is trading around its crucial resistance zone and if #DOGE breaks this resistance zone then we would see a bullish move 💯🚀
💸Current Price -- $0.11880
📈Target Price -- $0.22075
⁉️ What to do?
- We have marked crucial levels in the chart . We can trade according to the chart and make some profits. 🚀💸
#DOGE #Cryptocurrency #Breakout #DYOR

FIL ANALYSIS🔮 #FIL Analysis 💰💰
🌟🚀 As we can see that #FIL is trading in a symmetrical triangle and given a perfect breakout and already retest the levels. But there is an instant resistance of descending trendine. If #FIL breaks the descending trendline then we will see a good bullish move in few days . 🚀🚀
🔖 Current Price: $6.154
⏳ Target Price: $10.00
#FIL #Cryptocurrency #DYOR

BTC ANALYSIS🔮 #BTC Analysis 🚀🚀
💲💲 #BTC was trading in a Descending Broadening Wedge Pattern, and trying to breakout the pattern. If the price of #BTC breakout and closes above the pattern then we will see a bullish move. 📈📈
💸Current Price -- $71080
📈Target Price -- $74000 ++
⁉️ What to do?
- We have marked crucial levels in the chart . We can trade according to the chart and make some profits. 🚀💸
#BTC #Cryptocurrency #Breakout #DYOR

🥤 Coca-Cola (KO): Strong Performance and Positive Momentum! 📈📊 Analysis:
Coca-Cola NYSE:KO
Strong Performance: Reported a 12% increase in organic sales in 2023.
Guidance: Management's guidance indicates continued positive momentum into 2024.
Restructuring Success: Restructuring efforts led to rising revenue and net income.
Diversification: Expansion into energy drinks and sparkling water diversifies product portfolio for future growth.
📈 Bullish Sentiment:
Entry Range: Suggested entry above the $53.00-$54.00 range.
Upside Target: Target set at $75.00-$77.00, reflecting confidence in KO's ability to navigate challenges and capitalize on opportunities.
🌐 Note: Monitor KO's performance and execution of diversification strategy for sustained growth! 📊💹 #KO #BullishSentiment #PositiveMomentum 🥤📈

💊 Blueprint Medicines: Positive Momentum and Growth Prospects! 📊 Analysis NASDAQ:BPMC :
Financial Performance: 90% YoY growth in net-product revenues from U.S. sales of Ayvakit, a drug for certain cancers.
Market Prospects: Positive market response to Ayvakit's unique clinical profile.
CEO's Confidence: CEO's confidence in the company's future contributes to its momentum.
📈 Bullish Sentiment:
Entry Range: Suggested entry above the $83.00-$84.00 range.
Upside Target: Aiming for an upside in the $120.00-$125.00 range.
🌐 Note: Monitor BPMC's ongoing developments and market performance! 📊💹 #BPMC #Biotech #BullishSentiment 💊📈

⚕️ Tenet Healthcare (THC): Positive Outlook in 2024! 🏥📈📊 Analysis:
Positive Outlook: NYSE:THC anticipates continued organic volume growth, strong patient acuity, and effective cost management in 2024.
Strategic Move: Alleviated long-term debt by selling three hospitals in South Carolina for $2.4 billion in cash.
Financial Performance: Strong finish to the year with an attractive adjusted EBITDA margin.
📈 Bullish Sentiment:
Entry Range: Suggested entry above the $77.00-$78.00 range.
Upside Target: Aiming for an upside in the $145.00-$147.00 range.
🌐 Note: Monitor THC's performance in line with its outlined strategies and financial results! 📊💹 #THC #HealthcareOutlook #BullishSentiment 🏥📈

CADCHF: Bullish Reversal Potential - Long Trade Setup📉 Overview:
CADCHF is shifting from a downtrend to sideways movement, signaling a potential bullish reversal. A sharp bullish divergence and a strong 97% bullish market sentiment enhance the likelihood of an upward move.
📊 Technical Analysis:
Transition from downtrend to sideways, coupled with a bullish divergence, sets the stage for a potential bullish reversal.
📈 Market Sentiment:
A robust 97% bullish sentiment supports the potential strength of the upward reversal.
📉 Trade Strategy:
Traders may consider a long trade if the key level at 0.63910 is breached. Entry points near the coming higher lows (HL) or Fibonacci retracement levels like 0.236 or 0.382 are potential considerations.
🛑 Risk Management:
Implementing effective risk management, including appropriate stop-loss orders, is crucial to safeguard capital.
📈 Conclusion:
CADCHF presents a compelling long trade opportunity with bullish signals and strong market sentiment. Monitor the break above 0.63910 and adjust positions based on evolving market conditions.

Daily Crypto Market Update - Starting to turn more bullish! In this video:
* I attempt to put a pulse on the current crypto market sentiment
* We review a great setup (Litecoin) from yesterday
* We review most of the main leaders/indicators in the crypto space
* What I'd love to see us do in terms of price action
* Why I am starting to turn more bullish
