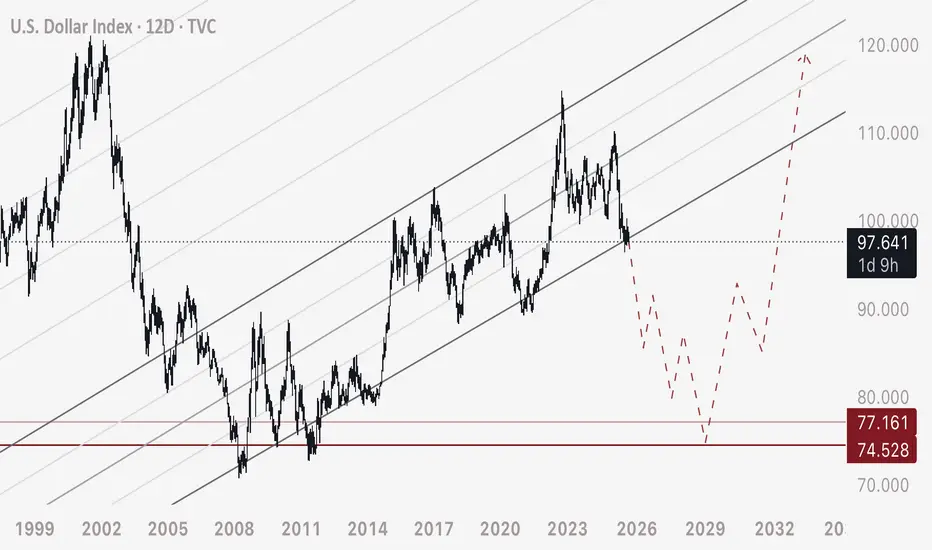
DXY - Major Breakdown of bearish StructureDXY has broken down and is currently retesting a breakdown of this major ascending channel on the weekly - monthly time frame.
Applying this to equities and Bitcoin - we can anticipate a bull run spanning 3-6 years approximately.
Due to the major event of this retest here - I expect that Bitcoin and manipulated markets will see a flash crash of severe magnitude, popping the balloon of the over- leveraged market caps.
No black swan is needed to see this take place on Bitcoin. The charts been rising steadily and holding since 2023 - this attracts long leveraged positions and consequently their stop loss orders. Sell orders are cascading in the chart all the way down to 10,000 - and only fill when price crosses.
This is the event that will pop the bubble before we see stability in the bull run. I don’t expect the equities markets to drop substantially at all - rather I believe we will continue to rise for 3-6 years coinciding with DXY breakdown.
Bullrun
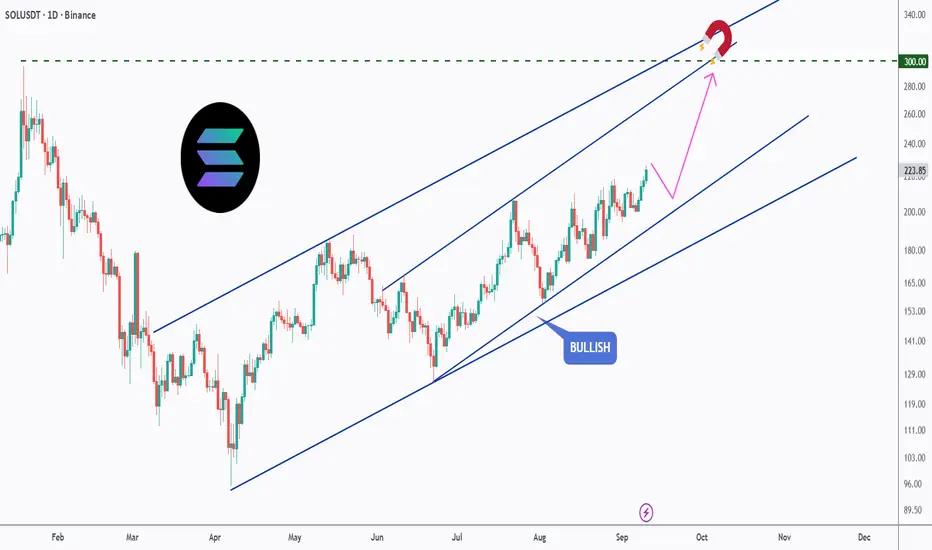
SOL’s Magnetic Path to $300!Solana has been steadily climbing inside a clean bullish channel, and the momentum is showing no signs of slowing down. The price action continues to respect higher highs and higher lows, keeping the bullish structure intact.
🟢 Bullish Channel: SOL is trading neatly within an ascending channel, confirming the trend’s strength.
🎯 Key Target: The $300 level acts as a magnet — a psychological resistance aligning with the channel’s upper boundary.
🔄 Healthy Pullbacks: Any short-term dips within the channel are being absorbed quickly, signaling strong buyer interest.
🚀 Upside Outlook: As long as SOL holds within the channel, the path of least resistance remains to the upside, with $300 as the next major milestone.
📌 Eyes remain on whether Solana can reach the $300 mark before the year’s end.
This is for educational purposes only, not financial advice. Always manage risk properly before trading.
📚 Stick to your trading plan regarding entries, risk management, and trade execution.
Good luck!
All Strategies Are Good; If Managed Properly!
~Richard Nasr
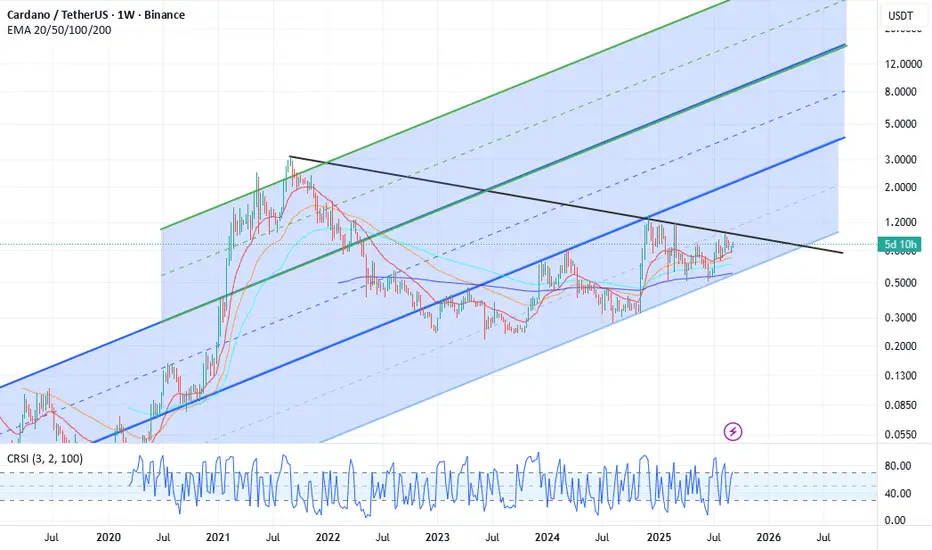
Cardano Ready for a Major Move – Huge Potential for $ADACardano has significant potential, but from a technical perspective we still need to see a decisive confirmation candle above the black trend line before a sustained breakout can be confirmed. If we break this trend line with strong momentum, the next mid-term targets are $1.20 and $1.60.
On the fundamental side, there is a strong pipeline of catalysts: BTC DeFi on Cardano enabled by its shared UTXO structure, the upcoming Leios upgrade for scalability, Hydra L2 for faster transactions, and the launch of the first Cardano partner chain Midnight, which focuses on privacy and selective disclosure to meet enterprise demand.
Looking further ahead, the possible targets for 2026 are in the $3 to $8 range, which align with the mid-line of the second ascending channel.
Considering both the technical setup and the fundamentals, I see substantial upside potential for Cardano in late 2025 and into 2026, with the possibility of outperforming BTC, ETH, and SOL as adoption and utility expand.
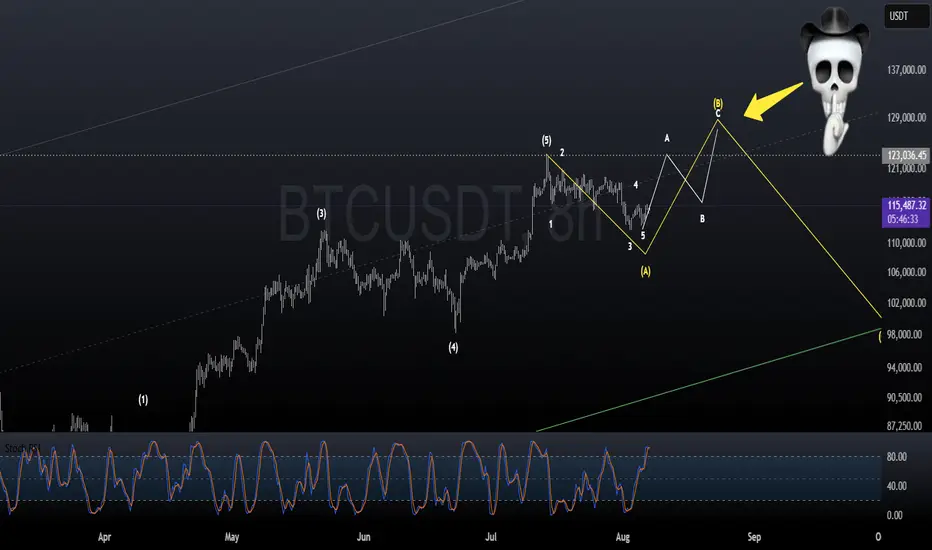
Bitcoin Cycles: History Repeating Itself?Bitcoin has always moved in cycles — a strong impulsive rally 📈 (1), followed by a healthy correction 🔻 (2), then a breakout above the previous high 🔓 (3).
Looking at the chart, the current price action is following this same rhythm once again. After the last correction, BTC bounced strongly, retested previous highs, and is now consolidating before its next potential move.
If this pattern continues to repeat, the next leg could take Bitcoin toward the $140,000 target 🎯 — aligning perfectly with the upper bound of the long-term channel.
👉 The past doesn’t guarantee the future, but BTC’s structure suggests the market might just be writing the same story again.
💬 What’s your bias here? Are you bullish or waiting for a deeper pullback?
📚 Always follow your trading plan regarding entry, risk management, and trade management.
Good luck!
All Strategies Are Good; If Managed Properly!
~Richard Nasr

BTC - Are You Ready?Hello TradingView Family / Fellow Traders. This is Richard, also known as theSignalyst.
📈BTC has been overall bullish trading within the rising wedge pattern marked in red.
This week, BTC has been retesting the lower bound of the channel.
Moreover, the orange zone is a strong strong and previous all-time high.
🏹 Thus, the highlighted blue circle is a strong area to look for buy setups as it is the intersection of the lower red trendline and previous ATH.
📚 As per my trading style:
As #BTC is around the blue circle zone, I will be looking for trend-following bullish reversal setups (like a double bottom pattern, trendline break , and so on...)
📚 Always follow your trading plan regarding entry, risk management, and trade management.
Good luck!
All Strategies Are Good; If Managed Properly!
~Richard Nasr

ZGM | CAN GOLD HIT 3755 ? We Are Seeing The Bull Run Month In Gold
So The H1 Timeframe Gold Telling A Very Bullish Market Move Coming In History That Gold Have Create A High Strong Bullish Channel That We Are Expecting Gold That The Gold Are Continuously Bullish

BTC – Bulls Guarding the Key Zone!Bitcoin is retesting a major support zone 🛡️ that overlaps with the previous ATH breakout level.
This area has been acting as a strong demand zone, keeping the overall structure bullish despite recent corrections.
As long as this zone holds, we will keep looking for long opportunities 📈, with the next wave of momentum likely pushing BTC higher. If the bulls manage to reclaim the minor resistance ahead, we could see them fully take over and drive price back into an upward rally.
For now, this zone remains a crucial pivot — watch closely for bullish confirmation signals.
⚠️ Disclaimer: This is not financial advice. Always do your own research and manage risk properly.
📚 Stick to your trading plan regarding entries, risk management, and trade execution.
Good luck!
All Strategies Are Good; If Managed Properly!
~Richard Nasr

BTC, the clock is tickingLet the chart speak for itself. BTC will make new ATH before the Fed Pivot. After the pivot however, panic will occur and there will be blood on the streets.
You have been told.
P.S Not financial advice.
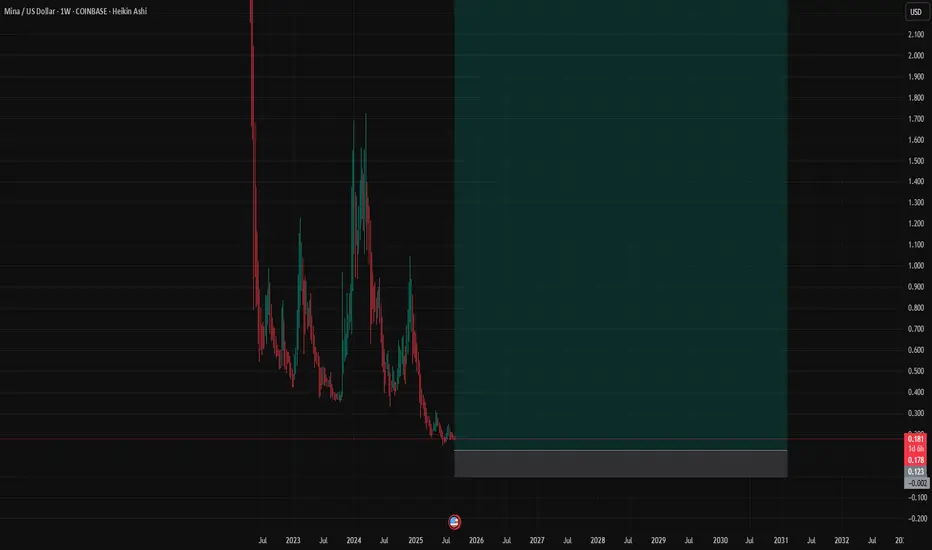
Mina Protocol - Game Changer?I'm not going to talk about that too much and I don't like to paint on chart.
this is something can be game changer in your wallet
BTC – Fakeout Before the Big Breakout!Bitcoin has been repeating a familiar pattern:
- Fakeouts below key support zones, trapping early sellers.
- Breakouts back above structure, followed by strong impulsive moves.
We’ve already seen this sequence twice in the past months, and BTC might be setting up for it once again. Price faked out below support, reclaimed it, and is now eyeing a breakout from the falling channel.
🔁If history rhymes, the next leg could trigger a powerful impulse toward new highs. Traders should keep an eye on the $112,000–$114,000 zone — a breakout from here could be the spark for the next rally.
Is BTC about to repeat its playbook? 👀
📚 Always follow your trading plan regarding entry, risk management, and trade management.
Good luck!
All Strategies Are Good; If Managed Properly!
~Richard Nasr

Zoom out Ethereum $ETHEthereum seems to be repeating the process that started the 2016-2017 mega run.

Is this the End of this Bull Cycle?BTC had a tremendous price gain in this current Bull run where as of writing; a YTD gain of 17.41% and YoY at 71.07%.
When the historical performance is considered in the past Bull runs, it can be observed that BTC has reached its ATH in each cycle within 510 to 550 days from the date of BTC halving.
2017 ATH : 526 days from July 9, 2016 halving
2021 ATH : 546 days from May 11, 2020 halving
Current Cycle (as of 26/08/2025): 493 days from April 20, 2024 halving
We are slowly reaching the region in time where BTC reaches its final ATH for the current cycle, marking the start of the bear run. Based on the historical behavior, this region lies within mid-September to end-October for this cycle . The major difference compared to other cycles is that we had a very late Altcoin season in this Bull run . This is mainly due to institutional adoption of BTC and ETH mainly with the introduction of ETFs (Exchange Traded Funds). 2021 Bull run had roughly a 314 day Altcoin season and if this cycle ends in the above region as expected, we will only see a standard Altcoin season only to somewhere between 80 to 110 days.
Also, during the same cycle as the Altcoin season started BTC.D (Bitcoin Dominance) fell from ~60% to ~46% within a span of 35 days and currently we can see the same action starting from the second week of August 2025. This further shows that there's a considerable portion of the altcoin season or the current Bull Cycle to remain intact at least until the BTC.D falls into mid 40%.
But with the current general market sentiment in the overall crypto market, with institutional adoption, oncoming of Solana and XRP ETFs, expected US rate cuts and a US president who is very positive on crypto and profiting well off from it, there is a possibility that this cycle might see an extension.
Even with all these positives, there is a considerable probability that we have already achieved the final ATH for this season. Most people are cautious on a recession with Trump tariffs, increasing US inflation, weakening labor market, possibility of an AI bubble breakout and high frequency of geo-political wars.
Also, the current price action momentum is in a weakening phase. The last two momentum bringing news were unable to maintain the price levels and break resistances. The CPI relief data on 12th August and Jerome Powell's hint on rate cuts at the annual economic policy symposium in Jackson Hole on 22nd August, both triggered a bullish price action which were unable to achieve consolidation at higher price levels. This further shows the uncertainty of the sentiment of the current market.
Current prices are heavily dominated by the derivatives market where OI (Open Interest) reached ATH for most crypto including BTC and SOL within this month. But the funding rates are not explosive unlike the euphoric states we've seen before, which confirms that the market is not over-leveraged as used to be in the past at this phase of the Bull Cycle.
In overall, we are at the last phase of the Bull run whether it gets played as expected or whether it gets extended by few months. Simply, this is the stage where people think BTC will never see 60,000 again.
Don't let delusion take over your strategy. Make sure you bags are ready to be booked into profits and with proper stop losses in place for sudden surprises.

ETHEREUM SEASON LOADING!Ethereum appears to be literally following bitcoin's pattern ahead of its 2021 bull run

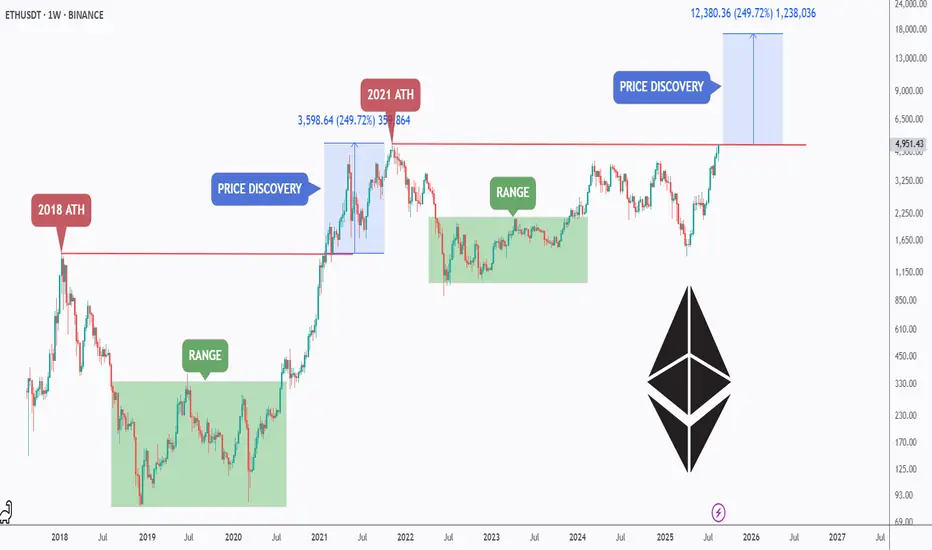
ETH – History Doesn’t Repeat, but It Often Rhymes!Ethereum has officially broken out above its previous ATH structure, entering a new price discovery phase.
📅 In 2018, ETH peaked, then spent years consolidating in a broad range before launching into the 2021 bull cycle.
Once the 2018 ATH was broken, ETH rallied nearly +250% in discovery mode, printing its 2021 ATH.
🏹After another extended range, ETH is now repeating history: breaking out again with room for another price discovery rally.
⏱️If ETH mirrors the last cycle’s percentage gain, the next optimistic target sits around $17,000–$18,000, aligning with a potential +250% leg from current breakout levels. 🚀
Cycles may not repeat perfectly, but they often rhyme — and Ethereum’s structure suggests we could be on the verge of another explosive move.
What do you think — can ETH surprise the market again this cycle? 👀🔥
📚 Always follow your trading plan regarding entry, risk management, and trade management.
Good luck!
All Strategies Are Good; If Managed Properly!
~Richard Nasr
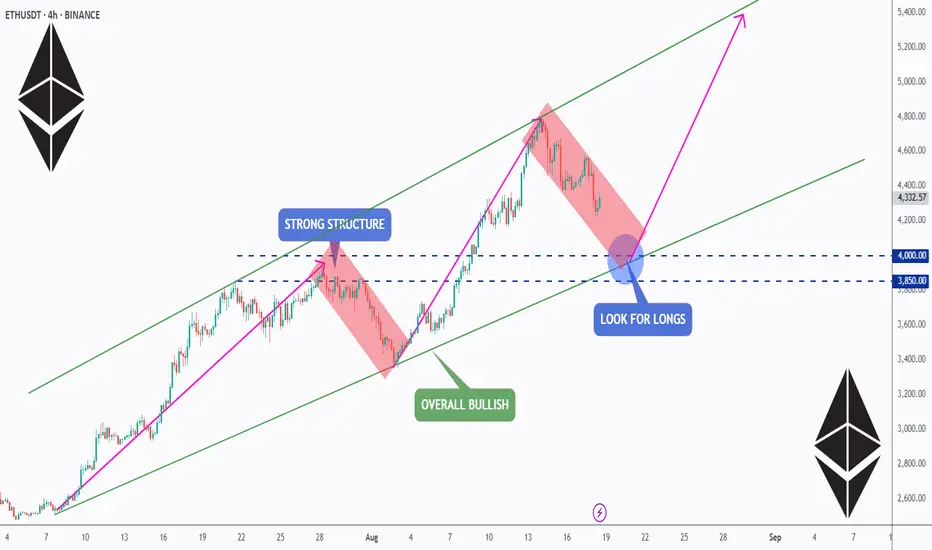
ETH Setup: Retest, Reload & Rally?ETH is pulling back after a strong run , but the bigger picture stays bullish. 📈
The $3,850–$4,000 zone is key — a solid structure + channel support. 🔑
If buyers step in here, we could see the next leg toward $5K and beyond. 🚀
Watching closely… time to retest, reload, and ride the rally? 👀
📚 Always follow your trading plan regarding entry, risk management, and trade management.
Good luck!
All Strategies Are Good; If Managed Properly!
~Richard Nasr
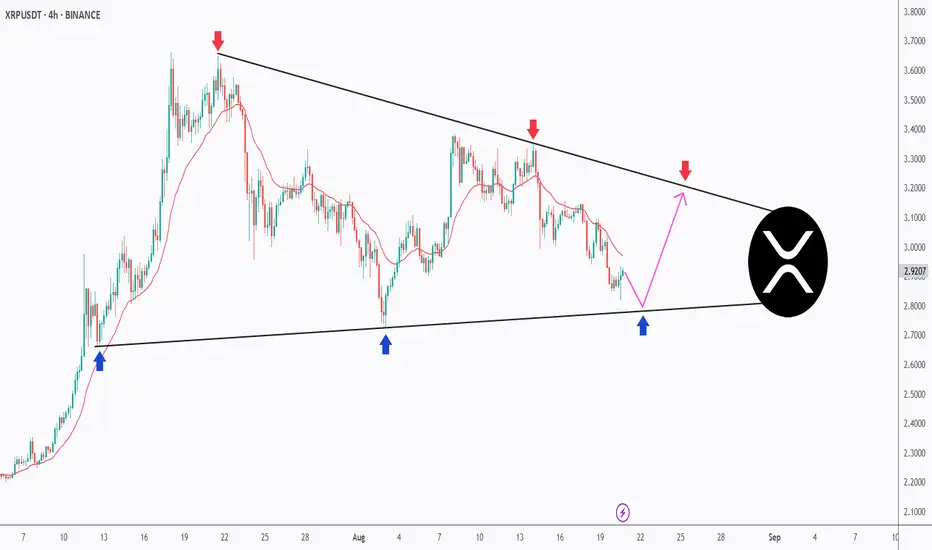
The Perfect Triangle – XRP’s Setup of the Month!XRP has been coiling up inside a textbook symmetrical triangle on the 4H timeframe.
🔻 Sellers are defending the descending trendline (red arrows).
🔹 Buyers keep stepping in at the rising support (blue arrows).
📉 Price is now retesting the lower bound, and as long as this zone holds, we can anticipate a potential bounce back toward the upper boundary.
🚀 A breakout from this formation will likely define XRP’s next major move — either continuation higher or a bearish breakdown.
This clean structure makes XRP one of the most exciting charts to watch this month!
⚠️ Disclaimer: This is not financial advice. Always do your own research and manage risk properly.
📚 Always follow your trading plan regarding entry, risk management, and trade management.
Good luck!
All Strategies Are Good; If Managed Properly!
~Richard Nasr
ACHUSDT - SPOT SETUP🚀SPOT - @Alchemy @AlchemyPay @binance
🔥 Buy Zone: $0.02041 - $0.02051
🎯 TP1: $0.02142 | TP2: $0.02169 | TP3: $0.0226
Always DYOR before this...

ETH - Eyes on a New All-Time High?ETHUSDT has been on fire lately, following a textbook bullish structure of Impulse → Fakeout → Impulse.
After breaking above the previous range in July, ETH confirmed strength with a sharp impulse move, only to shake out weak hands via a fakeout retest before pushing higher again. 📈
Currently, ETH is in the midst of another impulsive leg, with the next major target sitting at the ATH around $4,876.
📊 Key Notes:
- Fakeouts have served as liquidity grabs before strong rallies 🏹
- Current momentum favors the bulls 🐂
- As long as price holds above the last breakout zone (~$4,050–$4,150), the path of least resistance remains up.
🎯 Next Stop: ATH and beyond if bullish pressure sustains.
📚 Always follow your trading plan regarding entry, risk management, and trade management.
Good luck!
All Strategies Are Good; If Managed Properly!
~Richard Nasr

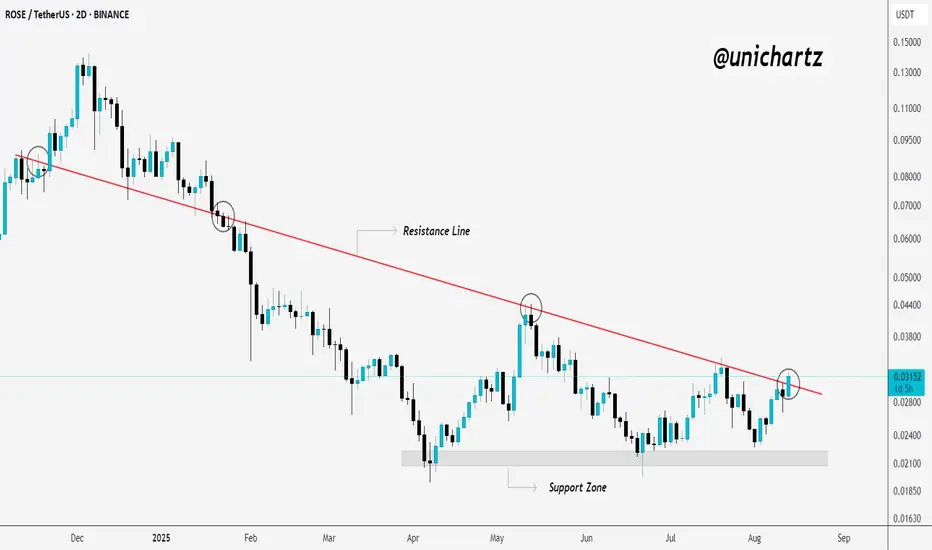
Triple Bottom Power – ROSE Eyes Explosive Upside!$ROSE/USDT has formed a triple bottom pattern, signaling strong buying interest at the support zone. Price is now testing the key descending resistance line.
If it manages to close decisively above this level, we could see a strong upside move.
Until then, keep it on your watchlist and monitor closely for a breakout confirmation.
DYOR, NFA
ETH ROAD TO 20K+I think we are getting closer to the final accumulation stage on ETH.
We can see a potential shape of huge channel in log scale.
After forming median of the channel I would like to see a big and fast correction near 30% from here towards 2900 support which must hold imo.
After that test of smthg around 3600 rgion and double bottom would be the best option just before few months of consolidation before breaking up and starting blow off top part.
Top of that channel depends on timing so the later the better I guess.

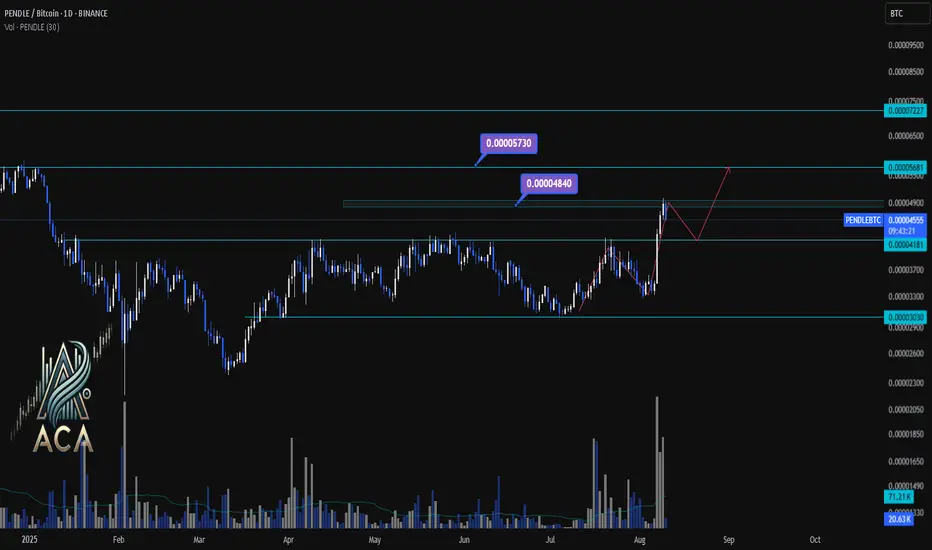
PENDLE/BTC Daily Chart Analysis | Momentum Building for the NextPENDLE/BTC Daily Chart Analysis | Momentum Building for the Next Move
🔍 Let’s dive into PENDLE/BTC and highlight the current technical landscape with key areas to watch for traders.
⏳ Daily Chart Overview
PENDLE/BTC recently broke above a multi-month resistance near 0.00004500, confirming strong bullish momentum on the daily timeframe. Volume surges are supporting this upward move, indicating increased market participation and renewed interest from buyers.
🔺 Bullish Scenario:
If the uptrend continues, look for a push toward the first target:
- 0.00004840 (major supply/target zone)
- On further strength, 0.00005730 is in sight as the next resistance.
Expect short-term consolidation or minor pullbacks before any strong breakout.
🔻 Bearish/Consolidation Scenario:
If sellers step in or the rally loses steam, support is found at:
- 0.00004181 (immediate level)
- If this breaks, look for deeper retracement toward 0.00003300 (structural support).
📊 Key Highlights:
- Daily breakout from a consolidation range signals bullish continuation potential.
- Volume spikes confirm genuine buyer interest at current levels.
- Major upside targets: 0.00004840 and 0.00005730.
- Critical downside supports: 0.00004181 and 0.00003300.
- Price action may oscillate (range/consolidate) between the support and resistance before a major move.
🚨 Conclusion:
Momentum favors bulls as long as price holds above 0.00004181. Watch for a confirmed breakout above 0.00004840 for additional upside. Stay nimble—volatility will likely provide both breakout and pullback opportunities.
Keep an eye on PENDLE/BTC and PENDLE/USDT📈📊
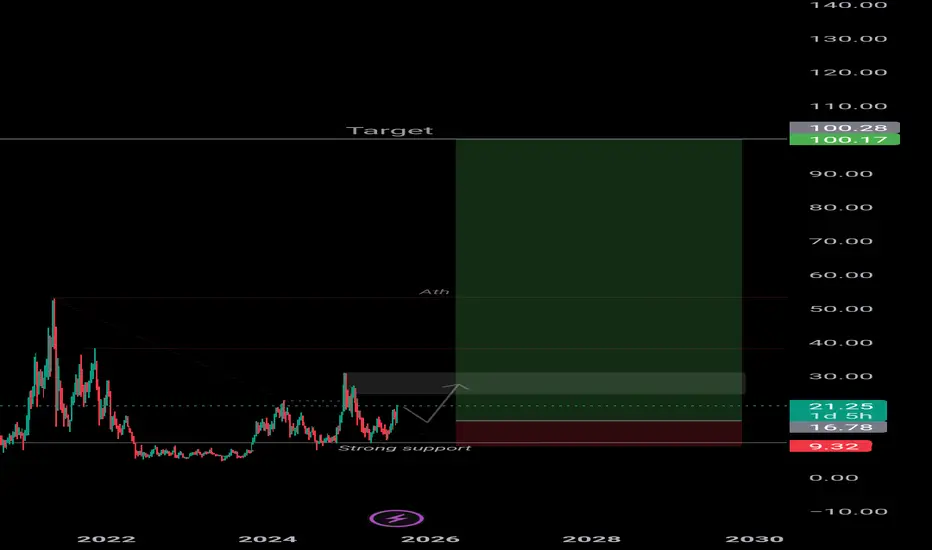
Link Bull Run CRYPTOCAP:LINK Final Target 100$ this cycle‼️‼️
Set-up 👇
Holding above $16–$17 keeps the door open for $35, $50… maybe even $100 this cycle.
Spot Buy zone : 17$ - 14$
Tp & sl : Chart ✅
CRYPTOCAP:LINK
HYPE/ USDT 100$ SOON GETTEX:HYPE is looking 🔥! Ready for that breakout to the $100 club 🚀🚀
Structure stays bullish, and a confirmed breakout here could ignite the next big rally.
Keeping SL at $36 to lock in risk management while letting the upside run.
Eyes on GETTEX:HYPE … this move could be massive! 💥
