TradeCityPro | Bitcoin Daily Analysis #139Welcome to TradeCity Pro!
Let's go over Bitcoin's analysis. Today, Bitcoin is showing some signs regarding its next move, and today could be a critical day — especially considering that U.S. interest rate data is set to be released tomorrow.
4-Hour Timeframe
Today, there’s no need to switch to other timeframes — this 4-hour chart tells us everything.
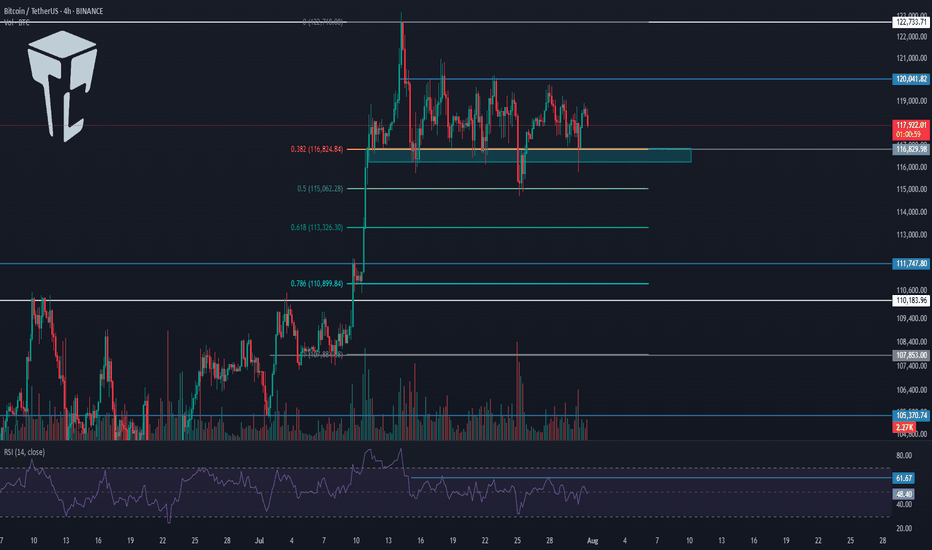
Yesterday, the price was moving toward the 120041 area, which we intended to use as a long trigger, but that didn’t happen. The price failed to stabilize above this level, and RSI was rejected from the 61.67 zone.
Currently, the price has formed a lower high compared to 120041 and is now moving toward the support area around 116000.
Selling volume has significantly increased, which is not good for the bullish trend. If this support level breaks, deeper corrections to the 0.618 or even 0.786 Fibonacci levels could occur.
I’ll take profit on my long position that I opened from below 110000 if the price stabilizes below this zone, but I absolutely won’t open any short positions for now.
In my opinion, as long as the price is above 110000, any drop or correction is simply a better entry point for a long position. However, we shouldn’t buy during a falling market — we must wait for our triggers to activate.
Bulrun
TradeCityPro | Bitcoin Daily Analysis #140👋 Welcome to TradeCity Pro!
Let’s dive into the Bitcoin analysis. Yesterday, the interest rate decision by the US Federal Reserve was announced, and once again, just like the past few months, it remained unchanged. Let’s see what impact it had on Bitcoin.
⏳ 4-Hour Timeframe
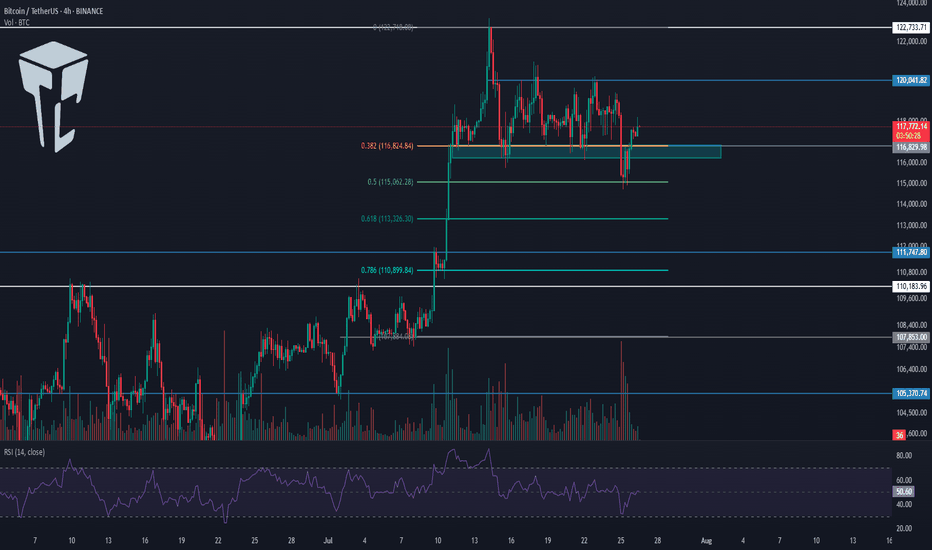
In the 4-hour timeframe, after the announcement of the unchanged interest rate and Powell’s speech, Bitcoin printed a red candle on the support zone and even wicked lower, but then recovered and the price returned back into the box.
✔️ Basically, we can say that this month’s rate decision had no real impact on the market, and Bitcoin is still moving inside its range box. The fact that the support zone wasn’t lost is a positive sign for the continuation of the trend.
⭐ But the important point is this: if the uptrend is going to continue, the price must print a higher high or at least a level equal to 120041, and in my opinion, if for any reason a lower high gets printed, the chances of breaking below 116829 significantly increase.
📊 I currently have no new position on Bitcoin, and all my entries are below 110000. But if 120041 breaks, I’ll open a long position for the next bullish wave that Bitcoin might start.
💥 A major trigger for starting a new leg is the 61.67 level on the RSI. As long as RSI remains below this level, there’s no bullish momentum in the market — and considering that the number of touches to 116829 has increased, the probability of a correction is also rising.
❌ Disclaimer ❌
Trading futures is highly risky and dangerous. If you're not an expert, these triggers may not be suitable for you. You should first learn risk and capital management. You can also use the educational content from this channel.
Finally, these triggers reflect my personal opinions on price action, and the market may move completely against this analysis. So, do your own research before opening any position.
TradeCityPro | Bitcoin Daily Analysis #137👋 Welcome to TradeCity Pro!
Let’s go over the Bitcoin analysis. I’m making a change to how I analyze Bitcoin — I will no longer include indicators like dominance charts.
🔍 From now on, I’ll be analyzing Bitcoin in daily, 4-hour, and 1-hour timeframes only.
📅 Daily Timeframe
On the daily timeframe, Bitcoin is in a strong uptrend that started from the 78,397 level and in two bullish legs has reached the 122,733 zone.
✅ This level, along with the 0.618 Fibonacci Extension, has created a strong resistance zone. Although price has attempted multiple times to break into or above this area, it has not yet succeeded in closing a candle above or inside the range.
🎲 We also have a curved trendline from higher timeframes, which the price is reacting to even on the daily chart. Currently, the price is near this trendline. There is a possibility that price consolidates over time until it reaches this trendline and then begins its next bullish leg.
📊 If that happens, breaking 122,733 or 120,140 would be triggers for opening a long position on the daily timeframe.
I do not recommend buying Bitcoin on spot right now, because I believe we’re close to the top of this bullish cycle, and this current leg might be the last one.
⭐ A breakout of 76.50 on the RSI would be a strong confirmation of bullish momentum, and would mark the continuation of the uptrend.
🔑 If we get a pullback, the price could correct to dynamic zones like SMA25 or SMA99. Important static support levels are at 110,183 and 100,763.
⏳ 4-Hour Timeframe
In the 4-hour chart, we can see more details of the bullish leg. After the sharp move to 122,733, a correction phase began, forming a range box.
💥 The bottom of the box is around 116,829, which I’ve marked as a zone. It also overlaps with the 0.382 Fibonacci, making it a very important PRZ (Potential Reversal Zone).
The top of the range is at 120,041.
🧩 Yesterday, price made a fakeout to the downside. As you can see, it dumped hard with heavy selling volume and hit the 0.5 Fibonacci level, but couldn’t hold there and quickly bounced back above 116,829.
🧲 Today, I think it's better not to go below the 4-hour timeframe and avoid getting caught up in small market noise.
A break above 120,041 can trigger a long entry.
Another breakdown from the box might trigger a deeper correction.
❌ Disclaimer ❌
Trading futures is highly risky and dangerous. If you're not an expert, these triggers may not be suitable for you. You should first learn risk and capital management. You can also use the educational content from this channel.
Finally, these triggers reflect my personal opinions on price action, and the market may move completely against this analysis. So, do your own research before opening any position.
SUSHI Ready for the big JUMP? SUSHI
Ready for a big move.
The momentum slope in the chart is increasing, indicating that the buying power is strengthening and effectively eliminating the sellers.
If you haven't been following SUSHI so far, you can monitor its progress after it breaks the resistance at 2.590 . For the short-term timeframe, a rise to the resistance box between 4.500 and 5 dollars is reasonable. However, for the long term, SUSHI needs to reach the range of 4 to 4.5.
Again, it is remembered that all trades that are opened are your responsibility
Don't forget to follow.
XLM go up to 6.50?"Stellar" the cryptocurrency that has captured everyone's attention with its over 480% increase in recent weeks! Given its market cap rank of 16, this coin holds significant importance. However, it’s important to consider that the current market cap volume may make continued upward movement more challenging compared to other coins. Therefore, if you're considering a purchase, it’s advisable to allocate only a small percentage to this coin, as it is currently near its all-time high and poised for another push.
This is just a personal perspective on this coin and its future until 2026. Based on tools and calculations related to market cap, the maximum growth potential indicated for this coin is up to $2.3840. However, if many investors commit to this coin, it could reach $6.50. Yet, logically, its maximum growth is anticipated at $2.3840.
First target: $0.71
Second target: $2.3840
Third target: $6.50
In the short term, it could be a good option, as it shows strong momentum with corrections in its trend.
Don't forget to follow, dear friends!
I hope this analysis is useful for you."
Feel free to let me know if you need any further assistance!
Bitcoin technical analysis _ 2023-10-26
Long position
After breaking the resistance at the price of 24851
Entry 35170
The loss limit is 34,200
Risk Free 36145
Saving profit 37110
Profit limit 37645
-----------------------------------------------------
Short position
After breaking the upcoming support and breaking the short-term uptrend line and also after breaking the important support at the price of 33645
Entry 33355
The loss limit is 34,200
Risk Free 32512
Profit limit is 31600
$BTC topping out to correction before BULLs take over againOn todays chart we have defined the major waves that are creating the $BTC fluctuations.
The strongest wave is 20W (140D) according to a great tool "DFT - DC Period 8-50 - John Ehlers " .
We have drawn this cycle on the chart along with its harmonics, which clearly synchronise with the main wave.
From the analysis we expect now a final rise lasting to 25-27th of February 2023.
After that we should see little stabilisation for one week, then followed by stronger correction between 6-20th march 2023.
The drop will be significant however we are still on the rising trend of the major 20M (80W) so after 20th of march we should get into new highs.
BTC: Bullrun not before February !#BTC/USDT Update:-
$BTC currently trading at $46000
1. The 50MA in 4h chart did not hold
2. It seems that we are going to the Wickoff's spring around 43K (0.382fib) where we can entry for a short run till 53K (0.618fib) before being rejected by the 200MA
3. The consolidation phase will last a while (same if we compare to may 2021) before the 50MA cross the 200MA. We will navigate around the 0.382fib probably till end of January, beginning of February where we will see a big bullrun.
Short term - 43k
What do you think ?
Please click LIKE button and Appreciate my hard work.
P.S If you are interested in real time updates on your cryptos, please let me know.
Thank you.
Bitcoin Major ABCD Pattern (MAJOR TREND IDENTIFICATION)
Personally, I believe Bitcoin is following the ABCD pattern shown below. At the second bull run, the price peaked perfectly at the 61.8% fib level and almost immediately bounced off,
Both this and the fact that the price has followed the C-->D line has led me to believe that the price is following a hybrid ABCD pattern and the D point will bounce off the 71.8% fib (marked D) either shortly after, or directly on the halving and a bull run will follow (up to $90,000-$100,000).
If the major support zone is broken (shown as the red zone) it will further prove my point that bitcoin will crash further (continuing current trend) prior to the halving.
Ofcourse is it speculation, a hybrid ABCD pattern is uncommon but the price has followed the pattern almost exactly.


