Waiting for a signal above 1.172, EURUSD ready to break outHello everyone,
On H1, EURUSD recently dropped to 1.169 before bouncing back with a long lower wick – a sign that buying support is still present. Price is now pressing the Ichimoku cloud edge, near the 1.170–1.171 balance zone. Above, there is a layered FVG supply from 1.172 → 1.176–1.178; below are supports around 1.169–1.168, deeper at 1.166 (old FVG bottom).
My technical view: I lean slightly bullish as long as price stays above 1.168. If an H1 candle closes above 1.1715–1.172 (fully escaping the cloud), the retracement could push up to 1.174 and test 1.176. Conversely, a close below 1.166 would signal weak rebound momentum, with a risk of returning to 1.162.
Regarding news, this week is quite heavy with US PPI today, US CPI tomorrow, followed by jobless claims and the ECB press conference. If US data is soft, the USD may ease, providing tailwind for EURUSD to break 1.172–1.174; hot data could increase supply pressure above, likely dragging price back to 1.169–1.168 to test buying strength.
What about you? Do you think EURUSD will break above 1.172 immediately, or will it revisit 1.168 first? Comment below with your view!
Buy-sell

GBP/JPY: Approaching 195 – waiting for a breakoutHello everyone,
GBP/JPY is currently trading around 194.33, approaching resistance at 195.00. On H4, the price structure still maintains higher lows and higher highs, showing that the bullish momentum has not weakened. However, to confirm a strong breakout towards 196.30 – 199.00, price needs to close an H4 candle above the 195.00 area.
Technically, support is near 193.90 – 194.00, resistance at 195.00 – 195.60. If 195.00 is not breached, price is likely to move sideways, consolidating around 194–195 before finding the next driving force.
From the news perspective, the BoE emphasizes the possibility of rate cuts if inflation continues to decline, putting mild pressure on GBP. Meanwhile, the BoJ keeps rates low, but expectations of future policy adjustments give JPY a chance to appreciate, affecting the pair.
In summary, my view prioritizes a bullish scenario if price breaks 195.00, aiming for 196.30 – 199.00; if not, price may range around 194–195.
What about you? Share your view in the comments!

Gold: News Tailwinds, Trend Stays Strong – Target 3,670 → 3,700Hello everyone, let’s analyse OANDA:XAUUSD today.
Current news provides strong support for gold. Expectations of a Fed rate cut remain firm, with notable inflows into gold ETFs over the past month, especially low-cost, long-term strategic funds. Meanwhile, weak Asian macro data (Japan’s GDP, China’s trade) has added to safe-haven demand.
On the 2H chart, the uptrend remains clear: price holds above the rising Ichimoku cloud, with demand FVGs stacked like “steps” below. The recent top sits around 3,645–3,650, while supports are layered at 3,628–3,618, 3,605–3,595, and deeper at 3,580–3,565 (cloud edge).
I lean towards gold consolidating just under 3,650 before breaking towards 3,670–3,685; if momentum holds, price could stretch to 3,700–3,715. This view only weakens if 2H candles close below 3,595 (signalling a dip to 3,580–3,565), and turns negative if 3,565 breaks (risking a slide to 3,540–3,525).
Key drivers to watch are US CPI/PPI and the 10Y yield; continued yield decline would make a break above 3,650 even more convincing.
Do you think gold can reach 3,700? Leave me a comment and let me know!

Gold: Shallow pullback, target remains 3.65xAfter the BLS labour revision, gold on the H1 chart went through a sharp two-way move. Normally this release isn’t a big market driver, but this year it acted as a strong catalyst, causing heavy swings.
The uptrend structure is still intact: price is holding along the Ichimoku edge, each higher low confirms buyers are active, and there’s an FVG layer supporting near 3.62x. If a stronger sell-off comes, 3.60x around the cloud body remains a familiar magnet for balance.
From the macro side, today’s US PPI and tomorrow’s CPI, alongside jobless claims and the ECB press conference, will be key. Softer data could weigh on yields and the dollar, giving gold the tailwind to retest 3.64x–3.65x, with possible extension to 3.66x–3.67x. On the contrary, hot data risks dragging the metal back to 3.62x or even 3.60x before resuming higher.
My bias still favours a shallow retracement as long as 3.60x holds. The 3.64x–3.65x band is the near-term lid: a firm candle close above strengthens the breakout case. Before the data, though, I’d rather wait for candle confirmation than chase intra-bar spikes.
What about you? Do you think gold will break above 3.65x in this move, or will it need another balance around 3.60x first? Share your view below.

EUR/USD: Mild Uptrend Remains FavouredHello everyone, EUR/USD is showing technical improvement after several days of consolidation. On the H4 chart, the pair has broken out from the previous sideways zone and currently hovers around 1.171, following a bounce towards 1.174–1.175. The short-term structure has turned more positive: higher lows, price above the thin Ichimoku cloud, and three layered demand FVG boxes below 1.1685 → 1.1660 – a clear sign of active buying. In the near term, 1.174–1.175 remains immediate resistance, while 1.170–1.168 acts as a “magnet” during market fluctuations.
On the news front, the focus this week is the US CPI/PPI data, which directly affects USD and yields, alongside the ECB meeting where commentary on inflation and growth will influence EUR interest rate expectations. Currently, US easing expectations slightly outweigh European ones, giving EUR/USD a mild tailwind for upward movement.
My view: EUR/USD leans towards a mild bullish scenario, prioritising shallow pullbacks above 1.168 before retesting 1.174–1.175. A successful break of this cluster could see momentum extend to 1.180–1.185. Conversely, a close below 1.166 on H4 would weaken the bullish case, potentially returning the market to a broader sideways range.
How do you see EUR/USD unfolding next? Share your thoughts in the comments.

Gold Outlook: Consolidation Before the Next Rally?👋 Hello traders, what’s your view on OANDA:XAUUSD ?
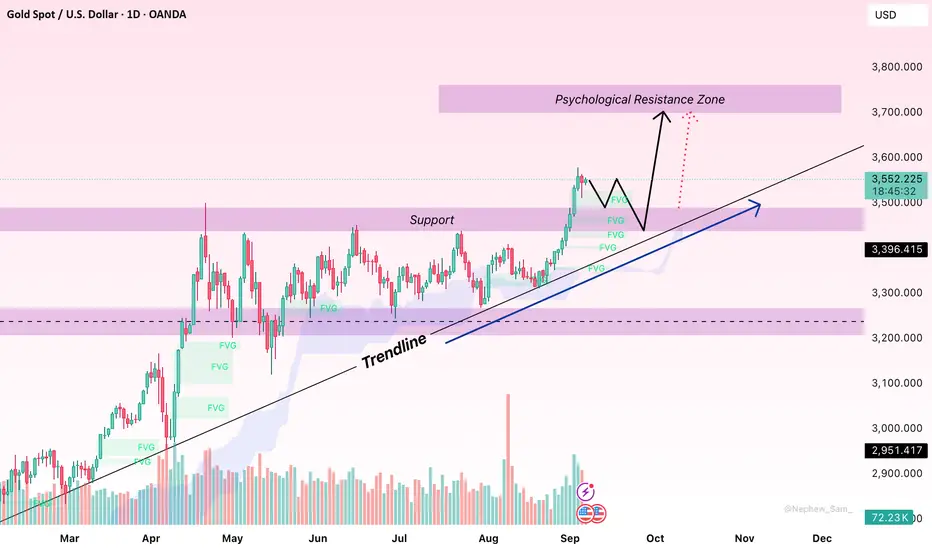
Gold continues to move within a medium-term ascending channel , and the current Rising Wedge pattern shows that buyers are still in control. Recently, price has repeatedly bounced off the lower support trendline, confirming that strong demand is maintaining the uptrend.
At the moment, gold is testing the $3,600 level – both a technical and psychological barrier. I expect some short-term consolidation within this wedge before another push higher.
👉 As long as price holds above key support zones and remains inside the channel, the bullish scenario remains intact. A successful breakout above $3,600 could open the way towards $3,620 – $3,640 , then $3,700 , and if momentum accelerates, even $3,900 in the medium term is on the table.
📌 The primary trend is still bullish . Buyers just need one more catalyst to ignite the next strong wave.
What do you think? Can gold break past $3,600 and move higher? Share your thoughts in the comments!

Gold: Eyeing a Break Above 3,600Hello everyone, gold is approaching a critical juncture where both fundamentals and technicals appear aligned in favour of further upside.
Weak US labour data combined with growing expectations of a Fed rate cut in September have weighed on yields and the dollar, creating a supportive backdrop for gold. The next key catalysts lie in US inflation prints (CPI/PPI). As long as easing expectations dominate, the metal enjoys a clear tailwind.
From a technical perspective, the bullish structure remains intact: price is holding firmly above the Ichimoku cloud with solid demand layers at 3,565–3,555 and 3,545–3,535. The 3,595–3,600 zone is the immediate psychological barrier, yet selling pressure looks insufficient to derail the trend.
My view: gold is likely to push through 3,600 soon, extending towards 3,615–3,630, with potential to reach 3,650 if momentum holds.
Do you think gold will clear 3,600 decisively this week? Share your thoughts below.

EURUSD Approaching 1.18 – Buyers in ControlEURUSD continues to show a firm upward bias on the daily chart. Price remains above the Ichimoku cloud, with Tenkan crossing Kijun and the cloud’s leading edge widening; Chikou Span hangs above recent candles, reinforcing bullish momentum. Since August lows, the pair has consistently made higher lows and is now pressing against the 1.176–1.180 zone. Support is clearly seen at FVG clusters around 1.166–1.168 and 1.158–1.161, with pullbacks absorbed swiftly by buying pressure.
Immediate resistance lies at 1.176–1.180; a daily close above this could accelerate movement towards 1.183–1.185 and potentially 1.190–1.195. On the downside, 1.170–1.168 acts as a short-term equilibrium. Only a close below 1.166 would signal weakening momentum and increase the risk of sliding back to 1.161–1.158.

US100: Is the Bullish Trend Gaining Momentum?CAPITALCOM:US100 The price is currently trading within a well-defined ascending channel , with price action consistently respecting both the upper and lower boundaries. Recently, buyers have taken control, indicating the potential for continued upward momentum.
Given the strong bullish momentum right now, there's a high likelihood that the price will break through the key resistance zone. If this happens, the price may retest the support level before pushing higher. A successful retest would strengthen the bullish structure, opening up the possibility to reach the target of 25,100 , aligning with the upper boundary of the channel.
However, if the price fails to break above resistance, it could signal weakening bullish momentum, leading to a deeper pullback toward the lower boundary of the ascending channel.
Always remember to confirm your setups and manage your risk appropriately.
Good luck and trade safely!

EURUSD – Weakness Signals from the Diamond PatternHello everyone, what’s your view on EURUSD’s trend?
On the H4 chart, EURUSD is showing signs of imbalance after forming a Diamond Top pattern – a structure that often indicates bearish reversal. Price is currently stuck within the boundaries and has yet to show convincing breakout momentum.
If the lower boundary breaks, selling pressure could intensify, opening the way toward 1.1400, a key support zone. This outlook is further supported by the firm strength of the USD, backed by rising bond yields.
On the flip side, a breakout above the upper boundary would invalidate the bearish scenario.
The short-term bias still favors the sellers. Do you think EURUSD will soon slide toward the 1.1400 zone?

Bearish Setup Forming on AUDNZDHello everyone, what do you think about AUDNZD?
Recently, the market has shown an impressive rally, pushing straight into a key resistance zone. This is exactly the type of resistance I pay close attention to, and one that has appeared multiple times in my past analyses.
The reaction here is quite clear: price has slowed down, showing strong signs of hesitation. What interests me is not only the candlestick structure but also the volume behavior – a factor that often strengthens the conviction of whether we’re looking at a reversal or continuation.
With the current setup, my target is around 1.0990.
What’s your view on this scenario? Share your thoughts in the comments – exchanging ideas with the community is always a great way to grow as a trader.

GBPUSD uptrend remains intactAfter sliding down from the channel top, GBPUSD touched the lower boundary and bounced back sharply, leaving a long wick behind. This is not just a technical signal, but also clear evidence that buyers are still firmly defending the uptrend.
If the recovery holds, the next target will be around 1.3592, with the potential to even break above the channel top and extend the bullish momentum further.
On the other hand, a decisive close below the lower boundary would flip the script, putting GBPUSD into a short-term bearish move.

XAUUSD: Buy to Win?Hello everyone, what’s your view on OANDA:XAUUSD ?
Looking at the H1 chart, the price action continues to tell a compelling bullish story. Each interaction with key levels has sparked notable moves in line with the trend.
Most recently, the reaction at a strong support zone showed a clear rejection. This could be an important clue, suggesting that buyers are still present and defending the uptrend.
This is just my personal observation, not financial advice. Always double-check your setups and manage risk responsibly.

Gold: Profit-Taking Ahead of NFP, Main Trend Still BullishHello everyone, after a strong rally, gold has seen a short-term pullback. On the daily chart, this looks more like profit-taking near all-time highs rather than a genuine reversal. The broader structure remains intact: price is holding above the Ichimoku cloud, the Kijun is sloping upward, and stacked demand FVGs just beneath price signal a healthy uptrend.
In terms of levels, nearby resistance is at 3,555–3,565. A daily close above could naturally open the path toward 3,600–3,620. On the downside, the key buffer lies at 3,525–3,510 (cluster of FVGs + upper cloud edge). Only if a daily close breaks decisively below 3,510 would a deeper correction toward 3,480–3,450 become significant.
News flow also contributes to the pause: ETF outflows and caution ahead of NFP have capped momentum. Still, with safe-haven demand intact (as labour and PMI data hint at economic risks), I see this more as a “lock profit” phase than a trend change.
NFP Scenarios: If data comes strong (USD/yields ↑), gold may retreat toward 3,525–3,510; losing this zone could extend to 3,480–3,450. Conversely, if data is weak (USD/yields ↓), the chance of breaking 3,565 is high, opening the door to 3,600+.
In short, the major trend remains bullish as long as 3,525–3,510 holds. After NFP, a daily close above 3,565 would confirm trend continuation.
What do you think – will gold break 3,565 straight after NFP, or first retest support before heading higher?
Bitcoin (BTC): Momentum Building – Targeting 116K to 120KBitcoin is currently consolidating around $113,094, having secured a decisive break above $112K that confirmed the bullish structure. On the 4H chart, higher highs and higher lows remain intact, with trading volume steady, signalling consistent demand.
Technical levels are clearly defined: resistance at 116K–117K and strong support around 112K–113K. Holding above 113K keeps the outlook constructive, with upside towards 120K increasingly likely.
Fundamentals also add weight to the bullish case. US-listed Bitcoin ETFs saw $364.3 million in net inflows last week, with BlackRock’s IBIT accounting for $156.5 million. Strategy Inc. (formerly MicroStrategy) has expanded its holdings to 638,460 BTC, valued at over $71.6 billion. Meanwhile, the US government has signed an order to establish a Strategic Bitcoin Reserve, positioning BTC as a national-level reserve asset.
Taken together, technical momentum and supportive flows suggest BTC could first retest 116K before extending towards 120K. Only a break below 112K would imply a corrective phase before resumption of the uptrend.

Gold battles for new highs.Hi everyone, Dorian here!
Gold continues to surprise as it hits the $3,600 mark for the first time in history, with an impressive 500-pip increase in just a few hours. This surge is driven by the weakening of the U.S. dollar and expectations that the Federal Reserve will cut interest rates this month.
On the chart, XAU/USD remains stable, currently hovering around $3,586. A new support level has formed, and after testing, gold may continue its upward trend. If this support level holds, I believe nothing will be able to stop gold from gaining momentum in the coming days, reaching new highs in 2025.
So, what are your thoughts on gold’s direction in the near future? Share your thoughts in the comments below!

Gold Uptrend – 3,563–3,575 Key to 3,600+Hello everyone, last week gold staged a strong rally, consistently building new steps upward, gaining around 50–60 USD from the 3,520 zone. On the H1 chart, the structure remains very clean: price is holding above the upward-sloping Ichimoku cloud, with layered FVG blocks beneath – clear signs that buying flow is still maintaining momentum. The recent dip only tested the edge of the cloud before bouncing back, leaving the trend intact.
The immediate key lies in the 3,563–3,575 cluster (a confluence of the 0.5–0.618 Fib and recent highs). A decisive H1 close above this area could open the path to 3,595–3,600, and further to 3,610–3,620. On the downside, nearby supports sit at 3,538–3,532, followed by 3,520–3,525. Structure would only turn weaker if price closes below 3,512 – in which case risks shift towards a broader consolidation phase.
In short, I still favour the scenario of a shallow pullback before continuation, as long as price holds above the cloud and the FVG floors.
What do you think – will 3,563–3,575 have the strength to unlock 3,600+? Feel free to share your view.

XAUUSD Gold Trading Strategy September 9, 2025XAUUSD Gold Trading Strategy September 9, 2025: Gold continues to rise, renewing its all-time high at $3,660/oz.
Fundamental news: Spot gold prices have surged and surged in the short term during today's Asian trading session (September 9), hitting a new record high of $3,660/ounce and showing no signs of stopping. CME's FedWatch tool shows that traders are now pricing in an 88% chance that the Fed will cut interest rates by 25 basis points this month and a 12% chance of a 50 basis point cut. Before the non-farm payrolls data, the probability of the Fed cutting 50 basis points in September was 0.
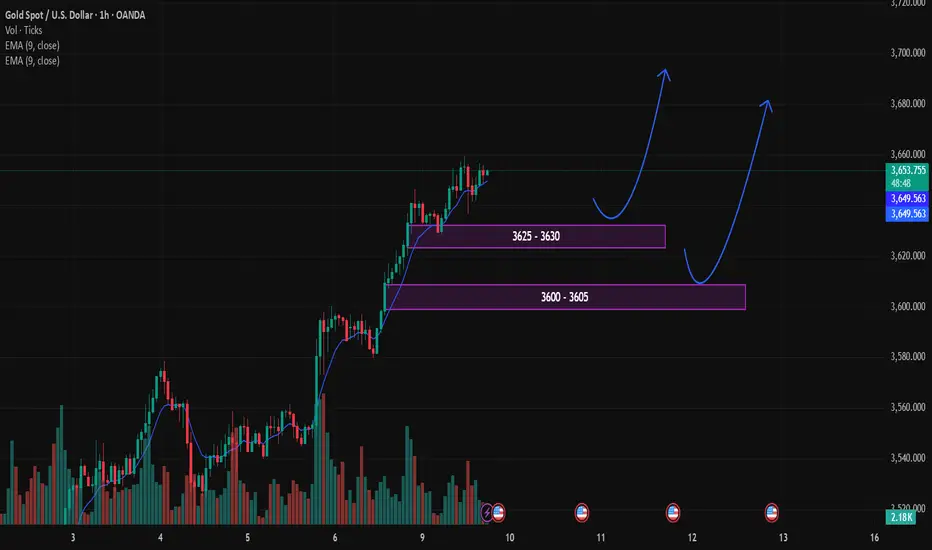
Technical analysis: Gold prices continue to rise strongly and show no signs of stopping. Currently, the price is still sticking to the MA20 on the H1 frame, we can trade short in this area. However, the priority will still be the support areas combined with the FVG area. If the gold price continues to increase and stay above the 3600 mark, this week the price may approach 3700 or 3800 with a very high possibility. This strong increase in gold, the areas that can be targeted may be 4300 - 4500.
Important price zones today: 3625 - 3630 and 3600 - 3605.
Today's trading trend: BUY.
Recommended orders:
Plan 1: BUY XAUUSD zone 3625 - 3627
SL 3622
TP 3630 - 3640 - 3660 - 3700.
Plan 2: BUY XAUUSD zone 3600 - 3602
SL 3597
TP 3605 - 3615 - 3650 - 3680 - OPEN.
Wishing you a safe, effective and profitable trading day.🌟🌟🌟🌟🌟
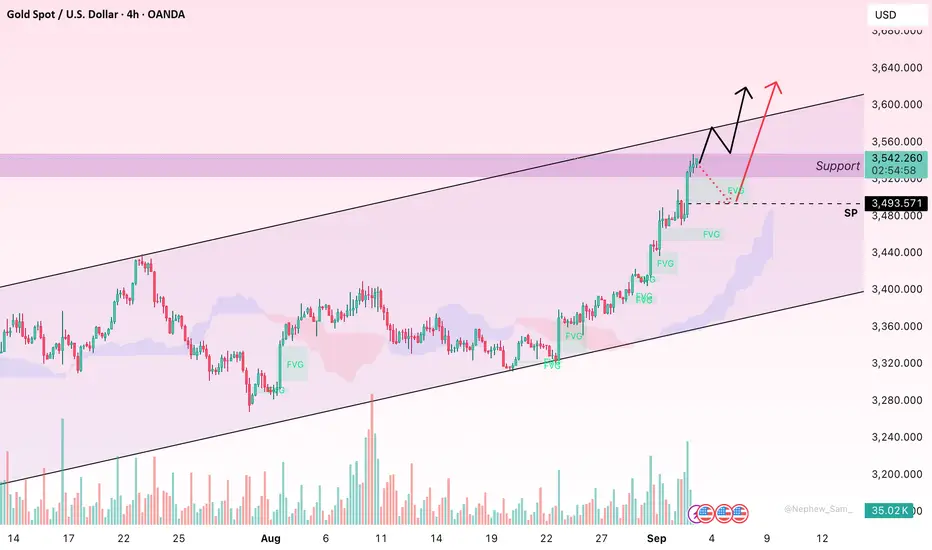
Gold Breaks New Highs, Momentum Still Favouring BullsHello friends, the past week has been quite rewarding for gold as it surged through major resistance levels and printed fresh highs. On the H4 chart, the trend looks very clear: price action is holding firmly above the Ichimoku cloud, with Tenkan sitting comfortably above Kijun, and the cloud slope widening further. Multiple Fair Value Gaps (FVGs) remain unfilled below, showing that buying momentum is powerful and liquidity is being left behind — a signature of a strong rally, not just a short-term move.
In terms of price action, the immediate resistance lies between $3,535–3,560. A clean H4 close above this area may unlock the next natural expansion towards $3,580–3,600. On the downside, layered supports are found at $3,520–3,505, then $3,485–3,470, and deeper at $3,440–3,420, coinciding with the upper edge of the cloud, often tested during medium-term uptrends.
Fundamentally, the environment still favours buyers: safe-haven demand is rising, the Fed is expected to ease policy sooner, and the USD is weakening, all adding fuel to the bullish case. Unless gold closes back into the cloud and loses the $3,440–3,420 zone, the probability of trend continuation remains high.
Do you think gold can stretch further from here? Share your thoughts below!
EURUSD: Higher Lows Signal a Potential Breakout?Hello everyone, Ken here!
EURUSD is looking quite interesting at the moment. Price has been consistently forming higher lows and seems to be heading toward multi-week highs, reflecting strong bullish momentum.
My expectation is for price to break above resistance somewhere near 1.1800, but first I’ll wait for a strong, confirmed candle to validate the breakout. Waiting for confirmation gives buyers a safer entry. My target would be in the 1.2XXX area, which looks completely achievable given the current market context.
That said, risks remain if the price closes strongly below the lower boundary of the channel. In that case, the bullish structure would be broken and a short-term downtrend could begin.
What’s your view?

Gold: Rally Holds After Weak NFP ShockHello everyone, the latest NFP report came in far below expectations (+22k jobs, unemployment at 4.3%), sending USD and yields sharply lower. Gold instantly broke higher, touching the 3,600 mark – a fresh all-time high. Markets now price in a Fed rate cut in September with strong conviction, fueling safe-haven demand.
On the H4 charts, the bullish setup looks intact: price remains above the Ichimoku cloud with stacked demand FVGs supporting below. The 3,595–3,600 area is the key pivot; a clean breakout would unlock 3,615–3,630 and potentially 3,650. Closest supports sit at 3,575–3,565 and 3,555–3,548, while only a daily close under 3,515 would signal weakness.
My bias favors a shallow pullback before continuation, as Fed easing expectations remain the main driver. As long as gold stays above 3,555–3,548, the path toward 3,600+ remains open.
What’s your outlook—do you expect new highs soon?

BTC: Profit-Taking Pressure and September RisksHello everyone, Bitcoin has faced strong volatility recently, influenced both by news flow and seasonal patterns.
From a fundamental perspective, the weak US NFP report initially supported a bounce as USD and yields eased. Yet, much of this reaction was already priced in, leading to quick “sell the news” behaviour. Meanwhile, spot ETF flows remain inconsistent, alternating between inflows and outflows, providing no lasting support. Historically, September tends to be a challenging month for BTC, and growing investor caution has further weakened the recovery.
Technically, BTC remains below the H4 Ichimoku cloud, indicating short-term bearish bias. Immediate resistance lies at 111.8–112.2k, and only a decisive H4 close above this zone could unlock a move towards 113.5–114.0k. On the downside, 110.3–110.9k is key; breaking this level could see BTC slide quickly to the 109k area, potentially 108.8k. Until 112k is reclaimed, the base scenario remains a sideways drift with bearish inclination, where short-term rallies are likely capped by profit-taking.
How do you see BTCUSD unfolding next? Share your view below.

$DUOL is a Falling KnifeNASDAQ:DUOL - Falling Knife
Got the sell alert and bearish willy and down we went.
Key support areas: $263 then $251
IF those don't hold you could see AVP - POC $201
Bulls need to breakout of downtrend
