Oil Target 62$: Sentiment Shifts Amid Geopolitical TensionsWe’re in a non-standard situation for oil markets — with the White House now openly threatening military action against Venezuela.
This dramatically increases the value of oil options sentiment.
You don’t need to be a PhD in geopolitics to understand:
A military operation = major supply disruption risk = price volatility on steroids.
And the market is already pricing it in.
Over the last two days, key levels like 58–60–72 have started appearing more and more in CME options flow — clear signs of positioning for extreme moves.
But here’s what matters most:
The trades that were placed before the Venezuela news broke.
That’s where we focus.
And if I had to summarize:
Two days ago, some guys were actively building spreads targeting 60–62 — betting on a pullback.
📌 Why?
These spreads are aggressive — they can generate 2x–3x returns from just a $2–$3 move, even if price doesn’t fully reach the target.
In short:
They’re not waiting for perfection.
They’re ready for explosion.
🔥 Final Take:
Yes, the option market has been extremely active over the past 48 hours — one of the busiest periods lately.
But beyond the noise, there’s a growing signal:
Oil is primed to explode.
And this "Venezuela narrative"?
It’s looking less like talk — and more like a setup for real movement. Big money is involved
The main question: will it explode before or after the New Year?
Buying

1 Hour TF - GOLD Next Buying Level- Droid TradingGold in Consolidation Zone B/W Strong Resistance or OB-FVG
New Buying Level - 3680-85 ( Strong Buying)
Again Tapping 3610-3615 ( Buying Possible After Bullish candle 1 hour Closing Above)
1 hour candle Closing Above Strong Resistance - Buying Possible ( 3670-75 to Target ATH )
Wait for entry, don't in hurry, Keep SL, Book Profit as Your Daily Target
Entry only in Level

4 Hour TF - Strong Buying Gold Level - Droid TradingGold Take Support Strongly near BOS , Where FVG or OB Present, Check Chart
Entry (3317-3325)
SL - 3307
Target (3365-3370)
BOOK Profit as your Understanding or Daily Target
Entry with Proper SL, as your Risk, Don't use Complete Fund.

HINO📊 HINO (PSX) Analysis (One can also buy on current market price)
🔎 Fundamentals
🚌 Buses & Trucks: Orders surged 80% 🚀
💰 Undervalued Price → Attractive entry point for long-term investors
📈 Earnings Growth: EPS improved to 4.67 ✅
🤝 MFTBC (Mitsubishi Fuso Truck & Bus Corp.) agreement with HINO → backed by a 100% publicly listed global player 🌍
📉 Technicals
📍 3 Accumulation Areas → Strong buying interest spotted
📊 Trendline Break (Daily) → Closed at 562 → ✅ Buy Signal
🔄 Support Bounce: Price moves in the 562–582 range → Ideal Buy Zone
⚡ If Support Breaks: Next attractive Buy Zone → 360–390
Note: (One can also buy on current market price)

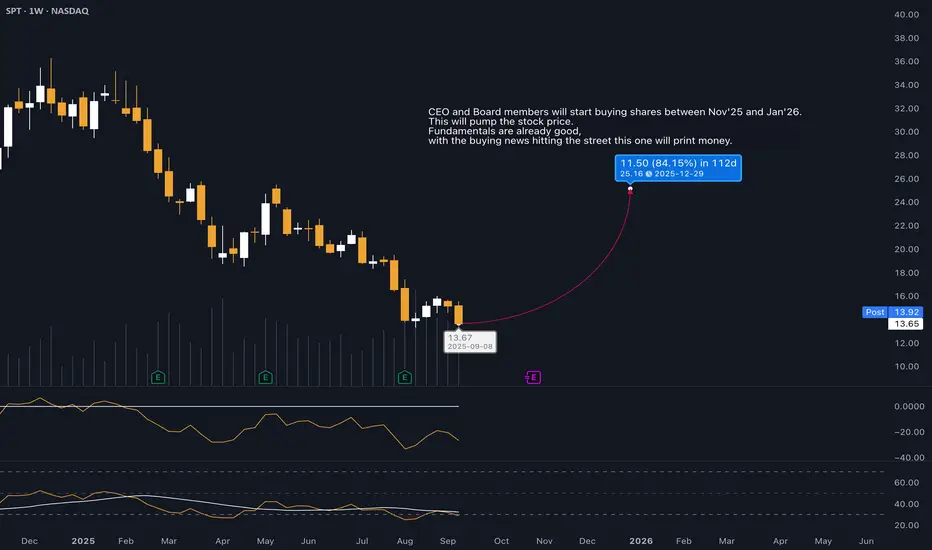
SPT will hit 25 USD (+80%) in next 4 monthsRead the Sec filing 26th August, 2025.
CEO and Board members will end their share selling plans and instead they will start buying shares. This change needs some weeks to get approved by SEC.
But once the new purchase plans are approved - i expect this to happen until the end of the year - and this news hits the street this stock will pump like crazy.
We will see at least 20 USD, im expecting even 25 USD.
Fundamentals are already good. Revenue is growing. Social media managers love Sprout Social already. Big companies will follow in future and start using Sprout Social.
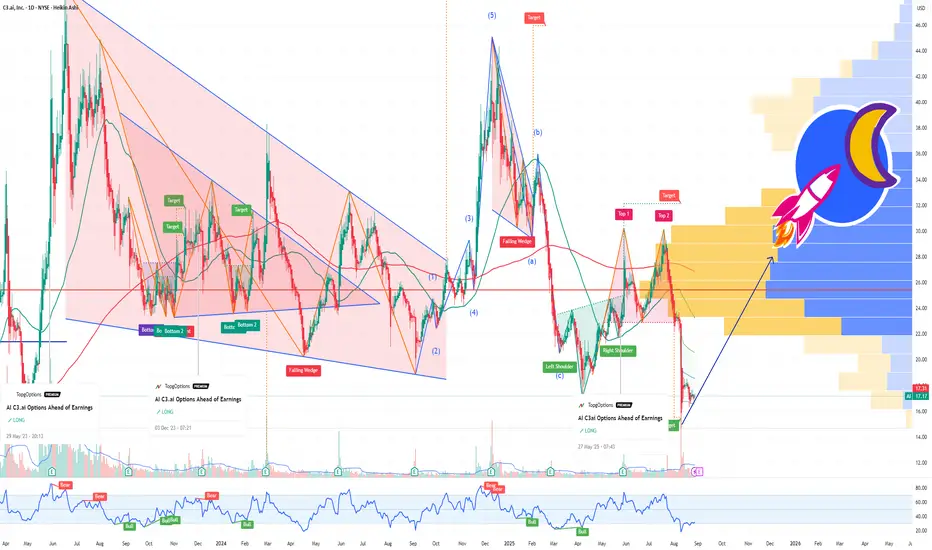
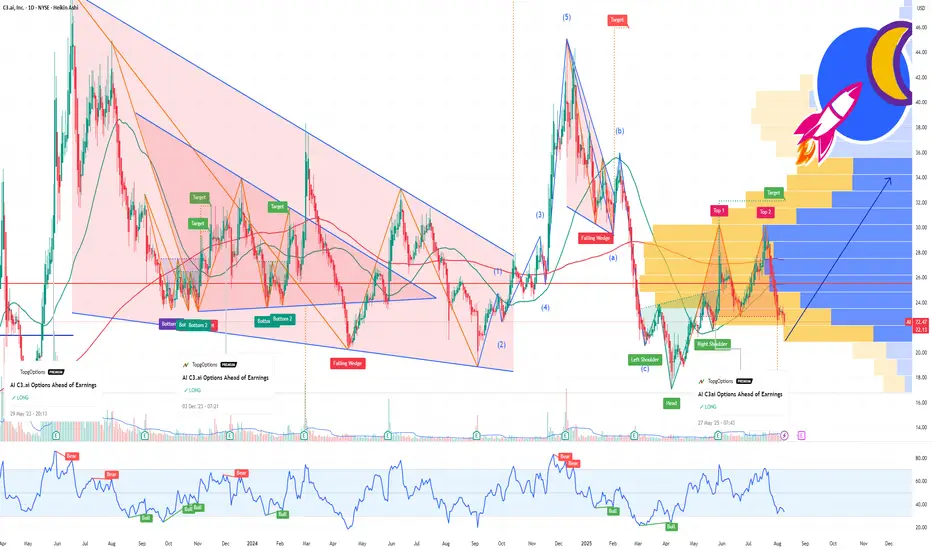
AI c3ai Bullish Reversal Ahead of EarningsAI C3.ai has been in the spotlight recently, following a series of notable developments that set the stage for a potential bullish reversal. The company recently announced that founder and CEO Thomas Siebel is stepping down due to health reasons. While this initially caused some market jitters, it coincides with a broader operational transformation that could act as a catalyst for a turnaround.
Earlier this month, C3ai reported preliminary fiscal first-quarter revenues below expectations, raising short-term concerns. However, the company continues to invest in AI-driven solutions and expand strategic partnerships, including a notable collaboration with Eletrobras in Brazil. These moves demonstrate that the firm is actively diversifying its offerings and positioning itself as a leading player in enterprise AI.
From an options market perspective, there is evidence of bullish sentiment building ahead of earnings. The $25 strike price out-of-the-money calls expiring on September 19 suggest that traders are betting on a near-term upside, signaling expectations of a possible recovery or positive surprise in the upcoming earnings report.
Leadership changes, while initially unsettling, often create opportunities for strategic shifts. A new CEO could accelerate operational efficiency, focus on high-growth initiatives, and highlight C3ai’s AI innovation, which has been a core strength of the company. Combined with ongoing product launches and partnership expansions, these factors could serve as a catalyst for a technical and fundamental reversal in the stock.
Traders may want to watch key support levels and the $25 strike options activity closely, as these indicators suggest that a bullish reversal could be on the horizon. With a renewed leadership team and continued AI innovation, C3.ai has the potential to regain momentum in the weeks leading up to earnings.
AI Insider Trading Before the Buyout? $5.8Million block of callsOn Friday, after the close, C3. ai announced CEO Thomas Siebel is stepping down, with a new leadership team taking over. The stock dropped almost 14% on the news, slashing its market cap and potentially making it irresistible for a takeover bid. They are looking for a new CEO!
Why this matters:
1. Perfect M&A Timing: C3. ai has proven AI tech, including contracts with the U.S. Department of Defense. The right acquirer could turn this into the next Palantir-style success story. Leadership changes often make buyouts easier.
2. Valuation Reset: The 14% drop gives strategic buyers a cheaper entry point, exactly when they might be circling.
3. Massive Call Buying Before News: Just last week, someone dropped $5.8M on Sept 19 $25 strike calls. That’s a high-conviction, short-dated bet. Nobody throws around that kind of money without expecting a big move, possibly insider knowledge of a deal or major contract.
4. Strategic Fit: Defense contractors or big tech companies could instantly expand their AI footprint by acquiring C3.ai.
Palantir built its empire by combining cutting-edge data analytics with deep government and defense relationships. C3. ai is following a similar blueprint and may be earlier in the curve:
1. Strong Defense Footprint: C3. ai already holds contracts with the U.S. Department of Defense and other government agencies, positioning it in the same secure, high-margin niche that powered Palantir’s growth.
2. Mission-Critical AI Solutions: Just like Palantir’s Gotham and Foundry platforms became embedded in government workflows, C3. ai’s AI suite is designed for enterprise and defense applications that are hard to replace once integrated.
3. Massive TAM (Total Addressable Market): The AI defense and enterprise analytics market is projected to grow exponentially over the next decade, mirroring the macro tailwinds Palantir rode after 2020.
4. Sticky Contracts: Government and defense clients tend to lock in long-term, high-value contracts once a system is deployed, creating predictable recurring revenue streams.
5. Potential for Commercial Expansion: Palantir went from mostly government to a healthy commercial mix. C3. ai could follow the same path, leveraging its defense credibility to win private-sector deals.
6. Strategic Acquisition Target: Big tech and defense primes would love to own a proven AI platform with federal clearance — just as Palantir’s unique positioning has made it a darling of Wall Street and a fortress against competition.
In short: C3. ai today could be where Palantir was a few years ago!
If acquired or scaled correctly, the upside could be just as explosive!
UNH bear flag and gapsUNH has been top of my radar for a bullish reversal. With 2 major gaps to fill after the epic collapse in share price this ticker has a lot of potential. Currently sitting in what appears to be a bear flag, it is holding above the monthly 200EMA (overlayed on this 4H chart). However price recently rejected off the daily 21ema (overlayed on this 4H chart) and if the bear flag is any indicator price may head lower for another liquidity sweep before the inevitable bullish reversal.
A side note: insiders have been buying $millions since the share price collapsed which is always a good indicator of what's to come.

Plug Power: A Mirage or a Miracle?Plug Power (NASDAQ: PLUG), a key innovator in hydrogen energy solutions, recently experienced a significant surge in its stock value. This upturn is largely attributed to a strong vote of confidence from within the company: Chief Financial Officer Paul Middleton substantially increased his stake by acquiring an additional 650,000 shares. This decisive investment, following an earlier purchase, clearly signals robust conviction in Plug Power's future growth trajectory, despite prior market challenges. Analysts also reflect this cautious optimism, with an average one-year price target that suggests a significant upside potential from the current valuation.
A major catalyst for the renewed interest stems from Plug Power's expanded strategic collaboration with Allied Green Ammonia (AGA). This partnership includes a new 2-gigawatt (GW) electrolyzer project in Uzbekistan, part of a substantial $5.5 billion green chemical production facility. This facility will produce sustainable aviation fuel, green urea, and green diesel, positioning Plug Power's technology as foundational to large-scale decarbonization efforts. This initiative, backed by the Government of Uzbekistan, further solidifies a broader 5 GW partnership between Plug Power and AGA across two continents, highlighting the company's capability to deliver industrial-scale green hydrogen solutions.
While these strategic wins are promising, Plug Power continues to navigate financial headwinds. The company has faced recent revenue declines and currently reports significant annual losses and cash burn. To address capital needs, it is seeking shareholder approval to issue more shares. However, the substantial, multi-gigawatt contracts secured, particularly with Allied Green, underscore a strong future revenue pipeline. These projects affirm the critical demand for Plug Power's technology and its pivotal role in the evolving green hydrogen economy, emphasizing that the successful execution of these large-scale ventures will be key to long-term financial stability and sustained growth.

Global Market Overview. Part 4.2: SOLANA
Solana: The American Blockchain Making a Comeback
(Previous post: )
Continuing from everything I’ve written earlier about Bitcoin and Ethereum, Solana deserves a separate spotlight.
Because this asset is a different story altogether. It’s not like Bitcoin. It’s not like Ethereum.
Solana has its own path, its own logic — and most importantly, its own market cycle, which follows a very different pattern of growth.
Why did Solana rally?
Let’s be blunt: Solana isn’t just a blockchain — it’s the epicenter of the new crypto cycle, where the main drivers weren’t decentralization or institutional capital, but memes, hype, and community.
Thousands of new tokens launched on Solana became the spark behind an explosion of interest.
The network surged with activity, and it was that real usage — not marketing — that pushed market cap higher.
But that’s not all.
Solana is Made in the USA.
And in crypto, just like in politics, that matters.
An American project, developed on U.S. soil, Solana quickly gained the trust of the largest and wealthiest crypto investor base in the world — American investors.
To be precise: it was the U.S. crypto community that pushed Solana into the mainstream.
And once funds and OTC brokers joined the party, it became clear — this asset isn’t going anywhere.
What about fundamentals?
Peak price: nearly $300
Growth from 2021 to 2024: one of the fastest in crypto
Network load: consistently high
Number of projects in the ecosystem: growing
Confirmed approval for a Solana ETF in the U.S.
Technological flexibility and strong developer support
U.S. jurisdiction: trusted by both institutions and retail
Why didn’t it crash with the rest of the market?
Here’s the twist: even as the crypto market was rocked by negative news and broad corrections, Solana held above $100.
That’s a key support level — and it held up under pressure from:
Trump’s tariff panic
Futures market liquidations
Capital outflows from other altcoins
Rising Bitcoin dominance
Yes, the price pulled back to the $130–140 range, but it never broke major support — a clear sign that strong hands haven’t let go.
But why hasn’t it gone higher if things are so good?
Simple: the Solana ETF hasn’t officially launched yet.
But once formal approval from the SEC is in place — the asset is set to explode.
We already saw a pump above $200 just on rumors.
Now the clock is ticking — when will rumor become reality?
And here’s a spoiler: the Solana ETF has already been approved.
In crypto, that’s how it goes — first the whispers, then insider info leaks, then the price runs.
And finally, when the official news drops — that’s when the real move starts.
We haven’t seen that final leg yet because of all the macro confusion over tariffs.
What’s next?
I’m not giving financial advice.
But here’s the reality — I bought Solana on the dip and I’m still buying.
Why?
Because I need to recover the $300K I lost on Ethereum
Because everything points to a continuation of the bull trend
Because no other major asset offers this kind of symmetry between fundamentals and upside potential
Solana isn’t a bubble.
It’s a trading platform for the meme economy — and one of the few blockchains where actual demand matches real scalability and low fees.
And in crypto, that means a lot.
My personal take
If you’ve got free cash right now — don’t be afraid to look Solana’s way.
I see no reason to fear this asset in the medium to long term.
The network is alive. The network is growing. The asset is holding strong.
Now all we need is the next trigger — and it will come.
The potential to see $200 again in the coming months?
Very real.

BUY GBPUSDLadies and Gents, in todays session we are monitoring GBPUSD for potential upwards move. BULLS INCOMING. Our target is 1.2923 and stops are below 1.2852 and targets above 1.31207. This set up is on higher time frame meaning it might take few days to play out make sure to look for confluence on lower time frames and use proper risk management.

Updated XRP Count Wave 5My last post I initially thought we could be in a Contracting Leading Diagonal. Upon studying the initial bounce we got from the liquidation event. It looks like an Expanding Leading Diagonal. We have been in this "chop" which looks like a Flat in the Wave 2. I currently have buy orders around the $2.00 mark.
If you have any questions feel free to reach out
GOD BLESS AND TRADE ON

LONG ON USOILOil is currently rising from a major demand zone.
It has broken out of a nice double/triple bottom and a downtrend line.
I expect price to tap into the demand zone as a pullback from its recent break of a high and then continue to rise.
I am buying oil and expecting it to rise to the next supply level for just about 200 pips or a $2 move on.

LONG ON GBP/JPYPrice has change structure from down to up on the lower timeframe from a major support/demand zone.
The Jpy index is currently falling from a major resistance zone.
I am buying GJ to the next supply area/zone for about 150-200 pips

LONG ON COPPERPrice is in Great uptrend structure from the HTF.
Price has completed its pullback all the way to a Key Demand area.
Its also built up liquidity to be swept right above that demand zone.
I expect price to swept buy side liquidity to the downside, tap into demand, then take off to the upside.
I am buying copper.

LONG ON GBP/JPYNice Double Bottom at a Key Demand Level
Jpy index is also Falling from a major resistance area.
I am taking GJ long

Two main supports for Bitcoin to climb againIt looks like we need to refill our wallets with great coins and ride the market uptrend again, these two very important supports for Bitcoin.
Which one do you think we will come back from??
Like and subscribe 🤍

I can't get enough of this chart #TonThis position is very suitable for a great move. Be sure to check it and get on the perfect wave to buy tons of coins. Please support and subscribe

According to the AI Agent trend, ACT will keep expanding.Retesting the closest supply and demand zone, it appears that the bottoming process BINANCE:ACTUSDT at $0.26 has been finished with a breakout to $0.35. For purchase orders, this backtest of the $0.3 support is perfect.
The $0.45 zone, the first consolidation zone and the most significant level, will be the closest target. Following that, we may keep distributing at $0.53 and particularly at $0.63, where there are a lot of strong reactions that point to significant selling.


Breakout Signals via Asymmetrical AveragingSpecial Application of Average Bullish & Bearish Percentage Change Indicator
INDICATOR AVERAGES BULLISH AND BEARISH VOLATILITY SEPARATELY THROUGH THEIR NATIVE PAST CANDLE COUNT. NOT PERIODICALLY!
Asymmetrical averaging is a versatile technique that involves assigning different lengths for independent averaging of opposite market forces. This adaptability uncovers high-probability breakout signals by establishing a threshold that filters out irrelevant fluctuations.
Below, I illustrated 2 practical examples of the method applied to bullish and bearish breakout scenarios:
Bullish Breakout Example:
Set the bullish averaging to 30 and the bearish averaging to 1000.
If the bullish average consistently surpasses the bearish threshold, it indicates robust buying momentum and a potential breakout to the upside.
The extreme bearish average establishes a consistent baseline, filtering out short-term fluctuations and focusing on significant upward momentum to deliver reliable bullish breakout signals.
Bearish Breakout Example:
Set the bearish averaging to 30 and the bullish averaging to 1000.
If the bearish average rises above the bullish threshold, it signals growing selling pressure and a potential breakout to the downside.
The extreme bullish average provides a steady reference point, eliminating minor fluctuations and isolating significant downward momentum for dependable bearish breakout signals.
LINK TO THE INDICATOR:

Raw VS Percentage Volatility FormatA Quantitative Comparison of "Buying & Selling Pressure" and "Average Bullish & Bearish Percentage Change"
In market analysis, the choice of averaging method can profoundly influence the insights derived. The "Buying & Selling Pressure " and "Average Bullish & Bearish Percentage Change" indicators demonstrate the unique strengths of fixed-period and candle-count-based averaging approaches.
Key Differences Between Fixed-Period and Candle-Count Averaging
Fixed-Period Averaging in BSP:
➡︎ In "Buying & Selling Pressure", candle metrics are averaged over a defined period (e.g., 14 bars).
➡︎ This provides rapid insights into market sentiment changes, making it ideal for tracking incentive shifts and volatility in real time.
➡︎ However, because this method includes all candles in the averaging window, it may reflect short-term fluctuations, offering less stability compared to candle-count-based methods.
Candle-Count Averaging in ABBPC:
➡︎ "Average Bullish & Bearish Percentage Change"uses a predefined count of bullish or bearish candles for averaging percentage changes.
➡︎ This produces stable and reliable values, which are less sensitive to noise and better suited for risk and reward assessment.
➡︎ The focus on specific candle states ensures that only relevant market behaviors contribute to the averages.
Using Percentage Change for Risk Definition
One of the greatest strengths of the "Average Bullish & Bearish Percentage Change" indicator is its ability to assist in risk and reward calculations with much more market related figures instead of raw values of volatility:
Defining Risk
The average percentage change of bearish candles can serve as a dynamic stop-loss level.
For example, if the average bearish percentage change over the last 10 candles is 2%, a trader can set a stop-loss at 2% below their entry to account for typical market behavior.
Quantifying Reward:
The average bullish percentage change helps identify realistic profit targets.
If the average bullish percentage change over the last 10 candles is 3%, a trader can set a target at 3% above their entry to maintain a favorable risk-to-reward ratio.
Dynamic Adjustments:
As the market evolves, these average percentage changes update, allowing traders to adjust their risk and reward levels in real time for better precision.
Quantitative Advantages of Percentage Change Averaging
Normalization Across Price Levels:
Percentage changes enable consistent comparison across assets with vastly different price ranges.
Enhanced Stability for Risk Assessment:
Candle-count averaging smooths out noise, offering a reliable basis for setting risk parameters like stop-losses and profit targets.
Improved Predictability:
By isolating specific candle behaviors, percentage-based metrics provide clearer signals for trend-following or mean-reversion strategies.
Advantages of BSP’s Fixed-Period Averaging
Despite being less stable, "Buying & Selling Pressure " excels in areas requiring speed and adaptability:
Fast Incentive Tracking:
Period-based averaging adapts quickly to changing market conditions, providing timely insights into shifts in buying or selling pressure.
Broad Volatility Capture:
BSP includes all candles in the defined period, capturing overall market dynamics, including sudden spikes or reversals.
Real-Time Decision Making:
Its responsiveness makes it highly suitable for momentum or breakout trading strategies.
Bottomline:
Use "Average Bullish & Bearish Percentage Change" for stable, consistent data ideal for risk assessment, particularly when defining dynamic stop-loss levels or profit targets based on average percentage changes.
Use "Buying & Selling Pressure " for its speed and adaptability in tracking real-time shifts in market incentives and capturing volatility.

Platinum Insider Stays in the Game, Anticipating Higher PricesA platinum Insider hasn't changed portfolio yet, so there's still potential for more growth.
Let me remind you, on September 4th, an insider came into the Platinum market and went long, which caused the price of Platinum (and other precious metals) to go up.
Now, prices are getting close to his target levels. This is important because it shows the market's future direction. The Insider know when to get in and when to get out. And we can watch them to see what he is doing.
If you don't have the time or inclination to read stock reports, just follow us. We cover all the important stuff and provide valuable insights every day.
