Buying


USDCHF - Quick long playEven though the HTF is pretty volatile I see a good opportunity for a quick long play on this pair. Price has just broken out to the upside of a corrective structure. Looking to enter on a weak pullback into support (top of structure) with first target around 1.0080 and if that resistance folds, extended target would be 1.0100.

GOLD longGold broke important key level and is predicted to continue in uptrend. Testing the resistance and buying.

USOIL - Change in order flowThe reversal structure we are seeing on the 4 hour chart is hinting of a change in order flow. I expect either 45.00 or 43.60 will attract new bids that will push price up towards 48.00.

USD/CHF - Closing in on a long term resistance zoneEven though we are getting close to a daily resistance zone I think there is a short-term upside potential. The latest bull run has been almost uninterrupted by the bears and they most likely won't be able to stop it with just one try. So expect increasing volatility before this thing turns around.
For now I am looking to get long if price makes it back to the bottom of the short-term corrective structure around 0.98900 with my first target around 0.98900 and my secondary target all the way up at the top of the resistance zone around 0.99400.
If we don't get the pullback I am waiting for = No trade.

EUR/AUD - Signs of possible bullish continuationThe pair has been testing the 1.4580 level for 4 times without being able to penetrate it. The last reaction was pretty forceful followed by a corrective structure. If this structure holds and we see a retrace back into the bottom I am willing to go long, targeting 1.4760 as a primary target and 1.4850 as a secondary one.
Since we are in a ranging environment this will be a lower probability trade though.

EUR/CAD - Structure hinting of a new bullish moveThe sideways corrective structure is hinting that the buyers are still interested in this pair and are just taking a break. If the bottom of this structure holds I am looking to go long with my first target being the top of the structure and my second target around 1.4860-1.4870.

EUR/GBP - Closing in on heavy resistanceIf this corrective structure holds I am looking to go long with my primary target around 0.8745. And if that level folds a move up towards the resistance area between 0.87600-0.87900 is to be expected. The resistance area should attract plenty off sellers so would not look for targets beyond that zone.

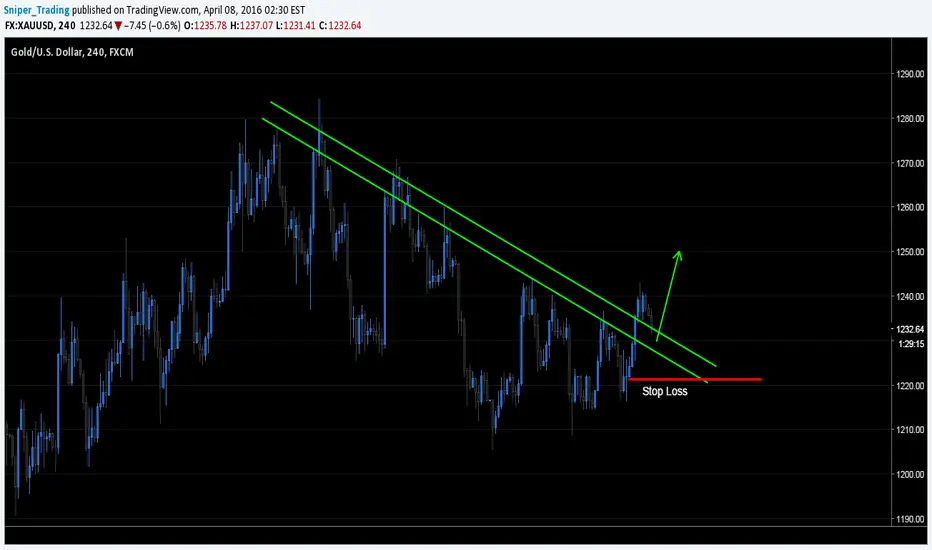
Gold - False break and reversal structureClear false break and reversal structure forming on the 1h gold chart. Going long targeting the 1331 area with stops below 1318.

GBP/CHF - Early moving marketThe market started moving prior to the London open today so I was not able to get in in time. But am looking for a re-test of the 1.2620 area once London opens to get long. The corrective structure is looking good with clear edges. It is also horizontal which always is a good sign in my book. Primary target will be the level that is testet right now around 1.2643 and secondary target will be the area around 1.2735.

USD/CHF - Bought at 0.97880Bought this pair this morning at 0.97880 and am looking for a initial move up towards 0.98100 and if that level folds, another push up to 0.98400.

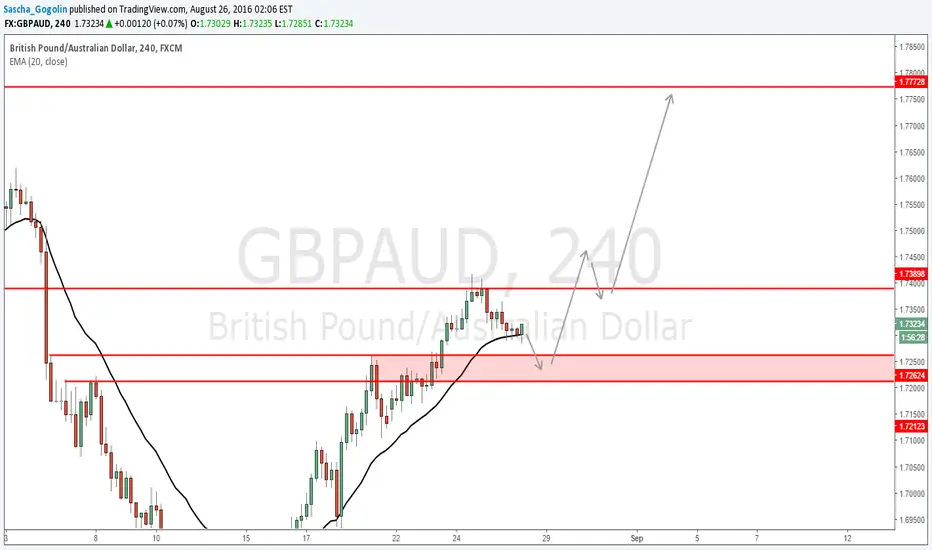
GBP/AUD - Possible short term reversal on HTF with LTF entryOn the daily chart price has been bulish 7 out of 8 days and if bulls are able to remain in control a move towards 1.7750 is very likely in my opinion. I am looking to benefit from such a move with a lower time frame entry. Looking to go long from the 1.7250 area with my primary target just shy of 1.74 and my secondary target at 1.7750.
USD/JPY - Possible bullish follow throughAll the majors are showing the same behavior. Strong impulsive move, followed by a horizontal corrective price action. If the minor support zone around 101.50 holds my short term target is 102.50 and long term target is around 104.00.


NZDCAD outlook LONG TERM trading The pair had a bullish week at moment on the way to Major RES.zone which rejected bulls more than 4 times.
Pitchfork-Fibo Sup.Res. lev. 95.500 / 96.500 as a crucial point.
If we get the 5 attempt at cracking this Crucial Point, a big move to the upside for new higher.
1 Correction and counter-trend bounce.
2 breakout for new high
3 bearish abcd pattern sell zone.
let's see :)
*


GBPJPY / 4HR / BUYING OPPORTUNITY (June Promo)JUNE PROMO: www.StarProsper.com
PAIR: GBP/JPY
TIME-FRAME: 4HR
TRADE: BUYING OPPORTUNITY
In the Live Room with our Star Community, we decided
to post one of our Trading ideas for everyone to follow
along with. Have a great weekend Traders!
NOTE: These are potential trade opportunities. Please
re-analyse the trade before executing.
Star Prosper
Philip Stewart
WEBSITE: www.StarProsper.com
FACEBOOK: facebook.com
YOUTUBE: www.youtube.com

EURUSD Buy Opportunity - Wolfe Wave & Triangle Patterns FormingThere is a support line (the yellow dotted line) coinciding with 78.2 and 88.6 area of a fibonacci zone which should provide support. A triangle pattern seems to be forming a wolfe wave since the 5th wave has gone outside the triangle support lines. I have put two entries, a normal entry and a conservative entry for traders who don't like risk, and again a conservative target and the normal target.

BUllish Cypher pattern EURJPYPossible Bullish Cypher pattern with D leg fully formed. TP 124.625, SL 121.534.

WTI will reach the 44.00-46.00 area by the end of 2016The fundamentals are still bearish at the moment, thanks to global oversupply. The weakness in WTI is caused by the moderately declining U.S. production, increase in the output of OPEC and the return of Iran to the world stage, as sanctions were lifted. The fears of further oil decline are further overlined by the decision of Saudi Arabia and Kuwait to restart global produce up to 300 thousand barrels a day.
On the other hand, the talk of oil freeze increased oil prices by more than 10% in March. Which led big hedge funds to start betting on higher oil prices.
My expectations are that prices will continue falling and that by the end of 2016, prices will reach the 44.00- 46.00 area.
This perspective will change depending on the fundamentals, but with the current data given this is my opinion.
All Publications are published for informative purposes only and are in no way to be considered as investment advice or recommendation. Any investment decision based on the Articles of the author is made by the audience, and Autor is not responsible for any loss or damage arising from such decision, whether based or not based on the Publications of the Autor.
