$PLTR | COVERAGE INITIATED — Personal Position Update [W49]COVERAGE INITIATED — Bullish Classification (Trend Shift Identified)
PLTR — WEEK 49 TREND REPORT | 12/05/2025
Ticker: NASDAQ:PLTR
Timeframe: W
This is a reactive structural classification based on the weekly chart as of this timestamp. Price conditions are evaluated as they stand — nothing here is predictive or forward-assumptive.
⸻
Author’s Note — Personal Position Update
I initiated my own position on [ NASDAQ:PLTR ] during Week [ 49 ], entering at $ [ 181.76 ].
This decision follows my personal criteria: I only participate when my system identifies a verified structural trend shift supported by both a confirmed weekly flag and a qualifying candle state. This note reflects my activity only and is not a suggestion for anyone else.
As of this update, my position is currently up ~ [ 0% ] from my entry.
My structural exit level is $ [ 177.54 ] on a weekly-close basis. This level will continue to adjust upward automatically as the structure strengthens. If price closes below that threshold, my system classifies the trend as structurally compromised, and that is where I personally exit.
This update exists solely to document my own participation and the structural levels I monitor. It is not predictive and does not imply any future outcome.
⸻
Structural Integrity
• 1) Current Trend Condition [ Numbers to Watch ]
• Current Price @ $
• Trend Duration @ +0 Weeks
( Bullish )
• Trend Reversal Level ( Bearish ) @ $
• Trend Reversal Level ( Bearish Confirmation ) @ $
• Pullback Retracement @ $
• Correction Support @ $
⸻
2) Structure Health
• Retracement Phase:
Uptrend (operating above 78.6%)
• Position Status:
Healthy (price above both structural layers)
⸻
3) Temperature :
Neutral Phase
⸻
4) Momentum :
Bullish
⸻
Structural Alignment
NEUTRAL STRUCTURAL CONDITION
This mark represents a period where directional behavior was unclear. Market movement here reflected compression, chop, or indecision — neither trend direction was dominant. It does not signal continuation or reversal, only that price action was not showing strong alignment in either direction.
⸻
Methodology Overview
This classification framework evaluates directional conditions using internal trend-interpretation logic that references price behavior relative to its structural layers. These relationships are used to identify when price movement aligns with the framework’s criteria for directional phases, transition points, or regime shifts. Visual elements or structural labels reflect these internal interpretations, rather than explicit trading signals or preset indicator crossovers. This framework is observational only and does not imply future outcomes.
Buysellsignal

Oklo dropped 50% is there more to come Update on the original video where we forecast a correction for Oklo in which case we got a really nice drop to the downside .
I cover what I think may be next while we are Currently sitting at the .618

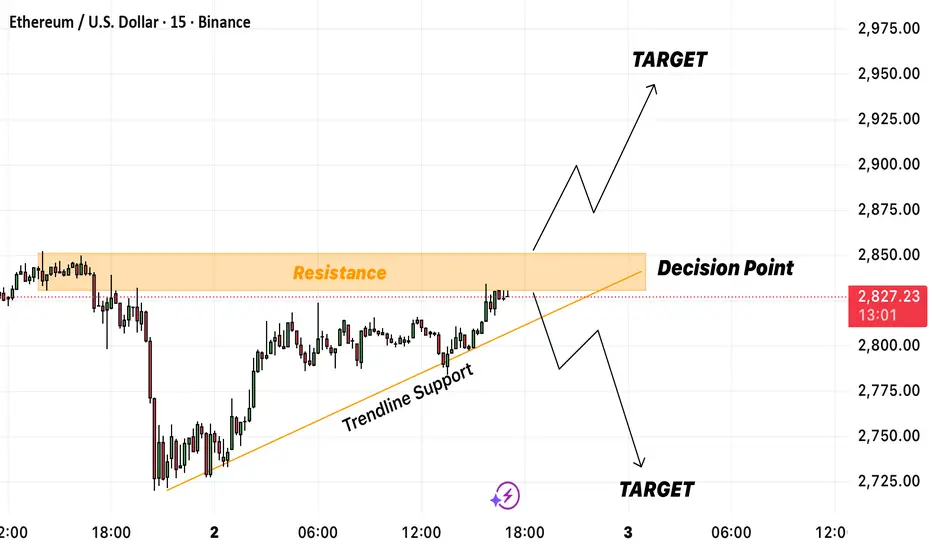
ETH/USD at Key Decision Zone – Breakout or Rejection?Ethereum is approaching a major resistance zone around $2,830 – $2,850, which previously acted as strong supply. Price has been climbing steadily along a rising trendline support, indicating sustained bullish momentum.
This creates a decision point where ETH will likely choose its next directional move.
🔼 Bullish Scenario
If price breaks and closes above the resistance zone, it confirms bullish continuation.
In this case, buyers may push price toward the next liquidity zone around:
Target: $2,900 – $2,950
A successful breakout with retest would strengthen the bullish case.
🔽 Bearish Scenario
If price rejects the resistance and breaks back below the trendline support, selling pressure may return.
Downside targets would be:
Target: $2,750
Extended Target: $2,720
This would signal a shift in short-term structure from bullish to bearish.
📌 Key Levels to Watch
Resistance (Decision Zone): $2,830 – $2,850
Trendline Support: Rising from the $2,750 region
Bullish Target: $2,900 – $2,950
Bearish Target: $2,720 – $2,750
📈 Summary
ETH is sitting at a critical decision point. A breakout above resistance opens the door for bullish continuation, while a rejection could trigger a deeper pullback. Traders should wait for confirmation—either a clean breakout or a trendline breakdown.
Accumulated price increase - bulls expect rate cut⭐️GOLDEN INFORMATION:
Expectations of further Fed rate cuts and inflation still above target continue to underpin gold and silver, said David Meger, director of metals trading at High Ridge Futures.
However, China’s physical gold demand has weakened at elevated price levels, which could weigh on the metal. According to the Financial Times, major retail chains have scaled back their presence in mainland China this year, while smaller sellers report that soaring prices and higher taxes have severely hurt sales.
⭐️Personal comments NOVA:
Gold price took H1 4193 breakout liquidity and reacted bullishly, still maintaining the uptrend, continuing to expect December rate cut
⭐️SET UP GOLD PRICE:
🔥SELL GOLD zone: 4274 - 4276 SL 4281
TP1: $4260
TP2: $4245
TP3: $4230
🔥BUY GOLD zone: 4145 - 4143 SL 4138
TP1: $4160
TP2: $4175
TP3: $4190
⭐️Technical analysis:
Based on technical indicators EMA 34, EMA89 and support resistance areas to set up a reasonable BUY order.
⭐️NOTE:
Note: Nova wishes traders to manage their capital well
- take the number of lots that match your capital
- Takeprofit equal to 4-6% of capital account
- Stoplose equal to 2-3% of capital account

BBAI BigBear ai Holdings Options Ahead of EarningsIf you haven`t bought BBAI before the massive rally:
Now analyzing the options chain and the chart patterns of BBAI BigBear ai Holdings prior to the earnings report this week,
I would consider purchasing the 3usd strike price Calls with
an expiration date of 2025-12-19,
for a premium of approximately $1.35.
If these options prove to be profitable prior to the earnings release, I would sell at least half of them.

AAPL Poised for Continued GrowthIf you haven`t bought AAPL before the rally:
What to consider now:
1. AI-Driven iPhone Upgrade CycleApple’s integration of Apple Intelligence, its proprietary AI platform, is set to catalyze a significant iPhone replacement cycle. Posts on X highlight positive sentiment around AI-driven demand, with estimates suggesting a 40% year-over-year surge in iPhone shipments in China during May 2024, signaling strong consumer interest. New AI features, such as on-device processing for enhanced privacy and functionality, are expected to drive accelerated hardware upgrades. Analysts, including Bernstein, project these features could boost upgrade rates, with even a 1% increase in upgrades driving meaningful revenue growth. With the iPhone 15 and future iterations leveraging AI, Apple is likely to capture pent-up demand, as noted by industry observers who see long-term revenue growth from its 7% year-over-year increase in active installed base.
2. Strong Ecosystem and Services GrowthApple’s ecosystem—spanning iPhones, iPads, Macs, and wearables—continues to drive customer loyalty and recurring revenue. The company reported record services growth in Q2 2025, with revenue reaching $95.4 billion, up 5% year-over-year. Services like Apple Music, iCloud, and Apple TV+ benefit from the growing active device base, which ensures sticky, high-margin revenue streams. This ecosystem strength mitigates concerns about short-term iPhone sales fluctuations, as Apple captures upgrade revenue over time. The seamless integration of hardware and services creates a moat that competitors struggle to replicate, reinforcing AAPL’s long-term growth potential.
3. Technical Bullish MomentumFrom a technical perspective, AAPL exhibits strong bullish patterns across multiple timeframes. TradingView analyses point to a rising bullish channel, with higher highs and higher lows signaling sustained upward momentum. Key bullish patterns, such as an ascending wedge and triangle, are forming around current price levels, suggesting potential breakouts. For instance, if AAPL clears $203.21 with volume, it could target $204.98 or higher, with some analyses eyeing $240 as a near-term resistance. Technical indicators like a rising RSI and MACD convergence further support short-term bullish momentum. Despite recent consolidation, reduced volatility and a strong setup pattern indicate AAPL is primed for a breakout.
4. Analyst Optimism and Market SentimentAnalyst sentiment remains overwhelmingly positive, with a consensus “Buy” rating and a 12-month price target of $228.85, implying a 14.05% upside from the current price of $200.66 as of June 2025. Hedge funds like Third Point see “significant” upside, driven by AI features that could meaningfully boost earnings. Bernstein’s raised price target to $240 reflects confidence in Apple’s ability to monetize AI through hardware and services. Posts on X also highlight investor optimism, with AAPL’s $350 billion market cap increase in a single day underscoring strong market confidence in its AI-driven growth chapter.
5. Global Expansion and Emerging MarketsApple’s growth in emerging markets, particularly India and China, bolsters its bullish case. Improved guidance for December 2023, driven by iPhone 15 adoption and India’s market potential, signals untapped opportunities. Apple’s ability to penetrate these high-growth regions, combined with its premium brand appeal, positions it to capture a larger share of global smartphone and tech markets.
Disclosure: I am part of Trade Nation's Influencer program and receive a monthly fee for using their TradingView charts in my analysis.

Accumulate - will gold price return to 4200?⭐️GOLDEN INFORMATION:
Gold (XAU/USD) gains fresh momentum on Wednesday, rising above $4,160 to a one-and-a-half-week high after Tuesday’s US data signaled easing inflation and strengthened expectations for further Fed rate cuts. Supportive comments from several Fed officials have also pressured the US Dollar to a one-week low, boosting the non-yielding metal.
Still, the prospect of lower rates has lifted global risk appetite, limiting stronger safe-haven inflows into gold. Hopes for progress toward a Russia-Ukraine peace deal further cap upside. Even so, the broader outlook favors additional gains in XAU/USD as traders await more US data for direction
⭐️Personal comments NOVA:
Gold price accumulates - market recovers back to 4200 soon. Still expectations of interest rate cut in December
⭐️SET UP GOLD PRICE:
🔥SELL GOLD zone: 4194 - 4196 SL 4201
TP1: $4180
TP2: $4170
TP3: $4150
🔥BUY GOLD zone: 4103 - 4101 SL 4096
TP1: $4117
TP2: $4130
TP3: $4150
⭐️Technical analysis:
Based on technical indicators EMA 34, EMA89 and support resistance areas to set up a reasonable BUY order.
⭐️NOTE:
Note: Nova wishes traders to manage their capital well
- take the number of lots that match your capital
- Takeprofit equal to 4-6% of capital account
- Stoplose equal to 2-3% of capital account

Bitcoin (BTC/USD) 3-Hour Chart - August 2025: Price breaks resistance at $121,919, targeting $128,311 (TP2) with support at $112,856 (Snipe). Key levels include TP1 at $121,919 and SL/TP at $117,107."

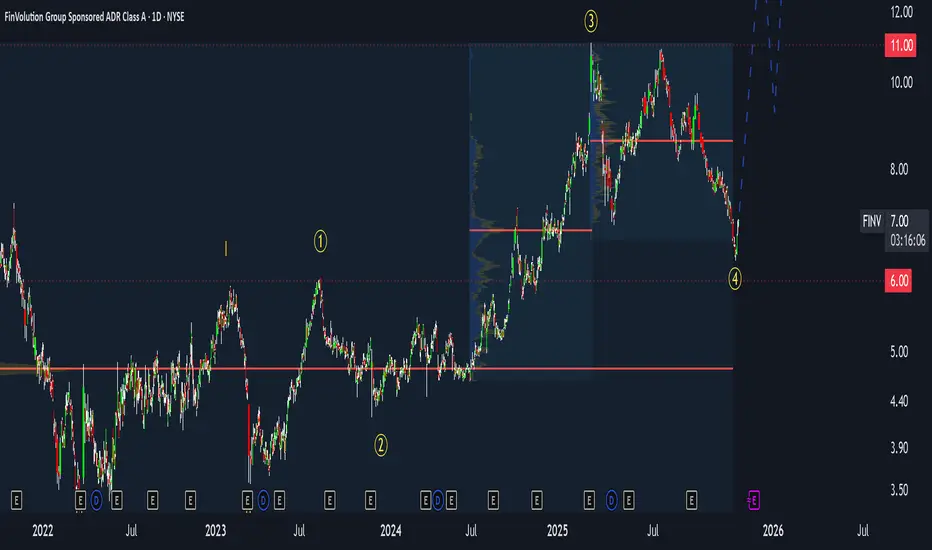
FinVolution (FINV)- Massive Selloff, Massive Opportunity?⚡ Market Context
FinVolution ( NYSE:FINV ) just went through one of its strongest selloffs in years.
After the recent earnings release, the stock dropped about 12 percent in one session and roughly 60 percent over the last six months.
What is surprising is that the earnings report itself was not bad. Revenue remains stable, the company is still profitable, and cash flows continue to look healthy. Fundamentally the decline looks excessive relative to the numbers. It is possible that the market is pricing in China specific risks that we cannot clearly see, but the size of the move still appears disconnected from the financial results.
📉 Technical Structure
From a structural point of view, FINV has now returned to one of the largest accumulation clusters on the entire chart.
This support zone stretches from 3.5 to 7, and the price is already trading near the upper boundary of this block.
The recent collapse fits well into a corrective pattern inside the larger wave structure. The current price action is likely completing the final part of the decline. The global bullish structure is still intact.
Key levels:
Major accumulation zone: 3.5 to 7
Current price: around 4.7
Wave invalidation level: 2.68
(Only a break below 2.68 cancels the entire long term structure.)
Until the price breaks below 2.68, the wave count remains valid and the bullish scenario stays active.
🔍 My Position and Strategy
My stop loss was hit during the drop, so I am currently out of the market.
Right now I am waiting for a clear confirmation signal before reentering.
My plan:
Price must break out of the current downward channel.
After the breakout, I need to see a clean retest from above.
That retest becomes the entry trigger, with a tight stop.
If the price moves lower before the breakout, that is acceptable inside the current wave structure.
The most important part is the confirmation and the retest.
📊 Bigger Picture
Even though the decline looks brutal, the long term structure remains bullish.
We are inside the largest multi year accumulation zone, and the broader formation still points to a potential long term upside once the correction completes.
The next big move can start only after the structure confirms the reversal. Until then, patience is the strategy.
✅ Summary
Earnings were acceptable, but the market reaction was extremely negative.
Price is now inside a huge accumulation cluster between 3.5 and 7.
Wave structure remains valid unless 2.68 breaks.
I am currently out and waiting for a breakout and retest signal.
Long term bias remains bullish.
💬 What do you think?
Is this a deep accumulation opportunity, or is the market pricing in hidden risks?
Share your thoughts below and drop your tickers for the next analysis.

LAZR Luminar Technologies Options Ahead of EarningsAnalyzing the options chain and the chart patterns of LAZR Luminar Technologies prior to the earnings report this week,
I would consider purchasing the 1usd strike price Puts with
an expiration date of 2026-2-20,
for a premium of approximately $0.58.
If these options prove to be profitable prior to the earnings release, I would sell at least half of them.

Gold (XAU/USD) – Combined Daily & 1H AnalysisBias: Bullish continuation
Key Level to Watch: 4,083.33 USD
Gold continues to show strong bullish momentum following last week’s reversal from sub-4,000 zones. On the daily timeframe, price printed a clean bullish candle, confirming buyer dominance. The 1-hour chart reinforces this strength — despite short-term pullbacks, buyers are consistently defending higher lows above 4,041 and 4,083.
Technical Context
• Trend: Short-term uptrend with renewed bullish structure
• Daily Resistance zone: 4,100 – 4,150
• 1H Resistance zones: 4,097.66 → 4,101.80 → 4,110
• Support zones: 4,083 → 4,041
• Structure: Minor retracement within an ongoing breakout sequence; price holding firm above prior resistance now acting as intraday support
Trading Plan
Monitor 4,083 as the intraday decision level — a sustained hold above this zone supports continuation toward 4,101 and 4,150.
A close below 4,041 would signal weakening momentum and open the path for a short-term correction before potential re-entry opportunities emerge.

FinVolution Group (FINV) - A Quiet Giant on the Edge of Breakout⚡ FinVolution Group (FINV) — A Quiet Giant on the Edge of Breakout
While everyone is chasing the inflated Big Tech bubble, a much quieter — and potentially far more explosive — opportunity is forming right now in the fintech and online lending space.
That opportunity is FinVolution Group (FINV) — a Chinese and Southeast Asian fintech player that looks ready to break through its 2021 highs. Once that breakout happens, the move could be massive.
🔸 Fundamentals
FinVolution has quietly turned a corner.
Recent quarters have been consistently profitable — both revenue and EPS are growing.
The most striking part?
The forward P/E ratio is just 0.7 — yes, less than one.
That’s an extraordinary valuation for a profitable fintech with expanding operations across multiple Asian markets.
It’s a risky play, no doubt, but these are exactly the kind of setups that tend to drive portfolio growth over time: low valuation, improving financials, and clear technical breakout potential.
🔸 Technical Picture
From a technical perspective, FINV is at the start of what looks like the third major wave of its long-term structure.
Since 2021, the price has been consolidating sideways — but that phase seems to be ending now.
Key resistance: $11
Current price: around $7
Breakout level: above $11 (with volume confirmation)
First targets: $20 → $30 → $40
If the price breaks below $6, the bullish scenario pauses — it doesn’t collapse, but likely extends the sideways phase.
That sets up a risk of roughly 10–15%, while the potential upside remains multiple times higher.
The risk/reward profile here is exceptionally strong.
🔸 My Strategy
I’m already positioned - entered near $7, with a stop-loss around $6.
Once we approach $11, I plan to take partial profits and watch for a breakout confirmation.
If we get a strong breakout above $11 with solid volume, that’s my next entry trigger.
Then I’ll look to add on pullbacks, applying my call stacking strategy - building exposure gradually as the trend confirms and accelerates.
🚀 Summary
FinVolution (FINV) shows a rare combination:
✅ Profitable growth
✅ Deep undervaluation
✅ Strong breakout setup
It’s one of those asymmetric opportunities — where the downside is limited, but the upside could multiply several times over.
If the $11 breakout confirms, this could easily become one of the most powerful fintech moves of the next few quarters.
⚡ Call to Action
If you like this type of setup - low-risk, high-upside plays - tap 🚀 to support the idea,
and drop a comment with tickers you’d like me to review next.
(Full technical breakdown and strategy details are discussed in my latest videos — available via my profile.)
FED cuts interest rates - gold prices rise next week ✍️ NOVA hello everyone, Let's comment on gold price next week from 10/27/2025 - 10/31/2025
⭐️GOLDEN INFORMATION:
Gold (XAU/USD) rebounds over 0.10% on Friday, trading near $4,127 after recovering from $4,043 lows, as softer-than-expected US inflation data reinforced expectations of a Fed rate cut next week. The CPI report broadly met forecasts but offered little support for hawkish policymakers.
⭐️Personal comments NOVA:
Gold price recovers, positive next week when FED almost continues to reduce interest rate by 0.25%. Opportunity for gold to return above 4200, 4300
🔥 Technically:
Based on the resistance and support areas of the gold price according to the H4 frame, NOVA identifies the important key areas as follows:
Resistance: $4153, $4237, $4380
Support: $4045, $3944
🔥 NOTE:
Note: Nova wishes traders to manage their capital well
- take the number of lots that match your capital
- Takeprofit equal to 4-6% of capital account
- Stoplose equal to 2-3% of capital account
- The winner is the one who sticks with the market the longest

GBPUSD POSSIBLE BUY SETUP (This chart shows GBP/USD )This chart shows GBP/USD (British Pound vs US Dollar) on the 1-hour timeframe with a technical setup suggesting a potential bullish reversal.
Here’s a concise breakdown:
Downtrend Line (Black Line) – Price has been respecting a descending trendline, indicating consistent lower highs (bearish momentum).
Change of Character (ChoCH) – A “ChoCH” label appears near 1.335, suggesting that the market may be shifting from bearish to bullish structure — the first sign of a possible trend reversal.
Demand Zone (Green Box) – Around 1.3300–1.3320, this zone represents an area where buyers are expected to step in (potential reversal point).
Bullish Scenario (White Arrow) – The arrow forecasts price to:
Tap into the green demand zone,
Bounce upward, breaking the downtrend line,
Target higher resistance/supply zones near 1.3400–1.3460.
Supply Zones (Red Areas) – Mark previous sell zones or resistance levels where price could react during the upward move.
Summary:
Price is in a downtrend but showing early reversal signs (ChoCH). A bounce from the green demand zone could lead to a bullish move toward the upper resistance zones.

BTC accumulates and starts to recoverBitcoin (BTC/USD) – Daily Analysis
BTC continues to trade within a broad ascending channel, currently rebounding strongly from the key demand zone around 106,000–108,000. This zone has acted as a major liquidity area where buyers have repeatedly stepped in to defend price.
After forming a double rejection at the lower channel boundary, BTC has reclaimed the EMA 34 and is now attempting to stabilize above 110,000, signaling early bullish recovery momentum.
If buyers can maintain price action above 110,000, the next resistance levels to watch are:
113,000–114,000: confluence of EMA 89 + prior structure resistance.
126,000–127,000: upper trendline of the ascending channel and potential medium-term target.
Technical Outlook:
Price respected long-term ascending channel support.
EMAs show potential for a bullish crossover if momentum continues.
Higher low formation supports a recovery scenario.
Bullish Scenario:
Holding above 110,000 would confirm strength, with possible continuation toward 113,000 → 126,000.
Bearish Scenario:
Failure to hold 108,000 could trigger a deeper retracement toward 106,000 or even 102,000 (next demand zone).

DLR Digital Realty Trust Options Ahead of EarningsAnalyzing the options chain and the chart patterns of DLR Digital Realty Trust prior to the earnings report this week,
I would consider purchasing the 190usd strike price Calls with
an expiration date of 2026-3-20,
for a premium of approximately $7.70.
If these options prove to be profitable prior to the earnings release, I would sell at least half of them.

When will gold continue to rise? 4300?⭐️GOLDEN INFORMATION:
Gold (XAU/USD) advances toward $4,210 during Thursday’s Asian session, hovering near a fresh record high as Fed rate-cut expectations and renewed trade tensions lift safe-haven demand. Traders now await comments from Fed officials, including Michael Barr, Stephen Miran, Christopher Waller, and Michelle Bowman, for policy cues. Earlier this week, Fed Chair Jerome Powell warned that slowing job growth poses a risk to the US economy, reinforcing prospects for two more rate cuts this year—supportive of the non-yielding yellow metal.
⭐️Personal comments NOVA:
The buying power shows no signs of stopping, breaking 4217 and continuing to increase in price. The whole market is very excited and focusing on investing in gold as the safest asset.
⭐️SET UP GOLD PRICE:
🔥SELL GOLD zone: 4275 - 4277 SL 4282
TP1: $4265
TP2: $4250
TP3: $4240
🔥BUY GOLD zone: $4154-$4152 SL $4147
TP1: $4165
TP2: $4180
TP3: $4190
⭐️Technical analysis:
Based on technical indicators EMA 34, EMA89 and support resistance areas to set up a reasonable BUY order.
⭐️NOTE:
Note: Nova wishes traders to manage their capital well
- take the number of lots that match your capital
- Takeprofit equal to 4-6% of capital account
- Stoplose equal to 2-3% of capital account

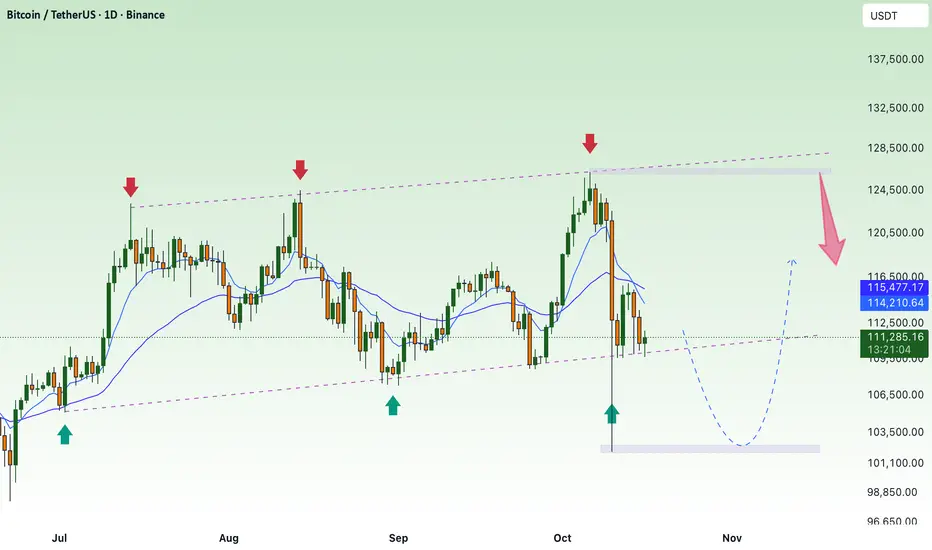
BTC mainly accumulates, remaining force decreasesBTC Technical Analysis (1D Chart)
Bitcoin continues to move inside a rising channel, where the upper trendline has repeatedly acted as strong resistance (around $125,000–126,000), and the lower boundary has held as key support near $108,000.
After the recent rejection at the upper boundary, price has pulled back sharply and is now approaching the support zone at $108,000–108,500, which aligns with:
The bottom trendline of the ascending channel
The 200-day EMA (white line)
A previous reaction zone marked by strong bullish reversals in the past
If the support holds, BTC may see a technical rebound toward the EMA89–EMA34 zone around $114,000–115,000, or even back to the channel resistance near $125,000.
However, if price breaks below $108,000, it would confirm a bearish breakout from the channel, potentially opening the way toward $100,000–102,000.
Key Levels to Watch
Resistance: $114,000 – $115,800 / $125,000 – $126,000
Support: $108,000 – $108,500 (critical zone)
Trend: Neutral to bullish inside channel; bearish breakdown if $108K fails
Gold price continues to break above 4200⭐️GOLDEN INFORMATION:
Gold (XAU/USD) surges to a new all-time high in Wednesday’s Asian session, with bulls eyeing the $4,200 mark amid mounting global uncertainty. Renewed US-China trade tensions, the prolonged US government shutdown, and ongoing geopolitical risks continue to drive safe-haven demand. Meanwhile, dovish Federal Reserve expectations and a softer US Dollar further support the metal’s strong uptrend, with buyers largely unfazed by overbought conditions.
⭐️Personal comments NOVA:
Gold price continues to break out near 4200, strong buying power continues to increase price, US government is still closed, gold price continues to increase
⭐️SET UP GOLD PRICE:
🔥SELL GOLD zone: 4235 - 4237 SL 4242
TP1: $4220
TP2: $4210
TP3: $4200
🔥BUY GOLD zone: $4093-$4091 SL $4086
TP1: $4105
TP2: $4120
TP3: $4130
⭐️Technical analysis:
Based on technical indicators EMA 34, EMA89 and support resistance areas to set up a reasonable BUY order.
⭐️NOTE:
Note: Nova wishes traders to manage their capital well
- take the number of lots that match your capital
- Takeprofit equal to 4-6% of capital account
- Stoplose equal to 2-3% of capital account

The bulls are too dominant, prices continue to increase⭐️GOLDEN INFORMATION:
Gold (XAU/USD) extends its record-breaking rally above $4,100 in Tuesday’s Asian session, fueled by safe-haven demand amid the ongoing US government shutdown and renewed US-China trade tensions. Geopolitical risks and rising expectations of further Federal Reserve rate cuts also continue to underpin the non-yielding metal.
⭐️Personal comments NOVA:
Selling pressure is almost absent in the market, buying pressure continues to push gold prices up. Continue waiting for a new ATH today.
⭐️SET UP GOLD PRICE:
🔥SELL GOLD zone: 4212 - 4214 SL 4219
TP1: $4200
TP2: $4185
TP3: $4162
🔥BUY GOLD zone: $4058-$4056 SL $4051
TP1: $4070
TP2: $4090
TP3: $4105
⭐️Technical analysis:
Based on technical indicators EMA 34, EMA89 and support resistance areas to set up a reasonable BUY order.
⭐️NOTE:
Note: Nova wishes traders to manage their capital well
- take the number of lots that match your capital
- Takeprofit equal to 4-6% of capital account
- Stoplose equal to 2-3% of capital account

EURUSD 4H – Bullish Recovery from Holding ZoneFX:EURUSD
Structure | Trend | Key Reaction Zones
Price respected the holding zone (1.154–1.156) with a clean liquidity sweep below.
Bullish structure forming within a descending channel, indicating a possible breakout toward 1.17+.
Buyers are currently stepping in, defending demand after a deep corrective move.
Market Overview
After multiple rejections from the resistance zone, EURUSD has dropped into a high-value demand region, where smart money accumulation is visible. The pair bounced from the holding zone with a strong bullish candle, suggesting possible recovery toward mid-channel levels. If structure breaks above 1.162 cleanly, a continuation toward 1.17–1.172 is expected before any major retracement.
Key Scenarios
✅ Bullish Case 🚀 → 🎯 Target 1: 1.165 | 🎯 Target 2: 1.172 | 🎯 Target 3: 1.178
❌ Bearish Case 📉 → 🎯 Target 1: 1.150 | 🎯 Target 2: 1.141
Current Levels to Watch
Resistance 🔴 : 1.165 – 1.172
Support 🟢 : 1.155 – 1.150
⚠️ Disclaimer: For educational purposes only. Not financial advice.

Tariff tensions - the driving force behind gold price increases✍️ NOVA hello everyone, Let's comment on gold price next week from 10/13/2025 - 10/17/2025
⭐️GOLDEN INFORMATION:
Gold (XAU/USD) climbs during the North American session on Friday, trading near $3,997, up 0.6%, as renewed US-China trade tensions, the ongoing US government shutdown, and expectations of further Fed easing fuel safe-haven demand. Risk sentiment deteriorated after President Donald Trump warned of new tariffs on China, which threatened countermeasures on rare earth exports, while Trump dismissed the need to meet President Xi Jinping later this month.
⭐️Personal comments NOVA:
Tariff tensions return, US government remains shut. Gold price maintains bullish momentum above 4000
🔥 Technically:
Based on the resistance and support areas of the gold price according to the H4 frame, NOVA identifies the important key areas as follows:
Resistance: $4058, $4100
Support: $3980, $3942, $3895
🔥 NOTE:
Note: Nova wishes traders to manage their capital well
- take the number of lots that match your capital
- Takeprofit equal to 4-6% of capital account
- Stoplose equal to 2-3% of capital account
- The winner is the one who sticks with the market the longest

BTCUSD 4H – Preparing for a Breakout 🚀 BITSTAMP:BTCUSD
Market Overview
BTC is consolidating just under the key breakout zone, showing signs of strength after rebounding from demand. A clean breakout and retest above 123.9K could trigger a sharp move toward 125.6K, with extended targets at 126.2K–127.4K, where psychological resistance awaits.
Key Scenarios
✅ Bullish Case 🚀 → 🎯 Target 1: 125.6K | 🎯 Target 2: 126.2K | 🎯 Target 3: 127.4K
❌ Bearish Case 📉 → If BTC loses 122K support, expect correction back toward 120.8K.
Current Levels to Watch
Resistance 🔴: 123.9K – 125.6K
Support 🟢: 121.8K – 122.2K
⚠️ Disclaimer: This analysis is for educational purposes only. Not financial advice.
