CAKE/USDT Bullish Trend Continues? Heres My Trade Plan📊 CAKE/USDT Trade Setup Overview
Taking a closer look at CAKE/USDT, price action has been moving nicely with a strong bullish trend on the 4H chart — printing consistent higher highs and higher lows 🔼📈.
Right now, it’s looking a little overextended, and I’m eyeing a potential pullback into my optimal entry zone around the 50%–61.8% Fibonacci retracement level 🎯📉.
That’s my point of interest, but it's important to keep in mind that the pullback may either be shallow or extend deeper before stabilizing 🌀. The key for me is to wait for price to find support in that zone, followed by a bullish break in market structure on the lower timeframe (15m or 30m) 🧱✅ — that would be my signal to enter long.
This is not financial advice — always do your own analysis before trading. ⚠️
Cakeusdtsignal

CAKEUSDT - Weekly Breakout Watch | End of the Bear Era?After enduring a brutal multi-year downtrend since 2021, CAKE/USDT is now showing clear signs of a possible major trend reversal. The weekly chart is forming an extremely compelling setup, with the price testing the upper edge of a long-term descending trendline, signaling a high-probability breakout scenario.
📉 Multi-Year Downtrend Nearing Its End
The yellow descending trendline drawn from the 2021 all-time high has served as a strong resistance for over 3 years.
Price is now trading just below the trendline, teasing a breakout.
A clean breakout above this structure would mark the transition from distribution to re-accumulation — a key signal for long-term bulls.
📈 Pattern Structure & Key Zones
Descending Triangle Breakout in progress: This classical pattern often indicates a major reversal, especially after a long period of consolidation.
Breakout Trigger Zone: 3.45 – 4.18 USDT
Validation Zone (Confirmation Resistance): 4.75 USDT
Mid-Term Target Zone: 10.04 – 12.84 USDT
Long-Term Targets (If momentum continues): 24.75 – 40.86 USDT
🟢 Bullish Scenario
If weekly candles close convincingly above the 3.45 – 4.18 USDT range:
A breakout confirmation would be in place.
Price could rally +200% to the 10 – 13 USDT region in the mid term.
If that resistance breaks, the next leg could reach 24 – 40 USDT, in line with previous cycle recovery structures.
Strong altcoin sentiment and volume spike would strengthen the bullish case.
---
🔴 Bearish Scenario
Failure to break and hold above the trendline could trigger a rejection.
Breakdown below 2.84 USDT would invalidate the breakout and shift structure back to consolidation or downside.
In a worst-case scenario, price could revisit 1.05 USDT, the all-time cycle low.
This bearish outcome could be catalyzed by macro volatility or Bitcoin correction.
📌 Key Support & Resistance Levels
Level Significance
1.05 USDT Macro Support (Cycle Low)
2.84 USDT Accumulation Support
3.45 USDT Breakout Trigger
4.18 – 4.75 USDT Confirmation & Retest Zone
10.04 – 12.84 USDT Mid-Term Target
24.75 – 40.86 USDT Major Resistance Zone
📊 Conclusion
CAKE/USDT is at a critical inflection point. A breakout from this long-standing weekly trendline could spark a powerful multi-month rally. The current setup resembles early-stage reversals seen in other altcoins prior to explosive moves.
If confirmed, this breakout might mark the beginning of a new bull cycle for CAKE — but traders should stay disciplined and monitor volume and price action closely to avoid potential traps.
#CAKEUSDT #CryptoBreakout #TrendlineBreakout #WeeklyChart #AltcoinSetup #TechnicalAnalysis #PancakeSwap #CryptoReversal #AltcoinSeason

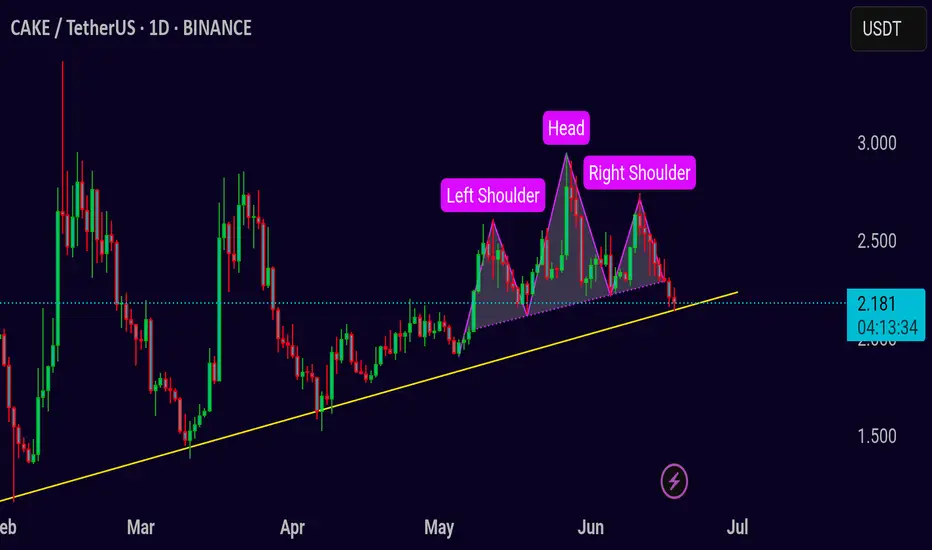
CAKE/USDT – Head & Shoulders Breakdown in Play Pair: CAKE/USDT 💱
Timeframe: 1D 📅
Pattern: Head and Shoulders Top 🧠
CAKE is developing a clear head and shoulders pattern on the daily chart, often seen as a bearish reversal setup. Price is currently testing the neckline support around 2.18, which also aligns with an ascending trendline. A breakdown here could trigger downside continuation.
Bearish scenario ❌
If CAKE closes below the neckline and trendline (under 2.15–2.10):
🎯 Target 1: 1.85
🎯 Target 2: 1.55
🛑 Stop loss: above 2.45 (right shoulder top)
Bullish reclaim ✅
If bulls defend the neckline and reclaim 2.35 with strong volume, the pattern may invalidate and lead to a rally.
⚠️ Volume confirmation is key — wait for a clean break and retest for confirmation.
CAKE is flying in its skyCAKE is just started to fly. This is just a begin to its parabola. I need to tell again that if Bitcoin remains above 100k in the following weeks, a powerful fundamental news from Pancakeswap team will send CAKE price to the moon. Remember that the Pancakeswap version 4 is scheduled to be launched at 2025, Q3.
In my opinion, CAKE will be one of the pioneer and highly gained coins at the following altseassion. May be a life changing opportunity ...
-------------------------------------
Share and follow me for further updates.

CAKE retesting done. Ready to fly?As we discussed earlier, NASDAQ:CAKE retested the resistance line successfully. Now it is ready to fly. If Bitcoin remains above 100k in the following weeks, we look forward to powerful fundamental news from Pancakeswap team (e.g. launching Pancakeswap V4) to send NASDAQ:CAKE price to the moon. Fill your bags and get ready ...
-------------------------------------
Share and follow me for further updates.

Will $cake blove minds?The NASDAQ:CAKE , which is the official token of the most familiar decentralized exchange on BSC (Pancakeswap), is now broke the symmetric triangle on its USDT chart from the top side. Taking into account exciting fundamental news about launching Pancakeswap V4 in a couple of weeks, I think it will reach higher price levels.
My golden target level is: $6

CAKEUSDT 1D AnalysisCAKE ~ 1D Analysis
#CAKE Buy after successfully penetrating the resistant line from this pattern with a short -term target of at least 10%+

#CAKEUSDT is setting up for a breakout📉 Long BYBIT:CAKEUSDT.P from $2,710
🛡 Stop loss $2,607
1h Timeframe
⚡ Plan:
➡️ POC is 2,515
➡️ Waiting for consolidation near resistance and increased buying activity before the breakout.
➡️ Expecting an impulsive upward move as buy orders accumulate.
🎯 TP Targets:
💎 TP 1: $2,790
💎 TP 2: $2,870
💎 TP 2: $2,920
🚀 BYBIT:CAKEUSDT.P is setting up for a breakout—preparing for an upward move!

CAKEUSDT, maybe a Long opportunity ?Hello Traders, Hope you are doing great.
for upcoming days I expect continuation of downward correction at first and after that another upward movement to specified Dashed lines.
Don't forget to use proper risk management .
and finally tell me What are your thoughts about CAKE ? UP or DOWN ? comment your opinion below this post.

#CAKEUSDT – Bearish Scenario, Expecting a Breakdown📉 SHORT BYBIT:CAKEUSDT.P from $2.030
🛡 Stop Loss: $2.058
⏱ 1H Timeframe
⚡ Trade Plan:
✅ The BYBIT:CAKEUSDT.P price previously formed a Falling Wedge pattern and three bottoms (Bottom 1, Bottom 2, Bottom 3), followed by a bounce.
✅ However, the asset is trading below POC (Point of Control) at $2.504, which acts as strong resistance. If the price fails to hold above the current levels, a downward continuation is likely.
🎯 TP Targets:
💎 TP 1: $2.008
🔥 TP 2: $1.986
⚡ TP 3: $1.970
📢 A close below $2.030 would confirm further downside movement.
📢 POC at $2.504 is a key volume area acting as resistance.
📢 Increasing volume on the decline signals strong seller activity.
📢 Taking partial profits at TP1 ($2.008) is a smart risk-management strategy.
🚨 BYBIT:CAKEUSDT.P remains under selling pressure – monitoring for confirmation and securing profits at TP levels!

CAKEUSDT 1WCAKE ~ 1W Analysis
#CAKE This is the lowest support for now. buy gradually from here with a minimum target of 20%+

CAKEUSDT 1WCAKE ~ 1W
#CAKE Testing this Support Level,. If you still have Conviction on the coin,. This support block will be a very good purchase for when,. Buy in stages with a minimum target of 20%+

Long, target 2.8, 25% gainFollowing weekly chart.
I got a long signal from my 3 power indicators. I did a lot profit from the same setup today with sushiusdt, please check it out.
It can go far long but my target is 2.8.
I'd stop below 1.69 candle close.

cakeusdt gold signal Hi
#CAKE has broken out of the symmetrical triangle with high volume and has also surpassed the horizontal resistance. An upward move is anticipated as long as it continues to trade above the horizontal support,
buy zone : 2.90 to 3.15
targets:
3.30-3.46-3.60
thank you follow me

#CAKE/USDT#CAKE
The pair has been moving in a descending triangle since April 2022
The price broke the upper border of the triangle
Supported by the momentum of the Moving Average 100 that is about to be broken
Oversold on MACD
It is expected to break the Moving Average 100, heading toward upward targets
The price now is 20.2
The first goal is 90.4
Second goal 9.30
Which represents 400% of the current price
Support and resistance points must be taken into account as there are possible corrections that may take some time during the rise
✅Thank you, for more ideas, hit 🚀 and follow 🤝🛎!

CAKEUSDT Elliott Waves AnalysisHello friends.
Please support my work by clicking the LIKE button👍(If you liked). Also i will appreciate for ur activity. Thank you!
Everything on the chart.
Entry zone: 2.1 - 1.8
Targets: will depends on market structure, but minimal target will be 5$, there need to fix atleast half of pos.
If we will draw impulse then next target will be 10$ zone.
Stop: ~1.2 (depending of ur risk). ALWAYS follow ur RM .
RR: 1 to 10
risk is justified
Good luck everyone!
Follow me on TRADINGView, if you don't want to miss my next analysis or signals.
It's not financial advice.
Dont Forget, always make your own research before to trade my ideas!
Open to any questions and suggestions

best for short-term(CAKE)❤️❤️Thanks for boosting 🚀 and supporting us!
📊 (Entry) : 3.663
🔴 Stop Loss : 3.847
🎯 Take Profit : 3.452-3.284
🔗 For more communication with us, In the footnote and send a message in TradingView.
👨🎓 Experience and Education: Our trading team has five years of experience in financial markets, especially cryptocurrencies.

Delicious Cake ❤️❤️Thanks for boosting 🚀 and supporting us!
📈Optimal entry for a broken price is $2.371 on the trendline, and similarly, entry with the activation of a position on the broken sresistance is $2.5154.
📊 (Buy) : 2.371
🔴 Stop Loss : 2.067
🎯 Take Profit : 3.120
🔗 For more communication with us, send a message in TradingView.

"CAKE/USDT Long Trade Setup: Symmetrical Triangle Breakout SignTrade Setup for CAKE/USDT: Long Position
Analysis:
CAKE is exhibiting a symmetrical triangle pattern, indicating a potential breakout with a strong rebound.
The current market trend supports a bullish outlook.
Entry:
Entry Point: Current Market Price (CMP)
Additional Positions: Consider adding more if the price drops to $2.38.
Targets:
$2.56
$2.7
$2.9
$3.2
Stop Loss (SL):
Set the Stop Loss at $2.285 to limit potential losses.
Leverage:
Use leverage cautiously: 5x to 10x.
DYOR

CAKEUSDT.1DBased on the provided market data, the CAKE/USDT pair is currently trading at $2.444. The Relative Strength Index (RSI) over 4 hours is 46.19, which is relatively neutral. This suggests that the asset is neither overbought nor oversold. The Moving Average Convergence Divergence (MACD) for the same period is at -0.011, which indicates a bearish signal, as the MACD line is below the signal line.
The Bollinger Bands (BB) 4-hour value is at 2.443, which is almost equal to the current price. This suggests that the price is fluctuating near the middle band, indicating a sideways movement.
The first, second, and third support levels over 4 hours are at $2.276, $2.049, and $1.780 respectively, while the resistance levels are at $2.746, $2.828, and $2.293 respectively.
Looking at the 1-day data, the RSI is at 61.18, indicating a bullish momentum as it is above 50. The MACD is at 0.264, which is a bullish signal. The BB value is at 2.811, which is higher than the current price, indicating a potential upward movement. The support levels are at $2.198, $1.666, and $1.280, while resistance levels are at $2.857, $4.009, and $4.719.
As for the 7-day data, the RSI is at 67.78, indicating a strong bullish momentum. However, the MACD is at -0.0055, which is a bearish signal. The BB value is at 2.930, which is higher than the current price, indicating a potential upward movement. The support levels are at $1.507, $1.083, and $0.650, while resistance levels are at $4.075, $4.810, and $5.490.
In conclusion, the short-term (4-hour) indicators suggest a bearish or sideways trend while the medium (1-day) and long-term (7-day) indicators suggest a bullish trend. It seems that there might be some short-term downward or sideways movement before the price potentially starts to rise again. Please note that this analysis is based on historical data and does not guarantee future performance. Always do your own research and consider your risk tolerance before making investment decisions.

CAKEUSDTBINANCE:CAKEUSDT can pump more than you think
⛔"Daily crypto market analyses I provide are personal opinions & not financial advice. Trading carries risks, so do your own research & seek advisor's help.#DYOR"
Don't forget to like and comment

CAKEUSDT Elliott Waves Analysis (LONGTERM)Hello friends.
Please support my work by clicking the LIKE button👍(If you liked). Also i will appreciate for ur activity. Thank you!
Everything on the chart.
Waiting for last upward movement in zone 2.8 - 3$, then will be deep correction.
Targets: 5
after first target reached move ur stop to breakeven
Stop: ~1 (depending of ur risk). ALWAYS follow ur RM .
RR: 1 to 14
risk is justified
Good luck everyone!
Follow me on TRADINGView, if you don't want to miss my next analysis or signals.
It's not financial advice.
Dont Forget, always make your own research before to trade my ideas!
Open to any questions and suggestions

CAKEUSDT Elliott Waves Analysis (Global Vision)Hello friends.
Please support my work by clicking the LIKE button👍(If you liked). Also i will appreciate for ur activity. Thank you!
Everything on the chart.
BUY ZONE: 1.1 - 0.7
minimal target zone: 2.5 - 3
Stop: (depending of ur risk). ALWAYS follow ur RM .
risk is justified
Good luck everyone!
Follow me on TRADINGView, if you don't want to miss my next analysis or signals.
It's not financial advice.
Dont Forget, always make your own research before to trade my ideas!
Open to any questions and suggestions
