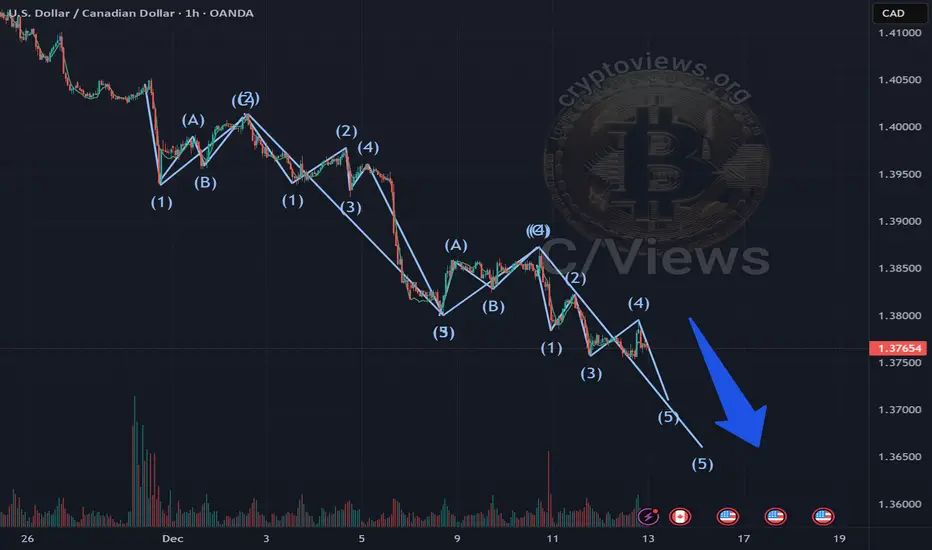
CADX Showing Potential Completion of Elliott Wave StructureCADX is forming a 5th Elliott wave, which suggests the movement is more likely to continue downwards
Based on the 2nd wave, we can estimate the approximate length of the 5th wave
Price movement levels are more likely to be determined using Fibonacci numbers
Full breakdown with levels and graphs on the website
Canadiandollar
UASDCAD: Bearish! A Little Pullback, Then Down!The USD has been weakened over the past couple of weeks. Markets are at a 90% pchance the Fed cut rates by .25 bp, and that Trump will be installing Hasset, a loyalist, as Fed Chair. Couple that with the positive job numbers that Canada announced last week, and you see the downward trajectory of the USDCAD heading down.
It seems very likely that we will see more movement downtown this week.
I am expecting an OHLC candle for the week ahead.
The Draw on liquidity (DOL) would likely be the relative equal lows to the left.
May profits be upon you.
Disclaimer:
I do not provide personal investment advice and I am not a qualified licensed investment advisor.
All information found here, including any ideas, opinions, views, predictions, forecasts, commentaries, suggestions, expressed or implied herein, are for informational, entertainment or educational purposes only and should not be construed as personal investment advice. While the information provided is believed to be accurate, it may include errors or inaccuracies.
I will not and cannot be held liable for any actions you take as a result of anything you read here.
Conduct your own due diligence, or consult a licensed financial advisor or broker before making any and all investment decisions. Any investments, trades, speculations, or decisions made on the basis of any information found on this channel, expressed or implied herein, are committed at your own risk, financial or otherwise.

USDCAD plunges as BOC vs Fed divergence grows! Can it continue?USDCAD has broken sharply lower following Canada's surprise jobs blowout on Friday, with the pair now pricing in a divergence: the Bank of Canada is expected to hold rates Wednesday, while the Fed is expected to cut.
Canada added 54,000 jobs in November, and the unemployment rate plunged to 6.5%, taking a BOC cut off the table. Meanwhile, the Fed is 90% priced to cut by 25bps on Wednesday, narrowing the rate differential and weakening the US dollar against the loonie.
Key drivers
Canada jobs report beat expectations with +54k positions (vs expected loss), unemployment fell to 6.5% from 6.9% — three straight months of gains totalling 181k jobs.
BOC decision this week virtually certain to hold at 2.25% after cutting in October and signalling the easing cycle is likely over.
Fed FOMC decision on Wednesday priced in at 90% odds for a 25bps cut to 3.75–4%, the third consecutive cut driven by cooling US labour and dovish Fed commentary.
Technical: USDCAD corrected to 50% Fibonacci (1.4140–60) of the 1.4790–1.3543 impulse leg and is now breaking down in a potential head and shoulders pattern with neckline at 1.3543.
Downside targets: 1.3370–1.3396 (61.8% extension + 50% retracement confluence), 1.3068 (61.8% retracement), and 1.2895 (100% extension full measured move).
Risk scenario: Neckline hold above 1.3543 could see bounce back toward 1.36 or 1.43, but below 1.4140, the path of least resistance is lower.
Are you trading the USDCAD breakdown? Share your head and shoulders setups in the comments and follow for more central bank divergence and technical trade ideas.
This content is not directed to residents of the EU or UK. Any opinions, news, research, analyses, prices or other information contained on this website is provided as general market commentary and does not constitute investment advice. ThinkMarkets will not accept liability for any loss or damage including, without limitation, to any loss of profit which may arise directly or indirectly from use of or reliance on such information.

USDCAD: Buyers Defend Support — Recovery Ahead?USDCAD is reacting firmly inside a high-value support pocket, where the channel baseline, prior demand, and heavy volume clustering align — a classic area where sentiment often shifts.
Despite the market already pricing in December Fed rate cuts, short-term price behavior on this pair remains resilient. The latest bounce suggests that buyers are stepping back in, keeping my near-term outlook tilted to the upside, with room for a rotation toward the 1.4080 zone if momentum continues to build. However, if price breaks below the current support zone, USDCAD could slide even further, opening the door to a deeper corrective leg.
The real question now is:
Are we witnessing the beginning of a genuine recovery leg, or just a temporary relief move before direction resets?
Based on :
- fundamental analysis
- volume and quantitative analysis

USDCAD starting a massive 2-year rally.The USDCAD pair has been trading within a Channel Up since the May 31 2021 market bottom. In recent weeks it broke above its 1W MA50 (blue trend-line) following a June 16 2025 Higher Low, just above the 1W MA200 (orange trend-line), which has been holding as the natural Support since September 2022.
Given the potential peak on the 1W CCI and the similarities with the previous Higher Low bottom formations, we expect the pair to start the new long-term Bullish Leg. With the previous two Bullish Legs rising by at least +13.00%, we anticipate the price to reach 1.53000 within 2 years time.
---
** Please LIKE 👍, FOLLOW ✅, SHARE 🙌 and COMMENT ✍ if you enjoy this idea! Also share your ideas and charts in the comments section below! This is best way to keep it relevant, support us, keep the content here free and allow the idea to reach as many people as possible. **
---
💸💸💸💸💸💸
👇 👇 👇 👇 👇 👇

USDCAD Bullish Swing SetupIdentify Fibonacci Support Levels
Use Fibonacci retracement to find key support zones such as the 0.382, 0.5, and 0.618 levels where price often reacts or reverses.
Wait for Reversal Confirmation
Enter only after confirming a trend reversal on the 1-hour chart using candlestick patterns (like engulfing or pin bars), RSI divergence, or a structure break.
Maintain RRR of 1:3
Plan every trade with at least a 1:3 risk-to-reward ratio for every 1% you risk, aim to gain 3%.
Follow Strict Risk Management
Never risk more than 2% of your account balance on a single trade. Adjust your lot size based on stop-loss distance to protect your capital.

Why the US Dollar Dominates the Loonie?The USD/CAD pair trades near 1.4100, reflecting the US Dollar's (USD) persistent strength against the Canadian Dollar (CAD). This rally to seven-month highs stems from powerful structural and cyclical forces. We observe a widening monetary policy divergence and geopolitical uncertainty that favors the USD. Analyzing macroeconomics, fiscal policy, and trade reveals why the CAD struggles to sustain gains, despite positive Canadian data.
Geopolitics and Geostrategy: North American Trade Friction
Trade uncertainty directly pressures the CAD. Recent trade tensions with the US create significant CAD headwinds. Prime Minister Mark Carney apologized for an anti-tariff advertisement, but President Trump reportedly rejected resuming trade talks. This situation keeps bilateral trade risk elevated, undermining business confidence in Canada. US court proceedings over broad tariffs further inject political risk into the U.S.-Canada relationship, threatening key sectors like the auto industry.
The USD functions as the global reserve safe-haven anchor. Global investors gravitate toward USD assets during times of geopolitical friction. This geostrategic function offers the USD a structural advantage over the commodity-linked CAD, reinforcing the pair's upward momentum.
Macroeconomics: Diverging Rate Paths
The primary driver remains the widening interest rate differential. Strong US data bolsters the Federal Reserve's (Fed) hawkish stance. US ADP Employment climbed by 42,000 in October, reversing the prior decline. ISM Services PMI also rose to 52.4, exceeding forecasts. This resilience strengthens the USD.
The Fed maintains a cautious approach toward future rate cuts. CME FedWatch Tool data shows traders reduced the probability of a December Fed cut to 62% from 68%. Conversely, the Bank of Canada (BoC) has already cut its policy rate to 2.25%. Although the BoC signaled an easing cycle pause, markets focus on expected future divergence. This policy gap favors dollar-denominated assets, pushing the USD/CAD higher.
Economics and Fiscal Policy Headwinds
Canada's fiscal policy adds downward pressure on the CAD. The new Canadian budget projects the fiscal deficit will more than double this year. Deficit projections reach -2.5% of GDP for 2025/26 and -2.0% for 2026/27, representing material fiscal loosening. Markets interpret this spending as potentially inflationary without sufficient growth, weakening the CAD.
Furthermore, the CAD remains highly sensitive to crude oil prices. West Texas Intermediate (WTI) crude trades near $\$60.00$ per barrel, declining slightly. As a major oil exporter, softer energy prices negatively impact Canada's terms of trade and export revenue, directly pressuring the Loonie.
Technology and Patent Analysis: The Competitiveness Gap
Structural economic factors underpin the CAD weakness. Canada faces an ongoing competitiveness gap with the US, particularly in high-tech and innovation sectors. Persistent lower productivity growth in Canada compared to the US makes the Canadian economy less appealing for long-term capital investment.
The US economy demonstrates superior labor productivity growth and strong performance in advanced industries. This technology and innovation lag limits the CAD's potential for sustained appreciation. The US also benefits from acting as a "black hole" attraction for Canadian talent and intellectual property. This fundamental economic divergence provides structural support for the Greenback's long-term dominance.

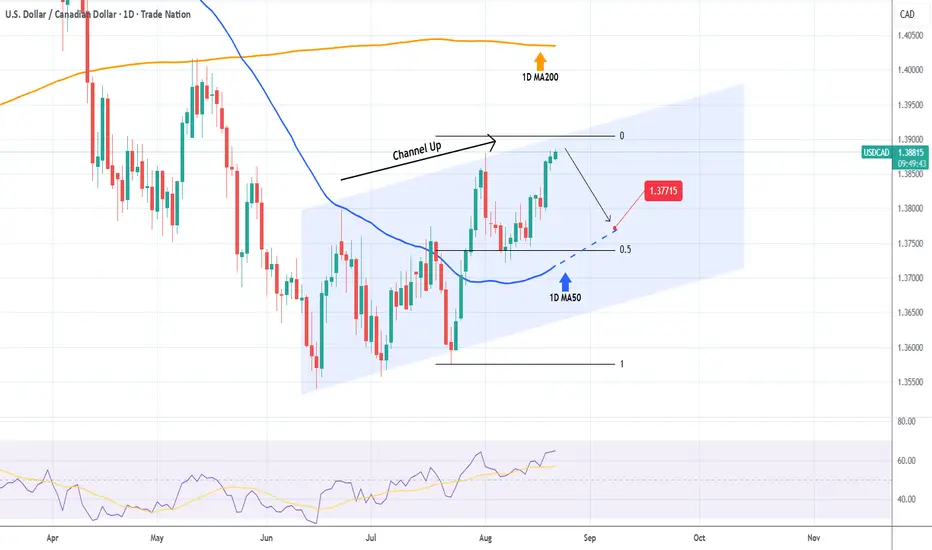
USDCAD Rejected on its 1D MA200. Sell signal.Last time we looked at the USDCAD pair (August 21, see chart below), the Channel Up gave us an excellent sell signal right on its top, which easily hit our 1.37715 Target:
The market is currently giving us a strong signal yet again as the price not only hit the top of its Channel Up but also the 1D MA200 (orange trend-line) for the first time since May 13 2025.
That was the time it suffered a brutal rejection to multi-month lows and again upon testing it yesterday, it is being rejected.
With the 1D RSI also hitting its own Resistance Zone, we expect the price to pull-back to at least its 0.5 Fibonacci retracement level, similar to August 07. As a result, our short-term Target is 1.8570.
-------------------------------------------------------------------------------
** Please LIKE 👍, FOLLOW ✅, SHARE 🙌 and COMMENT ✍ if you enjoy this idea! Also share your ideas and charts in the comments section below! This is best way to keep it relevant, support us, keep the content here free and allow the idea to reach as many people as possible. **
-------------------------------------------------------------------------------
💸💸💸💸💸💸
👇 👇 👇 👇 👇 👇

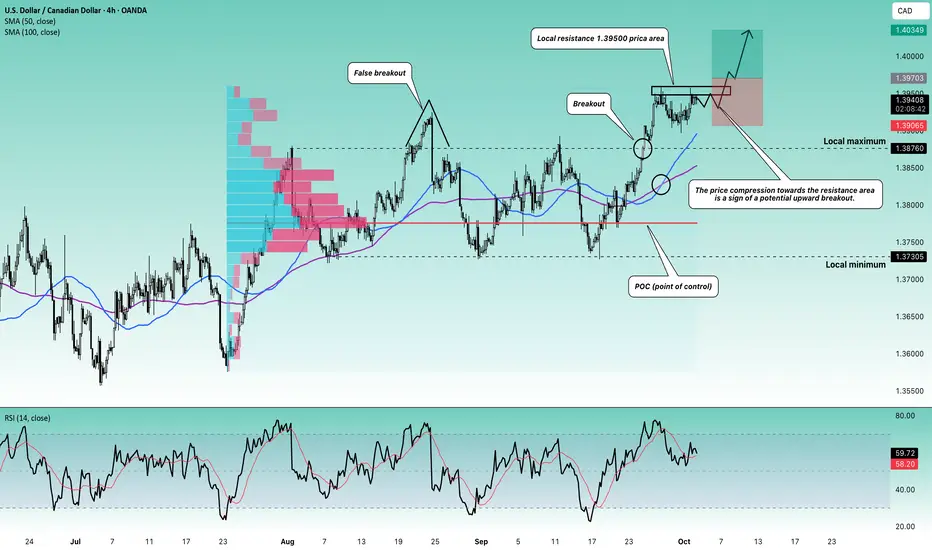
Stop!Loss|Market View: USDCAD🙌 Stop!Loss team welcomes you❗️
In this post, we're going to talk about the near-term outlook for the USDCAD currency pair☝️
Potential trade setup:
🔔Entry level: 1.39703
💰TP: 1.40349
⛔️SL: 1.39065
"Market View" - a brief analysis of trading instruments, covering the most important aspects of the FOREX market.
👇 In the comments 👇 you can type the trading instrument you'd like to analyze, and we'll talk about it in our next posts.
💬 Description: The price compression toward the 1.39500 resistance area indicates a potential upside breakout. Given the recent breakout of the 1.37305 - 1.38760 accumulation, a more significant upward movement to 1.4, 1.41, and then 1.43 is also expected. A conservative entry would be best looked for after the price immediately closes above 1.39500.
Thanks for your support 🚀
Profits for all ✅
❗️ Updates on this idea can be found below 👇
USD/CAD Maintains Bullish ConsolidationUSD/CAD Maintains Bullish Consolidation
USD/CAD is showing positive signs and might aim for more gains above 1.3960.
Important Takeaways for USD/CAD Analysis Today
- USD/CAD rallied above 1.3880 and 1.3920 before the bears appeared.
- There is a connecting bullish trend line forming with support at 1.3915 on the hourly chart.
USD/CAD Technical Analysis
On the hourly chart of USD/CAD, the pair formed a strong support base above the 1.3770 level. The US Dollar started a fresh increase above 1.3820 against the Canadian Dollar.
The pair cleared the 50-hour simple moving average and climbed above 1.3900. Finally, it tested the 1.3960 zone before the bears appeared. The pair traded below 1.3940 and the 50-hour simple moving average.
Initial support is near a connecting bullish trend line at 1.3915. It coincides with the 23.6% Fib retracement level of the upward move from the 1.3768 swing low to the 1.3958 high.
A downside break below the trend line might send the pair toward 1.3885. The next major area on the same USD/CAD chart could be the 50% Fib retracement at 1.3865. A close below 1.3865 could push the pair further lower. In the stated case, the bears might aim for a test of 1.3815.
On the upside, initial resistance sits near 1.3930 and the 50-hour simple moving average. The main breakout zone could be 1.3960. A clear upside break above 1.3960 could start another steady increase. The next major stop for the bulls might be 1.4000. Any more gains could open the doors for a test of 1.4050.
This article represents the opinion of the Companies operating under the FXOpen brand only. It is not to be construed as an offer, solicitation, or recommendation with respect to products and services provided by the Companies operating under the FXOpen brand, nor is it to be considered financial advice.

BoC signals two-way USDCAD opportunities Bank of Canada Governor Tiff Macklem has commended US Federal Reserve Chair Jerome Powell's for managing of a difficult environment well, and pointed out that political attacks on the Fed from President Trump are a concern for the BoC too.
For USDCAD, this means traders might start viewing Canada’s central bank as acting more independently, instead of just following the Fed. This could create more two-way trading opportunities.
On the 4-hour chart, USDCAD has shown clear range dynamics: immediate resistance sits near 1.3845–1.3880, a zone repeatedly rejecting advances through September, while the 1.3720 area has acted as strong demand. The higher lows since mid-September could suggest buyers are building strength though.
NZDCAD 4H PERSP.This technical analysis is again about sell and bear market! But with 4H timeframe.
As we see in this chart, we got oriented market on if the price will reach LL which is current most near and strong support level for this pair.
* PAWS ARE NEAR!!! GRR... xD
Have a profitable trading!

USDCAD: Bullish For The Near Term?Welcome back to the Weekly Forex Forecast for the week of Sept 8 - 12th.
In this video, we will analyze the following FX market: USDCAD
Last Week I was looking for weakness in the USDCAD. It traded through the bearish FVG on the Daily, moving higher as the CAD turned out to be even weaker last week.
Look for this to continue for the upcoming week, as there is internal range liquidity (IRL) drawing price higher for a short term gains.
Enjoy!
May profits be upon you.
Leave any questions or comments in the comment section.
I appreciate any feedback from my viewers!
Like and/or subscribe if you want more accurate analysis.
Thank you so much!
Disclaimer:
I do not provide personal investment advice and I am not a qualified licensed investment advisor.
All information found here, including any ideas, opinions, views, predictions, forecasts, commentaries, suggestions, expressed or implied herein, are for informational, entertainment or educational purposes only and should not be construed as personal investment advice. While the information provided is believed to be accurate, it may include errors or inaccuracies.
I will not and cannot be held liable for any actions you take as a result of anything you read here.
Conduct your own due diligence, or consult a licensed financial advisor or broker before making any and all investment decisions. Any investments, trades, speculations, or decisions made on the basis of any information found on this channel, expressed or implied herein, are committed at your own risk, financial or otherwise.

Canadian Dollar Falls After Labour Market Data ReleaseCanadian Dollar Falls After Labour Market Data Release
On Friday, disappointing figures showed that in August the Canadian economy lost 65,500 jobs (the forecast had been for an increase of 10,000), while the unemployment rate rose to 7.1%. This is the highest level of unemployment since May 2016, excluding the pandemic period.
It is believed that:
→ the deterioration in the labour market (primarily in manufacturing) is a consequence of the trade war with the United States;
→ the fall in employment in Canada has increased the likelihood that the Bank of Canada will resume its monetary easing campaign.
As a result, the CAD weakened sharply against other currencies. However, the depreciation against the US dollar was less pronounced, as the USD itself is under pressure from various factors.
Technical Analysis of USD/CAD
From a long-term perspective, the USD/CAD pair remains within a downward trend, highlighted by a red descending channel.
From a medium-term perspective, since July the rate has risen from the 1.3550–1.3600 support zone, forming an ascending channel (shown in blue).
Price action (indicated by arrows) shows that:
→ sellers are aggressive, pushing the price down from the upper boundary of the red channel;
→ buyers are aggressive, driving the price up from the lower boundary of the blue channel. Its median line acts as resistance.
This is compressing USD/CAD fluctuations into a pattern resembling a symmetrical narrowing triangle (shown in black), with recent overbought (1) and oversold (2) conditions on the RSI marking price reversals back into the triangle from its boundaries.
Thus, we could assume that supply and demand forces will keep USD/CAD in a state of temporary balance while awaiting key news next week:
→ 16 September – Canada CPI report;
→ 17 September – interest rate decisions from both the Bank of Canada and the Federal Reserve.
This article represents the opinion of the Companies operating under the FXOpen brand only. It is not to be construed as an offer, solicitation, or recommendation with respect to products and services provided by the Companies operating under the FXOpen brand, nor is it to be considered financial advice.
AUDCAD | Technical 4h. This scenario is about how the price action can continue in the next few!
The bears are stronger after this triple top resistance. So, we may see strong downhills. :)
GL!
Nika.

USDCAD ~ Cheapy Choapa? IDKThe triple top resistance is found on the USDCAD weekly chart!
What we may expect with it is a high-quality downtrend.
But for the reason "This chart is so beautiful," here I have to say,
We need to be careful about this position UNTIL confirmation on sell.
Nika.

GBPCAD ~ Wave Roads. Tech.Hi TradingView,
Hello Traders!
On VMWA, 800, the trend looks so resistant. From it we may expect more down ways...(The price may go up maximum and test 1.93895 and after again come back...)
SMA, 1200, right now, it's a huge resistance point.
So, wait for updates on this idea...
Leave a comment if you have a specific opinion about.
Have a Profitable Day.
Nika.

USDCAD Top of the Channel issues short-term sell signal.The USDCAD pair has been trading within a Channel Up since the 1D RSI Bullish Divergence started on the June 16 bottom and right now the price is approaching its top (Higher Highs trend-line) yet again.
With the 1D MA50 (blue trend-line) acting as Support, we expect as short-term pull-back (at least) as long as the 1D candles close within the pattern. Our Target is 1.37715.
-------------------------------------------------------------------------------
** Please LIKE 👍, FOLLOW ✅, SHARE 🙌 and COMMENT ✍ if you enjoy this idea! Also share your ideas and charts in the comments section below! This is best way to keep it relevant, support us, keep the content here free and allow the idea to reach as many people as possible. **
-------------------------------------------------------------------------------
Disclosure: I am part of Trade Nation's Influencer program and receive a monthly fee for using their TradingView charts in my analysis.
💸💸💸💸💸💸
👇 👇 👇 👇 👇 👇
NZDCAD ~ White Bear. Tech.It's the second time that the trend make retracement on Fibos 50.
But it look still price going down.
We got a few levels to check bellow. (Marked grey areas).
Have a profitable day!

Forex Bank Job: CAD/JPY Profit Extraction Strategy🏦 "Operation Loonie Lift-Off" – CAD/JPY Forex Heist Blueprint! 💰💣
🌟Hi! Hola! Ola! Bonjour! Hallo! Marhaba!🌟
To all fellow Market Bandits & Profit Seekers, 🕶️💸💼
We’ve scoped out our next target – the CAD/JPY vault – and the blueprint is ready. This isn’t just a trade... it's a full-blown Forex infiltration mission based on undercover technical and fundamental recon 🔎📊.
🎯 The Mission Plan:
📍Entry Point – The Vault's Backdoor
💥 Strike at Pullback Zones 1 & 2
→ Use 15–30 min timeframe to ambush at recent lows or swings.
The best loot lies in waiting – buy limits only!
🛡️Stop Loss – Escape Routes
Set SL like a pro thief:
Pullback 1 ➤ 104.800
Pullback 2 ➤ 105.600
Base it on your crew’s bankroll and lot size. Always prep a clean getaway.
🏁Target – Secure the Goods
Primary loot zone: 106.000
(Or vanish before heat arrives 🚓💨)
⚔️ Scalpers’ Special Ops:
Only operate long side. Big wallets = quick hits. Small stacks? Join the swing squad and trail your SL like a shadow 🕶️🔐.
🔥Why This Hit?
CAD/JPY is in bullish mood driven by:
COT shifts 📈
Sentiment setups 🧠
Macro flow + cross-asset whispers 🔄
🚨 But remember: market conditions flip like fake IDs. Stay alert.
🧠 Final Tips from HQ:
🔕 Avoid new ops during major news drops
💣 Use trailing SLs to lock profits before the sirens go off
💖 Smash that 💥BOOST💥 to fund the next big mission
💼 From the Black Market Desks of the Thief Trading Syndicate™
This ain't your grandpa's trade plan — it's a strategic smash-and-grab with style and smarts. 📡🔐
💬 Drop a comment, hit the like, and recruit more to the crew.
📍See you in the next chart heist. Keep it stealthy, sharp, and profitable. 🤑🚀👊

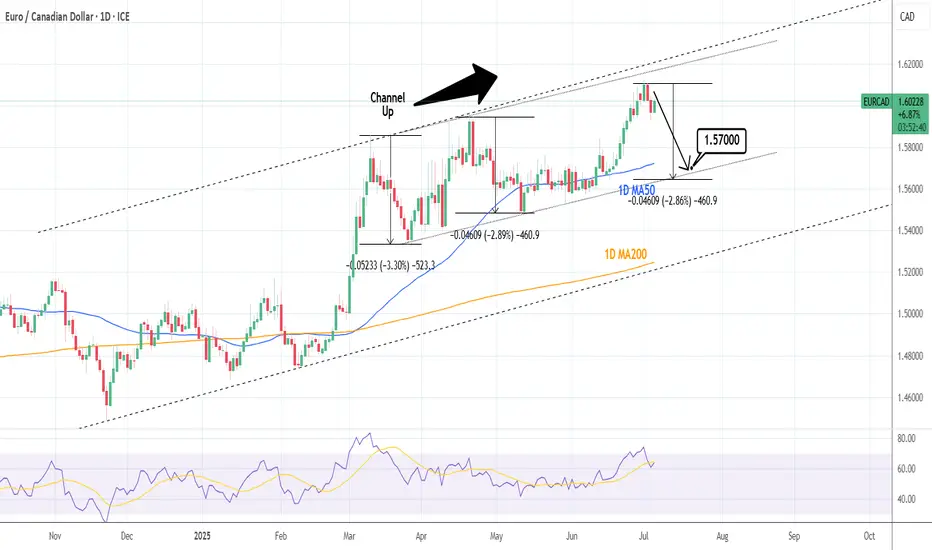
EURCAD: Sell signal on Double Channel Up Top.EURCAD is bullish on its 1D technical outlook (RSI = 63.955, MACD = 0.010, ADX = 41.562) having peaked on two Channel Up patterns at the same time. Technically it should now start the new bearish wave to test the bottom a little below the 1D MA50. Short, TP = 1.57000.
See how our prior idea has worked out:
## If you like our free content follow our profile to get more daily ideas. ##
## Comments and likes are greatly appreciated. ##
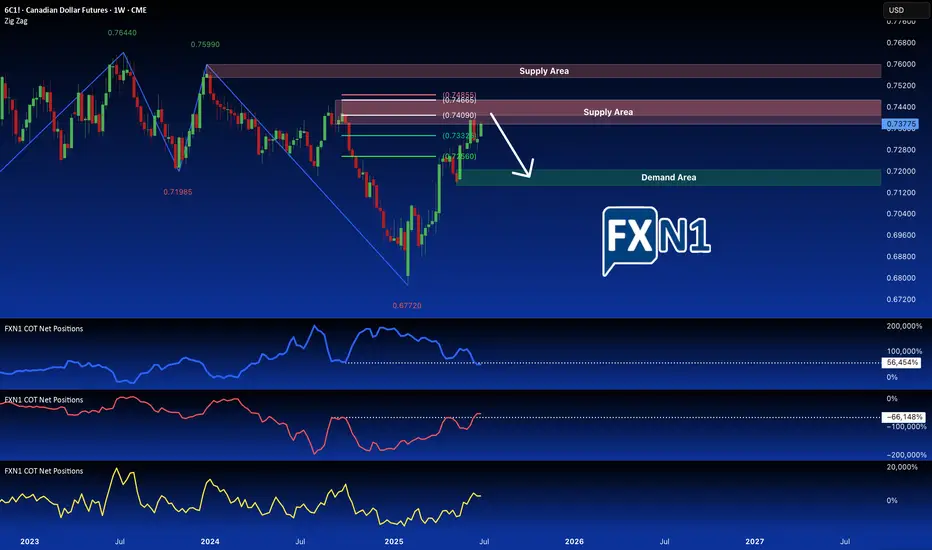
Canadian Dollar Futures (6C1!) Nears Key Monthly SupplyThe Canadian Dollar Futures (6C1!) remain in a downtrend, now testing a critical monthly supply zone after an initial rejection. With Commercials heavily short, Smart Money flat, and Retail traders still bullish, this setup favors another potential downside move. Traders should watch for a retest or breakout spike for optimal short entries.
COT Report: Who’s Betting on the Loonie?
Commercials (Big Players): Increasing short positions, signaling expectations of further downside.
Non-Commercials (Smart Money): Flat, showing hesitation—no strong conviction in either direction.
Retail Traders: Still net long, often a contrarian indicator at key turning points.
This alignment suggests that while momentum may see short-term bounces, the broader trend remains bearish.
✅ Please share your thoughts about 6C1! in the comments section below and HIT LIKE if you appreciate my analysis. Don't forget to FOLLOW ME; you will help us a lot with this small contribution.
USDCAD Strongest long-term Sell in the market right now.At the beginning of the year (January 15, see chart below), we made an unpopular bearish call at the time, hinting that the USDCAD pair was approaching its Resistance Zone, hence a multi-year Top was in order:
As you can see, the moment the price hit that Resistance Zone, it got instantly rejected and a new Bearish Leg started, which has extended up to this day. This time we view this on the 1M time-frame where the Support levels are more clearly illustrated.
More particularly, the 1M MA50 (blue trend-line) poses as the first one, in fact it has been holding since September 2022. Our Target is still located at 1.26000, which is marginally above the 0236 Fibonacci level, which has been the 1st Target during both previous Bearish Legs. Also it is where the 1M MA200 (orange trend-line) is headed to, and there are high chances of a long-term bounce there.
-------------------------------------------------------------------------------
** Please LIKE 👍, FOLLOW ✅, SHARE 🙌 and COMMENT ✍ if you enjoy this idea! Also share your ideas and charts in the comments section below! This is best way to keep it relevant, support us, keep the content here free and allow the idea to reach as many people as possible. **
-------------------------------------------------------------------------------
Disclosure: I am part of Trade Nation's Influencer program and receive a monthly fee for using their TradingView charts in my analysis.
💸💸💸💸💸💸
👇 👇 👇 👇 👇 👇
