EU Scalp (wrong bias) - Trump speech Came into the day with a neutral bias looking for some kind of retracement deeper into the hourly leg.
After a bearish London with bearish H1 order flow showing (H1 wicks + rejecting the Order block) we sell our liquidity shakeout right in the middle of New York session.
It's really got me interested was how close we came to the daily DOL (or so I thought) before retracing
Candlestick Analysis

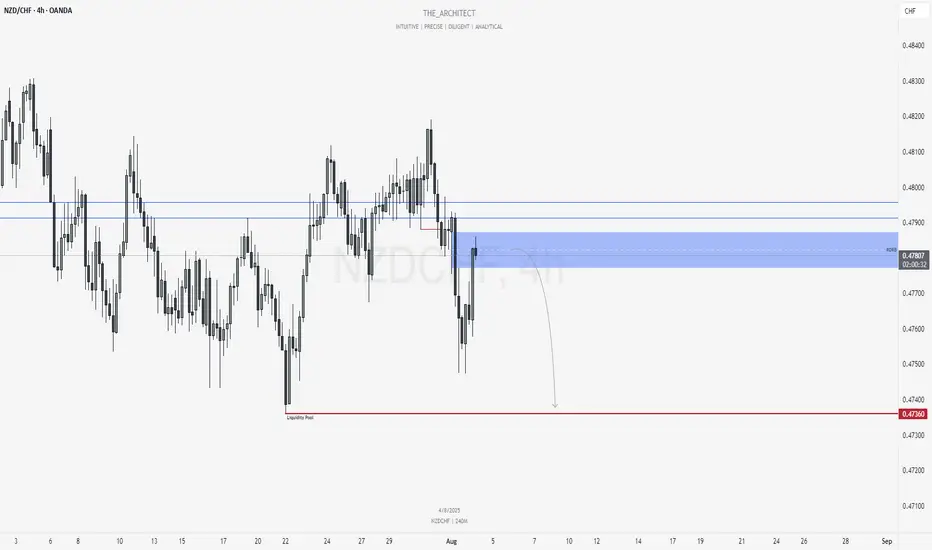
NZDCHF: Bearish Continuation from Re-Delivered Re-Balanced ArrayGreetings Traders,
In today’s analysis of NZDCHF, recent price action confirms the presence of bearish institutional order flow. As a result, we aim to align ourselves with this directional bias by identifying strategic selling opportunities.
Key Observations on H4:
Bearish Market Structure Shift: The H4 timeframe has recently confirmed a bearish shift in market structure, providing us with a clear framework to seek short setups in line with institutional momentum.
RDRB Resistance Zone: Price has retraced into a Re-Delivered Re-Balanced (RDRB) array—an area where prior institutional selling took place and has now been re-engaged. This region is expected to serve as resistance, offering a high-probability zone for confirmation entries to the downside.
Trading Plan:
Entry Strategy: Monitor lower timeframes (M15 and below) for bearish confirmation setups within the RDRB array.
Target Objective: The current draw on liquidity remains the liquidity pool residing at deeper discount levels, which aligns with our short bias.
For a detailed market walkthrough and in-depth execution zones, be sure to watch this week’s Forex Market Breakdown:
As always, stay disciplined, wait for clear confirmations, and manage your risk responsibly.
Kind regards,
The Architect 🏛️📉
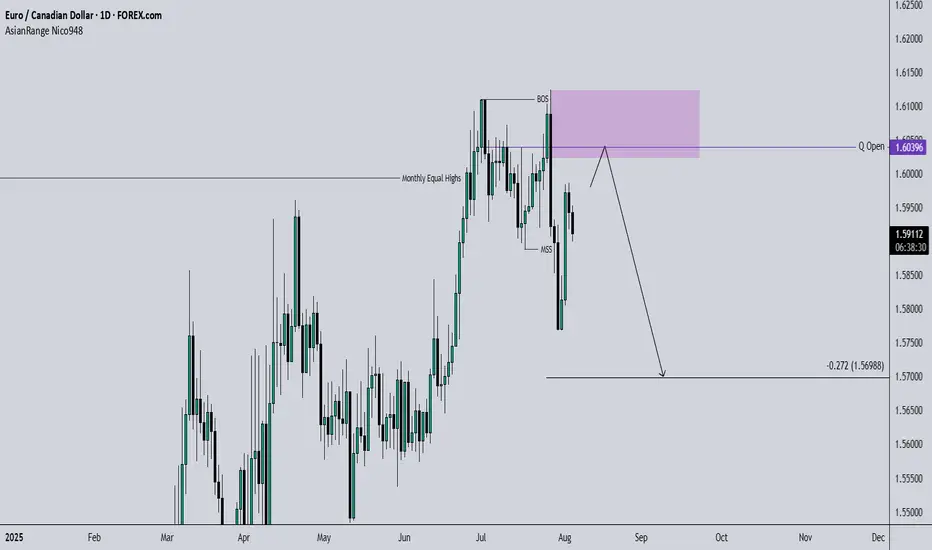
EURCAD SWING: SHORT-TERM SHORT OPPORTUNITYHi there,
Been a while... I was motivated resume sharing my trade ideas by a follower turned Pal (Shloydo). I say this to say - I'd be sharing my thoughts on price more often.
After running equal highs on the monthly chart, price created a MSS and I'd like to see a short-term bearish movement in price.
Once price trades into the highlighted key level (which aligns with the quarterly open price), I'd be looking for a setup to go short.
You could add this to the pairs on your radar.
Cheers,
Jabari
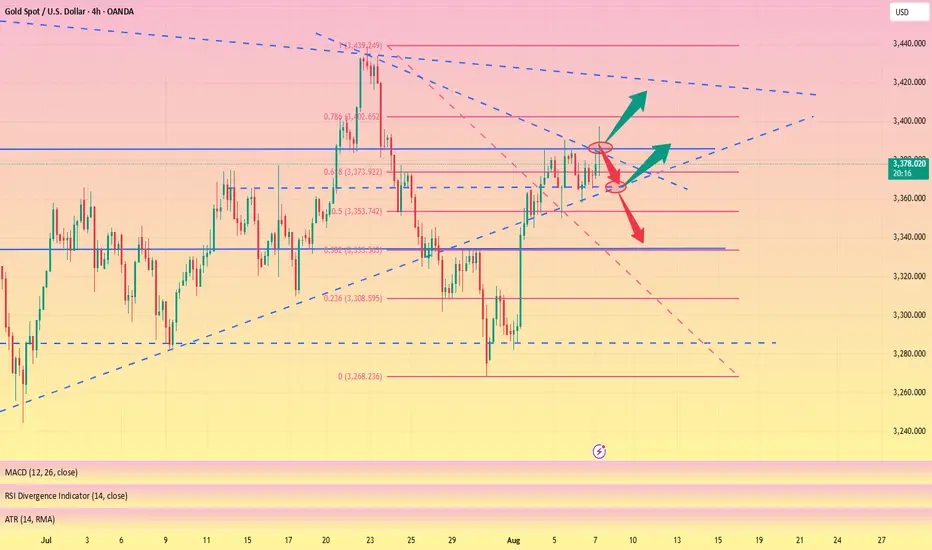
Next Stop 3420? Gold Bulls Push the LimitBecause the U.S. non-farm payroll report performed worse than expected, gold rebounded strongly last Friday and recovered half of its losses in one fell swoop. The bulls returned strongly. Today, after consolidating at a high level, gold continued to choose to break upward, reaching a high of around 3385.
There is no doubt that bullish forces still hold the upper hand. From a fundamental perspective, the Federal Reserve is currently facing greater pressure to cut interest rates; and it can also be clearly seen from the candlestick chart that a significant "W"-shaped double bottom structure has been constructed near 3268 and 3280, which has limited the gold's retracement space while also playing a key structural support role in the rise of gold. With the combined effects of news and technical factors, gold still has the potential to continue its upward trend. And I think there is still a great possibility that gold will test the 3400 mark again. Once gold stabilizes at 3400, it will definitely hit the 3420-3430 area.
As the center of gravity of gold gradually shifts upward, the lower support area also moves up. The current short-term support is obviously in the 3365-3355 area, while the relatively strong support is in the 3345-3335 area. According to the current pattern structure, the bulls may not allow gold to retreat to the 3345-3335 area. So in terms of short-term trading, we first consider the opportunity to enter long positions in the 3365-3355 area!
BTC intraday strategy analysis and operation layout#BTCUSD
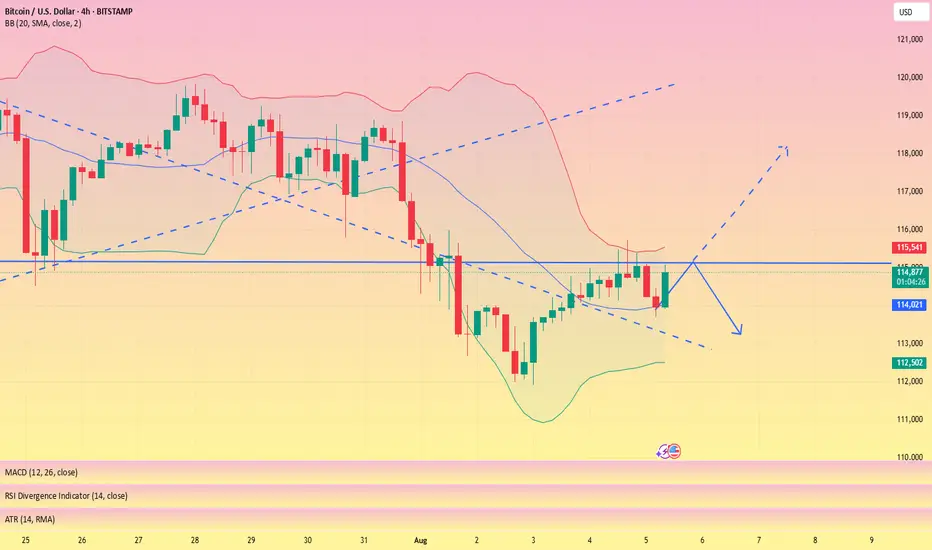
Currently, BTC rebounded again to test the upper resistance area of 115000-116000, indicating that buyers are still defending this structure, but it is still suppressed by the upper resistance. From a derivatives perspective, open interest has fallen by 0.91% over the past 24 hours, while options trading volume has also fallen by over 13%, indicating a decrease in speculative activity. Despite a 34.28% increase in 24-hour trading volume to $61.71 billion, the long-short ratio has fallen below 1.0, reflecting cautious market sentiment.
As long as BTC maintains above 114,000-113,000, the short-term structure remains neutral. If it fails to break through the overhead resistance and stabilize above 116,500, bulls may lose control of the lower trendline of the channel, triggering a renewed bearish push.
If BTC can successfully hold above 116,500, it could potentially return to 118,000 or even challenge the macro resistance level of 120,000. On the contrary, if BTC finds it difficult to break through the short-term resistance level, it will still return to the 114,000-113,000 area.
🚀 BUY 116,500-117,000
🚀 TP 118,000-119,000
Long trade
15min TF overview
🟩 Trade Type: Buyside Trade
Pair: ETHUSDT
Date: Sunday, 3rd August 2025
Time: 5:15 PM
Session: London–New York Overlap (LND Session PM)
Timeframe: 15 minutes
🔽 Entry Parameters
Entry Level: 3,455.23
Stop Loss: 3,436.73 (-0.54%)
Take Profit: 3,877.00 (+12.21%)
Risk-to-Reward (RR): 22:8
📉 Market Structure & Technicals
Trend Context:
Price reversed from a steep bearish trend and showed signs of a bullish momentum shift.
EMA/WMA Levels:
EMA (blue) and WMA (yellow) show a bullish crossover at the point of entry
Both MAs began to slope upward, confirming the trend shift.
Liquidity Observations:
Clean sweep of prior lows below 3,500 preceding entry.
Price traded back into a premium zone after reacting from a deep discount.
🧠 Narrative / Rationale
Set up Narrative:
ETH completed a strong downtrend and printed a bullish market structure shift (MSS) on the 15-minute TF. Entry was taken after price reclaimed the (POI) and confirmed a higher low.
Current Status: Trade in progress, profit levels partially hit.
TP aligns with the previous supply zone or relatively equal highs around 3,784.
Additional liquidity above 3,877–3,915 for extended targets if trade continues.

CHFJPY: Pullback Confirmed?! 🇨🇭🇯🇵
CHFJPY may pull back from a key daily support.
A formation of a bullish imbalance candle on an hourly time frame
with a bullish CHoCH provide a reliable confirmation.
Goal - 182.45
❤️Please, support my work with like, thank you!❤️
I am part of Trade Nation's Influencer program and receive a monthly fee for using their TradingView charts in my analysis.

EURUSD TRADING IDEA 08 05 25Here's another one:
Looking for a strong rejection in the discount zone before going long.

Technical indicators are bullish across the boardInfluenced by the NFP data, gold prices rose strongly, fully recovering last week's losses. The current gold market has broken the previous bull-bear equilibrium and remains in a strong upward trend. We are currently bullish but will not chase the rise. We will wait for gold to fall back and stabilize before trying to go long. Gold is currently in a sideways consolidation. If gold touches the upper short-term resistance of 3365-3370 again in the European session and encounters resistance and pressure, you can consider shorting with a light position and waiting for a pullback. If the gold price breaks up strongly, pay attention to the key suppression level above 3375-3385.
As the price of gold continues to rise, the support has moved up. Pay attention to the short-term support of 3345-3330 below. If it retreats and stabilizes, you can consider going long. Independent traders must strictly implement trading plans, and those who are not sure about the market must set stop-loss orders.
OANDA:XAUUSD

Don’t Blink — Gold Charging Toward 3400!Overnight, we entered a long trade at 3365 and successfully closed the trade by hitting TP: 3395, locking in nearly 300pips of profit. This was a very successful and accurate trading strategy.
Just now, gold became very crazy after rising, and plunged directly from around 3397 to around 3372. It was a very scary and crazy diving action. In fact, I am not worried about it. On the contrary, I am very happy that it provides me with another opportunity to enter the market and go long on gold. I've already entered a long position in gold again, as planned, in the 3375-3365 area.
Regarding the recent plunge in gold, I think it was intended to scare off the long positions that were somewhat loose in their intentions. Although gold has fallen sharply, it is still in a recent volatile upward structure. The volatile upward structure has not been destroyed in the short term, so I believe that gold will not have much room for retracement for the time being under the support of the bullish structure. On the contrary, I believe that after gold touches around 3397, even if it is weak, it will try to hit the 3400 mark, and it is even expected to continue the bullish trend to the 3420-3430 area.
There may be many friends in the market waiting for the opportunity to enter the long market at 3350 or even 3340, but what I want to say is that under the support of the gold bull structure, the downward space has been greatly limited. In the short term, gold may not go to such a low position at all, so relatively speaking, I prefer to go long on gold in the 3375-3365 area, and I have indeed done so!

GBPUSD SWING: SHORT OPPORTUNITYHi there,
Of all the USD pairs, I think GBPUSD is the weakest and I speculate lower prices.
At the very least, to hunt the equal lows the market created by not taking the previous low just before the monthly FVG. That action is suspect - it will induce buyers and drop more shorts on them.
Anyways, watch out for my next post.
Cheers,
Jabari

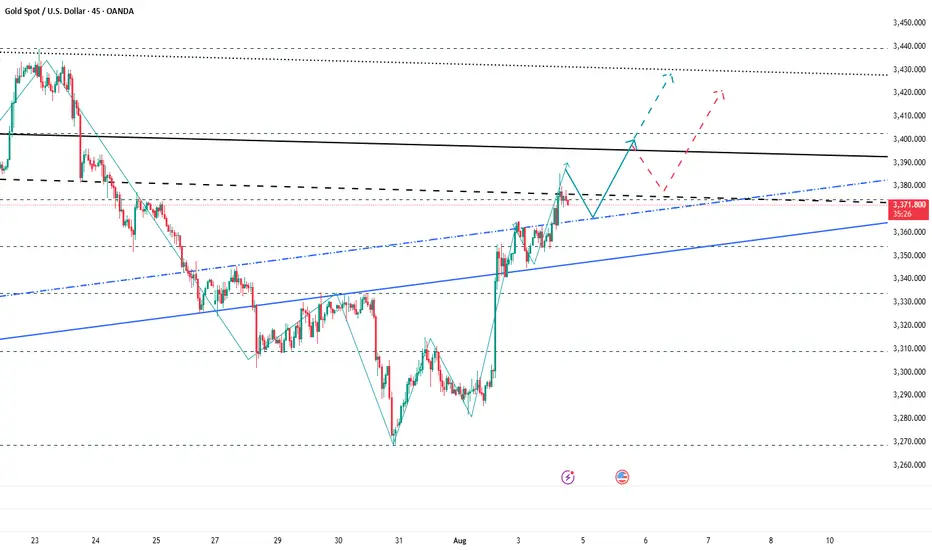
The triangle pattern is about to break through and hit 3400#XAUUSD
Although the price of gold was too high last night due to the rise in risk aversion, the upward momentum weakened significantly in the evening, and it fluctuated sideways at a high level. Gold is currently consolidating within a triangle pattern, with a short-term price increase reaching the triangle's boundary. A break above 3385 could lead to significant intraday gains. Meanwhile, the downside is defending short-term support at 3365. As long as this support level remains intact, the bullish trend remains intact. If the European session gives an opportunity to fall back to the 3375-3365 support area without breaking, you can consider going long and look at 3395-3405, and if it breaks, look at 3415.
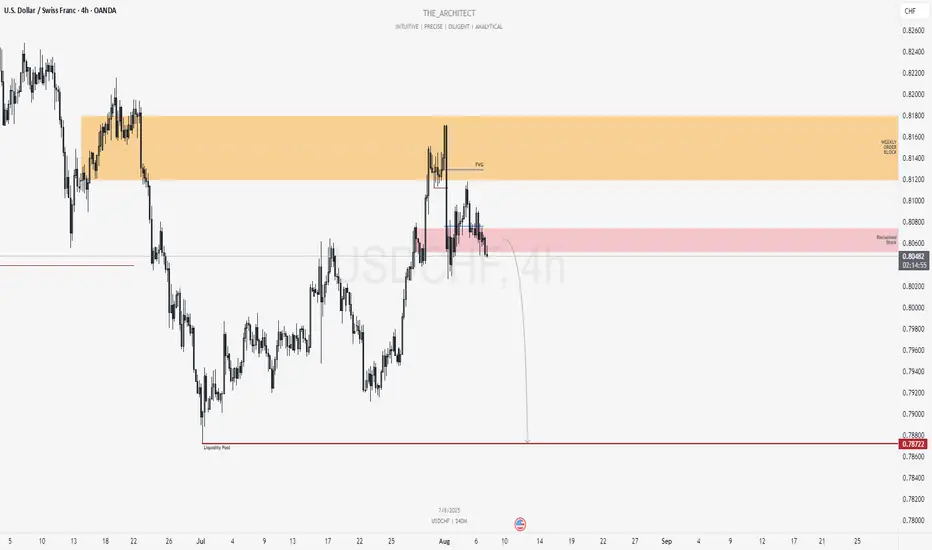
USDCHF: Bearish Continuation Setup From Reclaimed Supply ZoneGreetings Traders,
In today’s analysis of USDCHF, recent price action confirms the presence of bearish institutional order flow. This reinforces our directional bias to the downside, prompting us to focus on strategic selling opportunities.
Key Observations on H4:
Weekly Bearish Order Block: Price recently tapped into a weekly bearish order block, which triggered a decisive market structure shift to the downside. This confirms the order block's validity as a firm resistance zone.
Bearish Fair Value Gap (FVG): Following the market structure shift, price retraced into an H4 FVG. This zone acted as resistance, maintaining bearish momentum.
Reclaimed Mitigation Block: After breaking through a previous mitigation block, the area now functions as a reclaimed order block. We expect this to serve as a high-probability resistance zone moving forward.
Trading Plan:
Entry Strategy: Monitor lower timeframes (M15 and below) for confirmation entries within the reclaimed order block.
Target Objective: The current draw on liquidity is the discount-side liquidity pools, which aligns with our bearish bias.
As always, remain patient, wait for solid confirmations, and manage your risk with precision.
Kind regards,
The Architect 🏛️📉
XAU/USD 07 August 2025 Intraday AnalysisH4 Analysis:
-> Swing: Bullish.
-> Internal: Bullish.
You will note that price has targeted weak internal high on three separate occasions which has now formed a triple top, this is a bearish reversal pattern and proving this zone is a strong supply level. This is in-line with HTF bearish pullback phase.
Remainder of analysis and bias remains the same as analysis dated 23 April 2025.
Price has now printed a bearish CHoCH according to my analysis yesterday.
Price is now trading within an established internal range.
Intraday Expectation:
Price to trade down to either discount of internal 50% EQ, or H4 demand zone before targeting weak internal high priced at 3,500.200.
Note:
The Federal Reserve’s sustained dovish stance, coupled with ongoing geopolitical uncertainties, is likely to prolong heightened volatility in the gold market. Given this elevated risk environment, traders should exercise caution and recalibrate risk management strategies to navigate potential price fluctuations effectively.
Additionally, gold pricing remains sensitive to broader macroeconomic developments, including policy decisions under President Trump. Shifts in geopolitical strategy and economic directives could further amplify uncertainty, contributing to market repricing dynamics.
H4 Chart:
M15 Analysis:
-> Swing: Bullish.
-> Internal: Bullish.
H4 Timeframe - Price has failed to target weak internal high, therefore, it would not be unrealistic if price printed a bearish iBOS.
The remainder of my analysis shall remain the same as analysis dated 13 June 2025, apart from target price.
As per my analysis dated 22 May 2025 whereby I mentioned price can be seen to be reacting at discount of 50% EQ on H4 timeframe, therefore, it is a viable alternative that price could potentially print a bullish iBOS on M15 timeframe despite internal structure being bearish.
Price has printed a bullish iBOS followed by a bearish CHoCH, which indicates, but does not confirm, bearish pullback phase initiation. I will however continue to monitor, with respect to depth of pullback.
Intraday Expectation:
Price to continue bearish, react at either M15 supply zone, or discount of 50% internal EQ before targeting weak internal high priced at 3,451.375.
Note:
Gold remains highly volatile amid the Federal Reserve's continued dovish stance, persistent and escalating geopolitical uncertainties. Traders should implement robust risk management strategies and remain vigilant, as price swings may become more pronounced in this elevated volatility environment.
Additionally, President Trump’s recent tariff announcements are expected to further amplify market turbulence, potentially triggering sharp price fluctuations and whipsaws.
M15 Chart:

The bullish trend remains unchanged, seize the opportunityAfter today's opening, gold continued the bullish trend of yesterday. Judging from the daily line, gold has continued to rise, and it may only be a matter of time before it reaches a higher level. Judging from the 4H chart, the technical indicators are dead cross and shrinking, and the flexible indicators are repairing upward. The short-term middle track support is around 3372, and the upper side pays attention to the short-term pressure of 3395-3405. If the European session fails to effectively break through the short-term resistance, it will give the opportunity to test the 3380-3370 support again. If it is not broken, you can consider continuing to go long.
OANDA:XAUUSD

EURCHF: Intraday Bearish Move?! 🇪🇺🇨🇭
EURCHF reached a key horizontal resistance level.
I think that there is a high probability that the price
will retrace from that.
The closest intraday support is 0.93825,
it will be the goal for the sellers.
❤️Please, support my work with like, thank you!❤️
I am part of Trade Nation's Influencer program and receive a monthly fee for using their TradingView charts in my analysis.

Could Oil (WTI) Be Breaking Out of its Range?Oil (WTI) has moved back to the forefront of traders thinking this week after OPEC+’s weekend decision to raise September production by circa 550k barrels per day. They also put traders on notice that all options remain open regarding further production increases to replace another output layer, amounting to 1.66 million barrels per day that has been offline since 2023. A decision on what comes next is due to take place at a meeting scheduled for September 7th.
Perhaps unsurprisingly, this potential for extra production (supply) being unleashed into the market later in the year has led to some downside pressure for Oil this week. This is because it comes at a time of uncertainty surrounding Oil demand due to possible weaknesses in the global economy, created by President Trump’s tariff policies. Oil (WTI) prices have fallen 4.8% from opening levels on Monday to post a new 1 month low at 64.20 yesterday, a level that it currently holding (more on this in technical update below).
Looking forward, one of the challenges traders are facing for where Oil moves next is President Trump’s August 8th deadline for Russia to end the war with Ukraine or face fresh sanctions on its energy exports. President Trump has also suggested he would increase tariffs on countries buying Oil from Russia, including China, although right now India is his initial focal point in this regard and yesterday, he doubled tariffs on Indian goods (25% to 50%) due to the country’s purchases of Russian Oil. These new tariffs are due to start in 3 weeks’ time.
With so much uncertainty surrounding Oil prices, including reports of a possible meeting between President Trump and President Putin being scheduled at some stage next week, it could be useful to be prepared for a potential increase in Oil (WTI) price volatility.
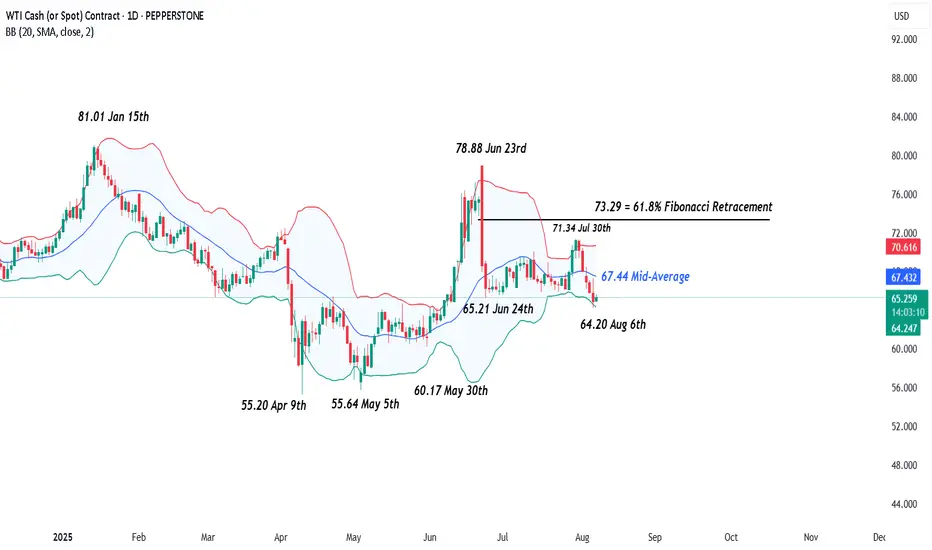
Technical Update: New Correction Lows Posted
Having seen the sharp sell-off in Oil between June 23rd and 24th 2025, a period of more balanced activity developed, as a reaction to over-extended downside conditions in price.
As the chart above shows, this resulted in a phase of sideways price activity between support marked by the 65.21 June 24th low, up to 71.34, which is equal to the July 30th failure high. However, price declines on Wednesday this week, have produced closes below 65.21, in the process of posting a new correction low at 64.20.
While communications between the US and Russia regarding the war in Ukraine are on-going, this type of break lower in the Oil price is no guarantee of future declines, so it could be helpful to assess what could be the potential support and resistance levels to focus on, just in case the outcome of these events lead to an increase in Oil price volatility.
Possible Next Support Levels:
As we have said above, the August 6th price weakness has seen a new correction low posted at 64.20, and this may now be viewed as the first support focus. Closes below 64.20 might then lead to a more extended decline in price.
Such moves would indicate the potential of further price weakness, with the next support possibly marked by the May 30th session low at 60.17, perhaps further towards 55.64 (May 5th low), if this level in turn gives way.
Potential Resistance Levels:
On the topside, within a period of price weakness, it can be the declining Bollinger mid-average that reflects the first possible resistance, and for Oil this currently stands at 67.44. Closing breaks above 67.44, if seen, could prompt further attempts to develop price strength to test higher resistance levels.
The first possible level would appear to be marked by 71.34, which is the July 30th session high. If this level was broken on a closing basis, it might then lead to tests of 73.29, which is equal to the 61.8% Fibonacci retracement of the June 23rd to June 24th sell-off.
The material provided here has not been prepared accordance with legal requirements designed to promote the independence of investment research and as such is considered to be a marketing communication. Whilst it is not subject to any prohibition on dealing ahead of the dissemination of investment research, we will not seek to take any advantage before providing it to our clients.
Pepperstone doesn’t represent that the material provided here is accurate, current or complete, and therefore shouldn’t be relied upon as such. The information, whether from a third party or not, isn’t to be considered as a recommendation; or an offer to buy or sell; or the solicitation of an offer to buy or sell any security, financial product or instrument; or to participate in any particular trading strategy. It does not take into account readers’ financial situation or investment objectives. We advise any readers of this content to seek their own advice. Without the approval of Pepperstone, reproduction or redistribution of this information isn’t permitted.
Bitcoin: Well defined consolation zoneI have had no real forecast for this market. The imbalances that have presented are formed in a consolidatory manor.
DXY is also in a strange place making it hard as well.
I am seeing sideways motion until we get a nice bullish close

USD/JPY(20250807)Today's AnalysisMarket News:
Federal Reserve Chairman Kashkari: A rate cut may be appropriate in the short term, and two rate cuts this year are reasonable. Trump: The new Fed governor will likely be temporary, and the appointment will be announced within 2-3 days.
Technical Analysis:
Today's Buy/Sell Levels:
147.40
Support and Resistance Levels:
148.30
147.96
147.74
147.05
146.83
146.49
Trading Strategy:
If the market breaks above 147.40, consider a buy entry, with the first target price being 147.74. If the market breaks below 147.05, consider a sell entry, with the first target price being 146.83

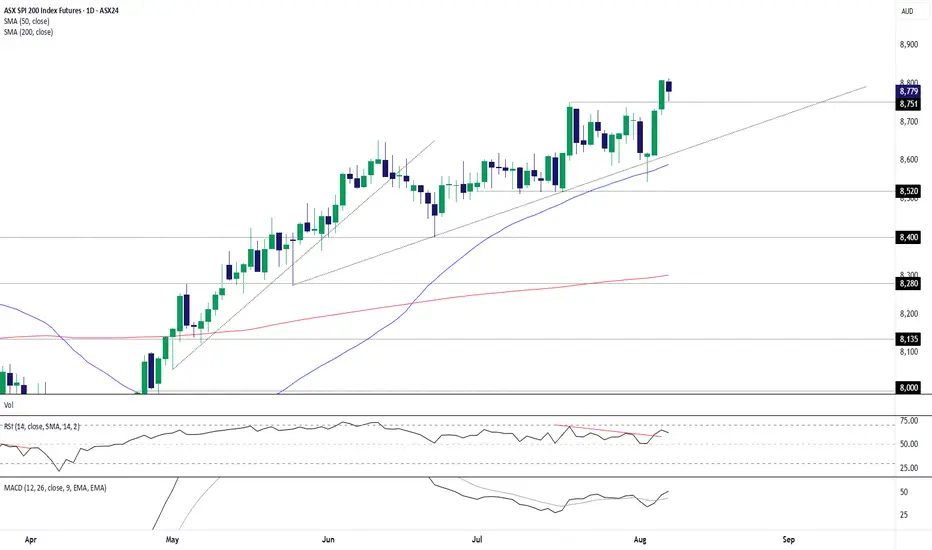
ASX 200 Futures: Back-Test Bounce Keeps Bulls in ControlASX 200 futures remain a buy-on-dips prospect, putting the contract on track to test the 9000 level soon.
Already sitting in an established uptrend, the latest leg higher coincided with a three-candle morning star pattern being completed on Tuesday, providing a bullish signal that goes some way to explaining the price taking out the former record high of 8751 a day later. The back-test and bounce from this level overnight suggest the path of least resistance remains higher. It also provides a level to build bullish setups around should we see a retracement to the level.
If we see a pullback towards 8751, longs could be established above with a stop below for protection. Wednesday’s high and 8900 are levels of note for those contemplating the trade, although 9000 comes across as a more appealing target.
Momentum indicators are also signalling growing topside pressure, with RSI (14) breaking its downtrend above 50 while MACD has crossed the signal line from below in positive territory. Combined, it provides a backdrop that favours a bullish bias.
Good luck!
DS
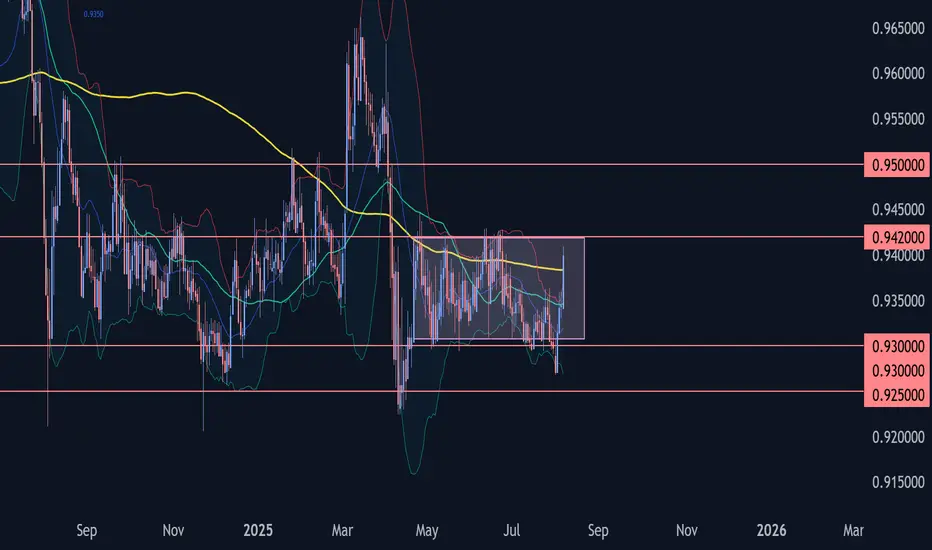
EURCHF Wave Analysis – 6 August 2025
- EURCHF rising inside sideways price range
- Likely to test resistance level 0.9420
EURCHF currency pair recently reversed from the support area between the strong support level of 0.9300 (lower border of the sideways price range from April) and the lower daily Bollinger Band.
The upward reversal from this support area created the clear daily Japanese candlesticks reversal pattern Bullish Engulfing – which started active impulse wave 3.
Given the strongly bearish Swiss franc sentiment seen today, EURCHF can be expected to rise to the next resistance level 0.9420 (upper border of the active sideways price range).
The market trend is still there, go long on the pullback#XAUUSD
Yesterday, gold experienced a V-shaped reversal: it was blocked at the 3382 line in the morning and then fluctuated and fell, then it fell to the support near 3349 and stabilized and rebounded, then rebounded to near 3390 in the evening and closed with a doji on the daily line. Judging from the overall trend, the bullish pattern has not changed.
Gold has limited room for decline in the short term, and a sharp drop is unlikely. Today's market tends to adjust and correct first before continuing to rise. The adjustment is only short-term, and is more to give everyone enough opportunities to get on board. The focus of the market below is 3375-3360, with the target looking at yesterday's high around 3390-3395. A break is expected to extend to the 3400-3420 area.
🚀 BUY 3375-3360
🚀 TP 3390-3395

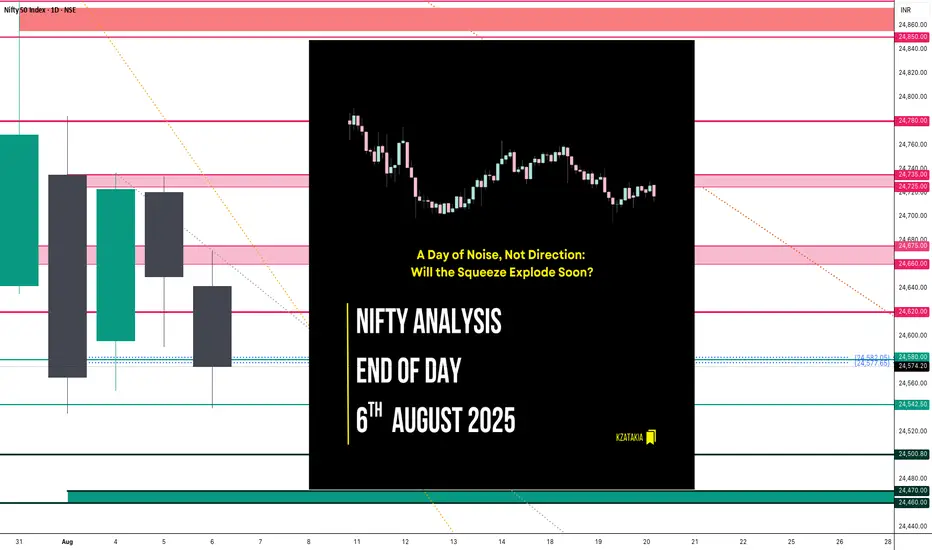
Nifty Analysis EOD – August 6, 2025 – Wednesday 🟢 Nifty Analysis EOD – August 6, 2025 – Wednesday 🔴
A Day of Noise, Not Direction: Will the Squeeze Explode Soon?
Nifty started flat with indecisive vibes, struggling initially around the 24,660 ~ 24,675 zone. After multiple failed attempts to hold, it slipped toward 24,580 — a cluster of PDL + S1 + Key Support — and broke below, forming the IB Low.
A quick bounce followed, but the index was firmly rejected near the VWAP + CPR + Fib zone, pushing it to a new day low at 24,544. Repeated intraday bounces faced selling pressure around 24,620, while 24,540 provided solid support — creating a tight intraday range.
Despite a perfect CPR setup for breakout, the market moved within just 132 points, the narrowest range in the last 4 sessions. A compression phase is building; breakout traders may soon get their moment.
📉 5 Min Time Frame Chart with Intraday Levels
🗣 Voice of the Intraday Option Buyer
Trend direction flipped multiple times — bearish to bullish and vice versa.
PDL + S1 zone experienced repeated fakeouts.
Low conviction moves on both sides frustrated momentum setups.
RBI event also not enough strong or trigger to guide directional bias.
Bank Nifty broke IB Low → IB High, closed strong; Nifty stayed muted.
Weekly expiry ahead — theta decay took control.
Many traders, including myself, anticipated a double inside bar breakout — but the trap continued.
Last 4 sessions (since Aug 1) have been painful for intraday option buyers — but it's all part of the game.
📉 Daily Time Frame Chart with Intraday Levels
🕯️ Daily Candle Breakdown
Open: 24,641.35
High: 24,671.40
Low: 24,539.20
Close: 24,574.20
Change: −75.35 (−0.31%)
Candle Structure:
Real Body: Red candle (67.15 pts)
Upper Wick: 30.05 pts
Lower Wick: 35.00 pts
Interpretation:
Attempted upside early on but couldn’t hold.
Both wicks show intraday tug-of-war; red close confirms sellers still in control.
Repeated rejection from 24,660–24,675 highlights weak bullish attempts.
Candle Type:
Bearish indecision candle — resembles an Inverted Hammer, indicating weakness despite dip buying attempts.
🔍 Nifty Short-Term View – As of August 6, 2025
Last 5 sessions show directional fatigue and failed bullish attempts above 24,700.
Two consecutive inside bars signal tight range and pending breakout.
Lower closes and long lower wicks = sellers dominate, but buyers defend dips.
Break below 24,535 = fresh selling.
Close above 24,660 = potential short-covering rally.
📌 Conclusion:
Nifty is coiling — a strong breakout may soon end this sideways-to-weak grind.
🛡 5 Min Intraday Chart
⚔️ Gladiator Strategy Update
ATR: 195.66
IB Range: 91.70 → Medium
Market Structure: Balanced
Trade Summary:
⏱ 10:35 AM – Short Entry → SL Hit
⏱ 12:15 PM – Long Entry → SL Hit
📏 Today's CPR Setup presenting...
Value Relationship: Inside Value → Breakout-Ready
Avg CPR Width: 37.54
Today’s CPR Width: 8.10 (🟠 21.58%)
CPR Type: Narrow → Perfect setup for big expansion
⚠️ Today’s setup didn’t deliver, but backtests show such narrow CPRs often explode in the following session.
📌 Support & Resistance Levels
🔼 Resistance Zones:
24,620
24,660 ~ 24,675
24,725 ~ 24,735
24,780 ~ 24,795
24,860 ~ 24,880
🔽 Support Zones:
24,542 ~ 24,535
24,500
24,470 ~ 24,460
🧠 Final Thoughts
The market is in consolidation mode with narrowing range. The double inside bar setup points to an imminent move — be prepared for a breakout trade soon. Don’t lose patience; big days often follow tough ones.
🛡 Disclaimer
This analysis is shared for educational purposes only. It is not trading advice. Please consult your financial advisor before making any trading decisions. Always trade with proper risk management.