EURUSD: Liquidity Grab & Bearish Outlook 🇪🇺🇺🇸
EURUSD broke and closed below a key daily horizontal
support cluster on a daily.
After a breakout, the broken structure turned into a strong resistance
and was retested.
I spotted a confirmed liquidity grab on an hourly time frame
and a consequent bearish imbalance candle.
Probabilities will be high that the price will drop
at least to 1.122
❤️Please, support my work with like, thank you!❤️
I am part of Trade Nation's Influencer program and receive a monthly fee for using their TradingView charts in my analysis.
Candlestick Analysis

Short trade
15min TF overview
🟥 Sellside Trade Log
📈 Pair: SOL/USDT
🏷️ Type: Intraday | Tokyo Session AM
🧠 Setup: Breakout
📅 Date: Sunday, 11th May 2025
🕝 Time: 2:30 AM
🔹 Entry Price: 174.933
🔹 Profit Target: 171.559
🔹 Stop Loss: 175.380
🔹 Risk-Reward Ratio: 7.55
Reasoning
Sellside trade taken after observing weak follow-through on previous bullish movement. Price action showed signs of exhaustion below a key resistance level, with a lower high forming on reduced volume. This indicated potential distribution. Entry was timed following a clean break of minor intraday support during the Tokyo AM session, aligning with short-term bearish structure and targeting nearby resting liquidity.

Long trade
15min TF
🟩 Buyside Trade Log
📈 Pair: SOL/USDT
🏷️ Type: Intraday | NY Session PM
🧠 Setup: Breakout
📅 Date: Saturday, 10th May 2025
🕔 Time: 5:00 PM
🔹 Entry Price: 172.541
🔹 Profit Target: 176.110 (+2.07%)
🔹 Stop Loss: 172.316 (-0.13%)
🔹 Risk-Reward Ratio: 15.86
Buyside trade undertaken after reinforced failed sellside delivery from the previous setup. This behaviour suggests strong underlying buyside pressure. Target liquidity is observed higher up, aligning with continuation expectations.

Coinbase’s $2.9B Deribit Gamble: A Power Play to Challenge.....Coinbase’s acquisition of crypto options giant Deribit for $2.9 billion signals a bold move to dominate derivatives markets. Despite mixed investor reactions, the deal positions Coinbase as a key player in institutional crypto trading.

$3,341 Surge: Fed’s Hawkish Hold Meets Trump’s Tariff TinderboxGold prices soared 2.61% to $3,325.39 as investors flocked to safe havens ahead of the Fed’s rate decision and Trump’s 100% tariffs on foreign films, igniting fears of a global trade war escalation

Euro’s 1.13 Lifeline: Can ECB Rate Cuts Outweigh Hawkish Holds? EUR/USD stabilised near 1.1275 amid mixed signals: the ECB’s rate-cut bets (driven by Eurozone inflation at 2.2%)* vs. the Fed’s "higher-for-longer" stance. Traders await U.S. jobless claims and German industrial data to break the stalemate.

GBPUSD - Pound’s Resilience TestedThe BoE cut rates by 25 bps to 4.25% with a rare split vote (7-2), while the Fed held rates steady at 4.50%, amplifying policy divergence. GBP/USD fluctuated between 1.32121 and 1.34028 closing at 1.33034 as traders weighed UK GDP upgrades against Fed inflation warnings.

Dow Jones - Fed’s ‘No-Cut’ Gamble BackfiresDespite Disney’s heroics, the Dow closed the week at $41,376 (-0.20%), weighed by Fed Chair Powell’s warning that tariffs could spike inflation and unemployment. Barclays’ “mild recession” forecast added pressure, while utilities (XLU +6.9% YTD) emerged as safe havens.

Nasdaq -Bitcoin’s $104K Frenzy Steals Nasdaq’s ThunderAs Bitcoin surged to $104,350 (up 9.5% weekly), retail traders pivoted to crypto, leaving Nasdaq’s momentum muted despite Lyft’s 21% pop on buyback news .
Going forward, I will be interested to see if Nasdaq is lagging behind Bitcoin and we can see bullish price action up into premium PD arrays.

$6 Trillion Rollercoaster: Trade War Jitters Clash With FedThe index swung wildly as Trump’s 145% China tariffs and hints of an 80% reduction collided with Fed Chair Powell’s cautious stance on rates. Despite a midweek rally, the S&P 500 ( NYSE:ES ) closed the week down 0.46% at $5,684 reflecting investor paralysis ahead of U.S.- China trade talks.

Dollar Plunge To 97.921: Trump’s Tariff Tsunami Erodes DollarDollar Index fell to 97.921, its lowest since April 2025, as Trump’s aggressive tariffs on critical minerals and China trade retaliation spooked investors.
Analysts warn the dollar’s status as a reserve currency is under threat, with foreign holdings of U.S. assets declining sharply.
However in the short-term, dollar might see appreciation up into premium PD arrays, namely the weekly fair value gap outlined.

Technical Collapse: ‘Strong Sell’ Signal Flashes Technical ratings turned Strong Sell as open interest dropped to 1.80M contracts this week
signalling bearish momentum.
Hedge funds unwound basis trades, triggering forced selling and margin calls.

US10Y - Yield Volatility Amid Fed Policy StanceThe 10-year Treasury yield fluctuated between 4.30% and 4.39% this week, closing at 4.382% on May 9.
The Federal Reserve maintained benchmark rates at 4.50%, dismissing pressure from the Trump administration for cuts. Chair Powell emphasised persistent inflationary risks and labor market stability, reinforcing a cautious "higher-for-longer" stance.
4.400% intermediate term buyside liquidity is a point of interest going forward.

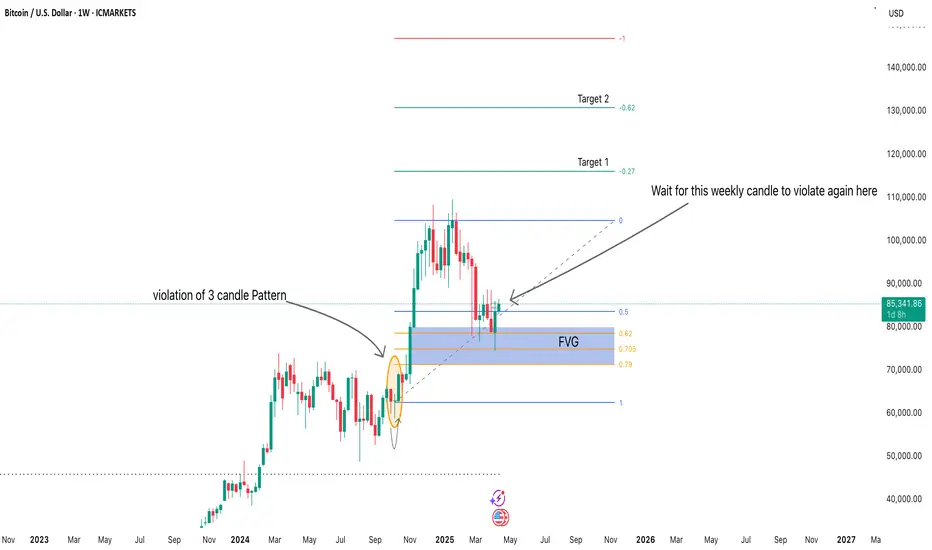
Bitcoin Weekly Outlook (April 2025)Price has respected the Fair Value Gap (FVG) and is showing signs of potential bullish continuation.
Waiting for a weekly candle body close above the highlighted structure to confirm continuation.
Targets set at key Fibonacci extension levels.
Patience is key — confirmation before entry to minimize risk.
"Let the market show its hand. No confirmation, no trade." 🚀
Long trade
15min TF overview
1min TF entry
🟩 Buyside Trade Log
📅 Date: Saturday, 10th May 2025
🕔 Time: 5:00 AM (LDN Session AM)
🔹 Entry Price: 2367.28
🔹 Profit Target: 2490.46 (+5.20%)
🔹 Stop Loss: 2363.65 (-0.15%)
🔹 Risk-Reward Ratio: 33.83
Reason: Price reached a pivotal support level indicative of a buyside trade. Based on the narrative of supply and demand
1min TF

EURUSD Buy to High and reversal SellsPrice is currently close to a BB POI. When price tags our POI, the buy activates which we believe to take price to the previous high of 1.1570. A failure to break the previous high gives us an opportunity to sell from the OB POI via Quasimodo reversals at 1.14863.

NEARUSDT Retracement and BuysIf price fails to break the High, then a retracement is sure which will push price to our entries. Let's explain. We have two POI the first from the bottom is a Breaker Block (BB) and the second is a Order block (OB).
Now, if the price fails to push below the POI that begins at 2.327, then the BB will serve as an entry for our buy with SL placed below the POI.
However, If price invalidates the BB, then there will be a further push to the last POI beginning at 2.151 where our OB will serve as the entry for another buy. However, I am optimistic about the BB serving as the entry after the pushback.
NB: This is just an analysis and in now way a prediction of how the market will move.

USDJPY Set to Rise as Support Holds and Dollar Finds TailwindsUSDJPY looks poised for further upside following a period of consolidation and a successful retest of strong support around the 140.50 level. The weekly chart reveals a clear triple bottom pattern, reinforcing the strength of this support zone and suggesting renewed bullish momentum.
The US Dollar is starting to regain strength after a period of weakness, supported by improving U.S. economic data, sticky inflation, and a less dovish stance from the Federal Reserve. In contrast, Japan is unlikely to change its ultra-loose monetary policy in the near term, keeping rate differentials wide and favoring a stronger Dollar.
With the Bank of Japan expected to hold rates steady for the foreseeable future, capital is likely to continue flowing out of the yen. Carry trade flows remain intact, adding to the upward pressure on USDJPY.
Momentum indicators are turning higher, and price action is forming a steady base for another leg up. The market could target the 150 zone in the coming weeks, where the 50-week moving average may act as initial resistance.
As long as 140.50 holds, dips could offer attractive buying opportunities. A sustained move above 145.00 could trigger fresh bullish momentum and accelerate gains.

NZDCHF SHORtsEntry at Daily AOi
Weekly Rejection At AOi
Previous Weekly Structure Point
Daily Rejection At AOi
Previous Structure point Daily
Around Psychological Level 0.50000
H4 Candlestick rejection
Levels 6.98
Entry 95%
REMEMBER : Trading is a Game Of Probability
: Manage Your Risk
: Be Patient
: Every Moment Is Unique
: Rinse, Wash, Repeat!
: Christ is King.

Nifty Analysis EOD - May 9, 2025 - Thursday🟢 Nifty Analysis EOD - May 9, 2025 - Thursday 🔴
🧨 Gap Down, Rebound & a Triangle Trap – Bulls Show Spine Amid Chaos
Opening Mood:
Overnight panic from geopolitical tensions shook the market’s foundation—but the bulls weren’t ready to surrender just yet.
🧭 Nifty Summary:
Gift Nifty had plunged to 23,760 late last night on news of escalating conflict—marking a 445-point fall. However, as the night wore on without further developments, markets began to stabilize. At the open, Nifty registered a gap-down of 338 points at 23,935, but the first 5-minute candle showed strength, racing to fill the gap.
After a brief attempt to break the Previous Day’s Low (PDL), Nifty failed to hold below and slid back to its origin. The rest of the day was a tug-of-war with sharp two-sided moves, eventually forming a descending triangle pattern—a sign of compression and directional indecision.
🕯️ Daily Candle Breakdown:
Today’s Candle: Wide-range doji with upper wick—signs of volatility and hesitation
Close: 24,008 (▲ Positive)
Key Observations:
✅ Above 24,000 Psychological Mark
✅ Held Support Zone: 24,000 ~ 23,950
✅ Above Recent Swing Low: 23,847.85
❌ Slightly Below Previous Week’s Low: 24,054.05
❌ Below Previous Swing Close: 24,036
What It Implies:
Buyers are stepping in at key supports, but conviction is still lacking. The market remains reactive to global cues, especially Mission Sindoor ones.
⚔️ Gladiator Strategy Update
Strategy Parameters:
ATR: 291.20
IB Range: 204.00 (Large IB)
Market Structure: ImBalanced
Trade Highlights:
Total Trades: 1
✅ Long Trigger @ 10:10 AM → Target 1:1.5 Achieved
📈 Intraday Walk (5-Min View):
Strong gap-fill in the first candle signaled bullish intent
Failed breakdown below PDL trapped weak shorts
Descending triangle emerged as price compressed
Market closed near resistance but above key support—neutral to slightly bullish tone
🔮 What’s Next?
This market is walking a tightrope between sentiment and structure. On one hand, technical levels are being respected—but on the other, global uncertainty is keeping participants hesitant.
“This is a news-driven market. Delivery trades are best avoided. Stay nimble, trade the levels, and protect capital. Remember, sometimes staying out is a profitable strategy.”
🔍 Support & Resistance Levels
🔼 Resistance Zones:
24,036 ~ 24,044
24,150 ~ 24,165
24,188 ~ 24,240
24,290
24,330 ~ 24,365
24,400 ~ 24,420
🔽 Support Zones:
24,000 ~ 23,950
23,935
23,890 ~ 23,870
23,848
23,820
23,710 ~ 23,660
📌 Final Thoughts:
“Structure is key. When levels work, respect them. When they break, adapt.”
In a market full of noise, discipline and level-based action is your edge.
✏️ Disclaimer
This is just my personal viewpoint. Always consult your financial advisor before taking any action.

#BTCUSDT. Is ready for a retest of 103.98 and higher.Structurally, over the next few days it looks like an attempt by the First Cryptocurrency to adjust its recent growth with a small correction into the zone of 92000-90200 - near these levels one can look for setups for buying.
Near these zones there may be an attempt to buy back at 103.98.
It looks promising, we are watching.

Ethereum Future: Limited Upside Ahead?Ethereum price dropped roughly 25% since April 2 due to an overall market crash following Trump’s tariffs implementation.
Compared to the almost 40% drop back in February after the first tariff announcement, this time the correction wasn’t as harsh or brutal.
So what can we expect next from Ethereum in the coming weeks?
The main hope for ETH price remains the upcoming Pectra upgrade.
Historically, major Ethereum upgrades have acted as bullish catalysts — for example, ETH roughly doubled in price ahead of both the Merge and the Shanghai upgrade.
If history rhymes, we could see a similar pre-upgrade pump this time too.
However, even if that rally materializes, I expect it to be limited to the $3,000–$3,400 range. The market lacks the kind of momentum or macro tailwinds needed to push ETH beyond 4k in this cycle — unless there’s a major shift in sentiment.
Overall, I remain cautious. The broader crypto market seems to be rolling over, and Ethereum hasn't even reclaimed its ATH.
With the next bear cycle approaching, long-term bullish targets might need to be revised — at least for now.
Short-term bounce possible thanks to Pectra hype, but don’t expect miracles. ETH likely capped below 3.4k unless something big changes.

Bitcoin’s Make-or-Break Moment: Eyes on $70KBitcoin price almost reached the $74k support area, which is critical for the bull run continuation.
This zone has acted as a strong resistance in the past, and a clean bounce from here could signal renewed strength and confidence in the market.
However, if this support fails to hold and BTC closes the weekly candle below the $70k level, it would likely mark the end of the current bull phase and signal the beginning of a distribution phase or even the early stages of a new bear market.
That doesn’t necessarily mean Bitcoin will crash straight to $50k — corrections are rarely that linear. But it would drastically reduce the chances of seeing new all-time highs in this cycle.
The next rally, if it happens, would probably be more muted and shorter-lived.
Hopefully BTC will manage to avoid this scenario and hold above the support area.
On the positive side, if BTC holds above $70k and we see strong demand stepping in, it could set the stage for a healthy bounce and continuation of the uptrend.
Still I expect that BTC will test 70k level and if we see strong buying pressure on that level we can expect some recovery.
