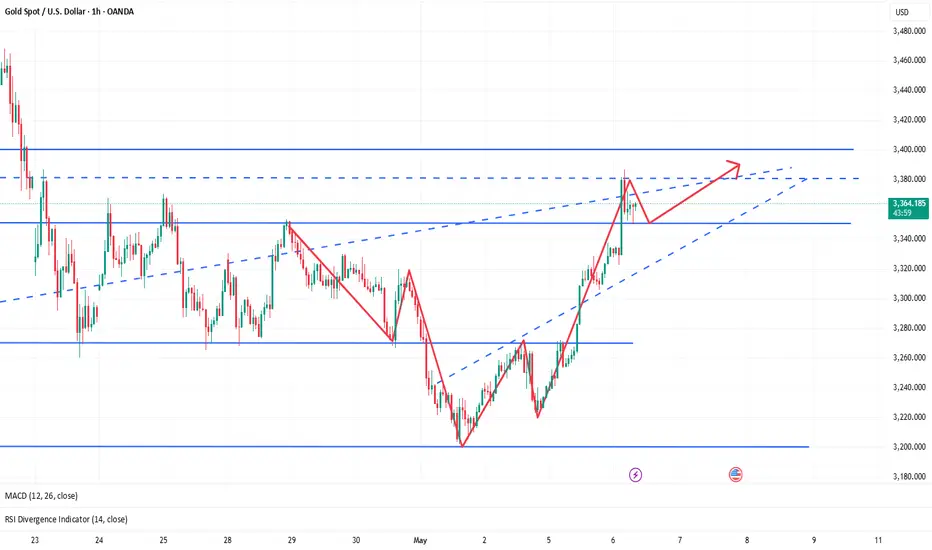
Gold fluctuates in a narrow range ahead of the Fed rate🗞News side:
1. The situation between India and Pakistan escalates
2. China is willing to engage with the US, and the situation has eased
📈Technical aspects:
The price of gold fell sharply after the market opened today, once falling to around 3360. Currently, gold is oscillating slightly between 3375-3390. The market has no clear trading direction for the time being. Gold is not expected to change much before the Federal Reserve interest rate is announced. Today, gold prices have continuously tested the lower support 3370-3360, and the upper short-term resistance is focused on the 3390-3400 line. We maintain shock treatment for short-term trading. The focus will be on today’s Fed interest rate issues and talks between China and the United States.
If you agree with this view, or have a better idea, please leave a message in the comment area. I look forward to hearing different voices.
TVC:GOLD FOREXCOM:XAUUSD FXOPEN:XAUUSD FX:XAUUSD OANDA:XAUUSD
Candlestick Analysis

Simple Break of Structure BoS Trading Strategy Explained
One of the best and reliable strategies to trade break of structure BoS is to apply multiple time frame analysis.
In this article, I will teach you my break of structure gold forex trading strategy. You will get a complete step-by-step guide with examples.
Let's start with a quick theory and let me explain to you what is break of structure BoS in Smart Money Concept SMC trading.
In a bullish trend, break of structure BoS is an important event that signifies a continuation of an uptrend. It is based on a violation and a candle close above the level of the last higher high (HH).
After a breakout, the broken level becomes the first strong support for trend-following buying.
Check multiple examples of confirmed breaks of structure BoS on GBPNZD forex pair on a weekly time frame.
In a downtrend, Break of Structure BoS means a bearish trend continuation . Break of Structure is considered to be confirmed when a candle closes below the level of the last lower low (LL).
The broken key level becomes the closest strong support for buying.
That's the example of a healthy downtrend on USDJPY forex pair on a daily. Each break of structure BoS pushed the prices lower, providing a strong signal to sell.
What newbie traders do incorrectly, they trade break of structure without a confirmation strategy, and it leads to substantial losses.
Though GBPCHF is trading in a bullish trend and though each BoS provided a trend-following signal. The price retraced significantly lower below the broken structure before the growth resumed.
When the price retests a broken structure after BoS in a bullish trend, start lower time frame analysis.
If you identified a break of structure on a daily, analyze 4h/1h time frames.
If on a 4H, then 30/15 minutes.
After the price sets a new higher high with BoS in uptrend, it usually starts trading in a minor bearish trend on lower time frames.
With our strategy, your signal to buy will be a retest of a broken structure and a consequent bullish Change of Character CHoCH . That will provide an accurate bullish signal.
In a bearish trend, analyze the lower time frames after a retest of a broken structure. Your signal to sell will be a bearish Change of Character CHoCH.
Look at a price action on EURCHF on a daily.
We see a strong bullish trend and a confirmed Break of Structure BoS.
According to the rules of our trading strategy, we start analyzing 4h/1h time frames after a retest of a broken level of the last Higher High.
Our signal to buy is an intraday bullish CHoCH. We open a long trade after that with the stop loss below the intraday lows and take profit being a current high.
That's how simple this strategy is.
Multiple time frame analysis provides the extra level of security.
Strong lower time frame confirmation substantially increases the win ratio of a trading setup.
❤️Please, support my work with like, thank you!❤️
I am part of Trade Nation's Influencer program and receive a monthly fee for using their TradingView charts in my analysis.

BITCOIN WILL GOING UPBTC bullish strong 📈💪
Candle break weakly Target 156k 🚨🚨🚨
target quarter 4 last year

Very Strong performance by Nifty to close in Positive todayDespite the fear of escalation of tensions at Indo-Pak border and Indian carrying out Operation Sindoor Nifty closed in Green today. This signifies the strength of Indian market, India as an Economy and India as a country. Very few would have imagined that Indian markets will close in Green today when the market begun early morning. The situation still remains fluid/dynamic and explosive. so still investors should keep stop losses and trailing stop losses in place.
Supports for Nifty remain at: 24315 (Strong Mother line for hourly chart), 24202, 24083, 23944 and 23754 (Strong Father Line support). Below 23754 Bears can take control of the market and drag it towards 23K.
Resistances For Nifty remain at: 24430, 24528, 24616 and 24863. Closing above 24863 can empower Bulls in a big way to Pull Index towards 25K+ levels.
Disclaimer: The above information is provided for educational purpose, analysis and paper trading only. Please don't treat this as a buy or sell recommendation for the stock or index. The Techno-Funda analysis is based on data that is more than 3 months old. Supports and Resistances are determined by historic past peaks and Valley in the chart. Many other indicators and patterns like EMA, RSI, MACD, Volumes, Fibonacci, parallel channel etc. use historic data which is 3 months or older cyclical points. There is no guarantee they will work in future as markets are highly volatile and swings in prices are also due to macro and micro factors based on actions taken by the company as well as region and global events. Equity investment is subject to risks. I or my clients or family members might have positions in the stocks that we mention in our educational posts. We will not be responsible for any Profit or loss that may occur due to any financial decision taken based on any data provided in this message. Do consult your investment advisor before taking any financial decisions. Stop losses should be an important part of any investment in equity.
The Long, Flat Road AheadWith the Federal Reserve’s rate decision in focus, I wanted to revise a previous idea that called for 6% on the 10 year T-bill, and provide a clearer read on what I’m seeing as the larger trend, which could provide important clues for the future of everything from monetary policy, to mortgage rates, and stocks.
Starting with the 500R chart, I think we are seeing a clear flat correction form, with the current segment of the trend being Wave C of (B). In a flat correction, the endpoint of (B) should reach at least 100% of (A). It can also extend further or, in less common cases, only reach 90% of (A), however for the purposes of this idea I will assume the yield will retrace to the 100% level, which is just above 5%.
If this were to play out, it would suggest incoming pressure to financial markets that will eventually subside, likely later in the year. Something else to look for is that if this (B) wave were to fit a Zig Zag structure, that would cause waves (A) and (B) to be of the same pattern, so we should anticipate an alternate pattern in (C), such as a flat, diagonal, or triangle.
The question on everybody's mind at the moment is if/when the next interest rate cut is coming. For today's announcement, I expect there to be no surprises, which can also be supported by short term technicals.
Looking at the 100R chart (right) and Daily chart (left) at the same time provides useful context. The yield bounced off the 0.618 retracement of the 4/4 - 4/11 rise (labeled as 0.382 on the fib extension) and should have upward momentum. On the contrary, the Daily chart shows resistance at what appears to be a more well-defined lower high, with imbalances below. On the 100R chart, I also have a box drawn to show the extremities of the 500R bar. I expect the yield to move higher without creating a new 500R bar - which means the max low would be just below 4.10%.
A retracement to this level would lead to the yield hitting the middle line of the lower imbalance, which should be a key liquidity zone. From there, a move to the 1.618 extension would take the yield to the targeted 5%.
Something else I look for when detecting reversals is divergence on the Fisher Transform oscillator. I have it on both charts, which suggests a near-term move to the downside. Divergences are even more reliable on the Range charts, so a slightly lower low on the yield occurring while Fisher makes a higher low would signal that yields are about to rise higher.
Assuming we see similar action play out, this would support my fundamental prediction that FOMC will temporarily provide relief to the markets - possibly from there being no surprises or dovish comments on rate cuts. I would, however, expect this to be short lived. Since I am already calling for stocks to be near a major reversal level, I expect a sharp rise in bond yields to correspond with a more powerful sell off of stocks than what we saw in February-April. More likely catalysts could be hot CPI and/or failure of US/China trade talks.
Since there isn't much left to comment about on the technical side of things, I'll leave it at that. I ultimately expect the yield to start moving to 5%, so if it starts moving higher from here (4.36% currently), it would invalidate the idea that this will make one more push lower this week. We'll see what happens. Thank you for reading and let me know what you think!

Japanese Yen Pairs: A Short Guide on Relative StrengthIndicators are a popular choice among many traders, and they certainly have their place in my own toolkit. But sometimes it is best to simply look the price to gauge strength. And doing so, it can help us scenario plan for future events. After I take a quick look at Japanese yen pairs, I wrap up on my preferred setup.
Matt Simpson, Market Analyst at Forex.com and City Index

EUR/AUD: Decision Time at the 50DMAHow EUR/AUD interacts with the 50DMA in the near-term may offer a useful steer on directional risks over the medium-term. For now, it’s bounced off the level, finding buyers after the initial disappointment from China’s latest support measures. Still, the long topside wicks on the past two daily candles, coupled with increasingly bearish momentum, suggest downside risks are building.
A break and close beneath the 50DMA would generate a setup where shorts could be established with a stop above for protection. 1.7113 or 1.7050 screen as targets. Alternatively, if the pair can hold the 50DMA, longs could be established with a stop beneath. 1.7700, 1.7865 or 1.8016 offer targets depending on the desired risk-reward.
Good luck!
DS

Gold is rising strongly. When can the bull market stop?🗞News side:
1. Trump announces renegotiation of USMCA
2. Pay attention to the Fed interest rate
📈Technical aspects:
Looking at the daily chart, gold prices are breaking through important resistance levels and forming a strong upward trend. The price is currently trading around 3410, with strong suppression at 3420-3430 above the short-term. If the gold price encounters resistance and pressure, gold may once again experience a correction. Therefore, when the gold price touches the 325-3435 line, you can try to place a short position. In terms of operation, after two consecutive positive days on the technical front, the bulls will continue further. The current short-term support has moved up to the 3386 line. 3386 is the early resistance that turned into support after breaking through. This will be an important support level. At the same time, the 3270-3260 line support below is still strong. Continue to look at the 3430-3450 line. Therefore, in terms of operation, we mainly do long positions on callbacks and supplementary short positions on rebounds.
If you agree with this view, or have a better idea, please leave a message in the comment area. I look forward to hearing different voices.
OANDA:XAUUSD FX:XAUUSD FXOPEN:XAUUSD FOREXCOM:XAUUSD TVC:GOLD

GbpAud now the “buyers” are within!Good day traders, we back with GBPAUD but before I go into it. Last week I took loss because I was buying GBPAUD but I lately found out I was way too early and my narrative has not changed at all.
1D- Daily TF we have a bearish structure and we know that once price shifts structure we want price to retest Atleast till the 0.705 of the OTE fib level to later continue to the Sellside liquidity.
4H- On this respective TF we are also in a bearish structure but I believe not for long because on the lower TF the shift higher has materialised, giving confirmation that we can start positioning ourselves for the up movement.
1H- ICT has a entry model(F.PFVG), on the hourly we saw prices giving back all of yesterday’s gains till it reach that level of first presented FVG and that’s what we gonna use as the level of interest.

Short trade
15min TF Structure
📘 Trade Journal Entry — BTCUSD (Sell Side)
🗓 Date: Tuesday, 6th May 2025
⏰ Time: 3:35 PM
📍 Session: New York PM
🪙 Pair: BTC/USD
📉 Direction: Short (Sell Side)
🔹 Entry Details:
Entry Price: 95,116.74
Take Profit: 93,856.07 (−1.33%)
Stop Loss: 95,230.19 (+0.12%)
Risk-Reward Ratio: 11.11
🔹 Trade Context: Based on the narrative of supply and demand...and liquidity
🎯 Targeted the opening day high-low region, anticipating liquidity grab
Executed during the New York PM session, often a time for reversals...?
#5min TF entry
#NYSessionPM
#SellsideSetup
#OpeningRangeTarget
#LiquiditySweep

$EURGBP Interesting technicalsOANDA:EURGBP Interesting technical idea on this cross. Rejecting from a previous weekly level with a pinbar on the daily. Nice intraday level at .382 fib with a good target. Will need managed on an intraday timeframe.

USDJPY LONGMarket structure bullish on HTFs DH
Entry at both daily and weekly AOi
Weekly Rejection at AOi
Daily Rejection at AOi
Previous Structure point Daily
Around Psychological Level 144.000
H4 EMA retest
H4 Candlestick rejection
Levels 5.63
Entry 90%
REMEMBER : Trading is a Game Of Probability
: Manage Your Risk
: Be Patient
: Every Moment Is Unique
: Rinse, Wash, Repeat!
: Christ is King.

May 6, 2025 - EURUSD Sell📉 Bias: Bearish | Risk: 0.5% (+0.5% potential add-on) | 🎯 Targets: 1:3 (75% off), final TP > 1:8
🧠 Reasoning:
Price reacted from Daily Orderblock, broke structure on 15m ⛓️.
Refined entry from 15m OB → 5m OB for more precision on the tap entry🎯.
2x Asia lows below = high-probability targets 🔻.
Looking to add 0.5% if 1m BOS + retracement OB confirm.
⚠️ Note:
There’s unmitigated Asia High & 15m OB above, but too far to affect today’s bearish idea.

Long positions in the US market remain the main trend🗞News side:
1. The “demand shock” of the Trump administration’s tariffs on the global economy
2. The United States rejected Japan’s request for a comprehensive exemption from 10% reciprocal tariffs and country-specific tariffs in recent negotiations.
3. The conflict between Israel and the Houthis
📈Technical aspects:
The 4H golden moving average spreads upward, the MACD golden cross opens upward, and the 4H overall bullish trend is seen. Gold price encountered resistance at 3386 in the morning of the Asian session. This point can be used as a reference in suppressing the market outlook. If this resistance is effectively broken through, bulls are expected to continue to work towards the 3400 first-line mark above. The daily chart is positive, and the K-line combination is relatively strong. The US market is expected to break through 3386 and reach the space above 3400; the SMA10 moving average of 3370 continues to be bullish as the primary support, with strong resistance to 3400. Even if the price of gold in the US market rises and falls, the middle track of the Bollinger Bands still has good support. On the whole, we mainly focus on long positions in short-term trading. We can consider the 3370-3380 layout to go long, with the target looking towards 3400-3410 above.
If you agree with this view, or have a better idea, please leave a message in the comment area. I look forward to hearing different voices.
TVC:GOLD FOREXCOM:XAUUSD FXOPEN:XAUUSD FX:XAUUSD OANDA:XAUUSD

Nifty Analysis EOD - May 6, 2025 - Tuesday🟢Nifty Analysis EOD - May 6, 2025 - Tuesday 🔴
📌 Opening Mood:
A deceptive start near resistance—buyers had a moment, but bears owned the day.
📊 Nifty Summary:
Nifty opened at 24,509, precisely at the psychological and structural resistance zone. The first candle itself (O=H) reflected immediate selling pressure, and the index slid quickly, dropping 140+ points in the first hour. It tested the support zone around 24,330 ~ 24,365, which had earlier acted as resistance—a polarity zone now holding as support.
Despite multiple attempts, Nifty couldn’t break back above the upper consolidation band (around 24,400–24,410). For most of the day, it traded in a tight 40–50 point range and eventually settled near the lower end of that range at 24,379.60, while intraday close came in at 24,331.80.
⏱ Intraday Walk (5-min Time Frame Highlights):
🔻 First hour: Quick 140-point drop straight into support
🔄 10:30 AM–2:50 PM: Multiple bounce-back attempts failed at 24,400 and 24350
🧊 3:00 PM–3:30 PM: High volatility zone, test both sides of the range and the day ends with a new low.
🔒 Close: Near day’s low—weak handoff for next session
🧭 Daily Candle Breakdown
📌 Today’s Candle Type: Strong Bearish Candle
📖 Know How of Candle Type:
This candle type signals strong seller dominance. The real body is wide with almost no upper wick, implying bears controlled the day from start to end. Appears frequently after a failed attempt to break resistance.
📌 Today’s OHLC:
Open: 24,500.75
High: 24,509.65
Low: 24,331.80
Close: 24,379.60
Change: –81.55 (–0.33%)
📐 Candle Structure:
🔹 Real Body: 121.15 points → Strong Red Body (Bearish Control)
🔹 Upper Wick: 8.90 points → No meaningful buying (Daily TF, Intraday No Wick)
🔹 Lower Wick: 47.80 points → Slight pullback, but bears still dominate(Daily TF)
📌 Interpretation:
Bears were in control from the opening tick
The candle sits near the bottom of the day’s range
Comes after a bullish candle at resistance → Potential short-term reversal signal
Watch for confirmation below 24,330 to trigger an extended downside
⚔️ Gladiator Strategy Update
📌 Strategy Parameters:
ATR: 290.90
IB Range: 129.85
IB Category: Medium IB
Market Structure: Balanced
📌 Trade Highlights:
🔹 Trade Count: 1
✅ Long Trigger @ 11:25 AM → Minor profit as Trade Time Exit Trigger
🔮 What’s Next?
🟥 Short bias: Only below 24,330 with conviction
🟩 Long bias: Only if the price crosses and sustains above 24,460 ~ 24,490
⚠️ Between these levels: Avoid directional bets. Look for scalping setups only.
🔍 Support & Resistance Levels
📌 Resistance Zones:
24,400 ~ 24,420 (Immediate hurdle)
24,480 ~ 24,530 (Key zone with 24,500 psychological level)
24,590
24760~24,800
📌 Support Zones:
24,365 ~ 24,330 (Immediate support)
24,290
24,245 ~ 24,240
24,188
24,050
24,000 ~ 23,950
23,820
23,710 ~ 23,660
🧠 Final Thoughts
"In tight ranges, patience is not just a virtue—it’s a strategy. Let the levels do the talking."
✏️ Disclaimer
This is just my personal viewpoint. Always consult your financial advisor before taking any action.

GBPUSD Sell Insight Last week cleared the previous week's high 1.34232 and closed below it.
This signifies more push to the downside from the weekly perspectives
I'm anticipating the previous weekly low to be the first draw on Liquidity 🧲
On the daily timeframe we have a break of structure from 1.33044 to the downside and the QML level 1.33784 whic6also aligns within an imbalance on the H4 would be used for sell continuation after the short reversal that happens.
Look for entry on the H4 and sell to the draw on Liquidity zone
Kindly share if you find this insightful.
It's been a while here. I'm more active on X (Twitter) now

GOLD (XAUUSD): Your Plan to Buy
The recent fundamentals pumped Gold prices again.
The market is currently trading above a significant
daily resistance.
To confirm a validity of a breakout and to avoid a trap,
I suggest paying close attention to a minor horizontal
range on a 4H time frame.
Your signal to buy will be a 4H candle close above 3388.
It will confirm a breakout and increase the chances that the price will go up.
Goal will be 3435
❤️Please, support my work with like, thank you!❤️
I am part of Trade Nation's Influencer program and receive a monthly fee for using their TradingView charts in my analysis.

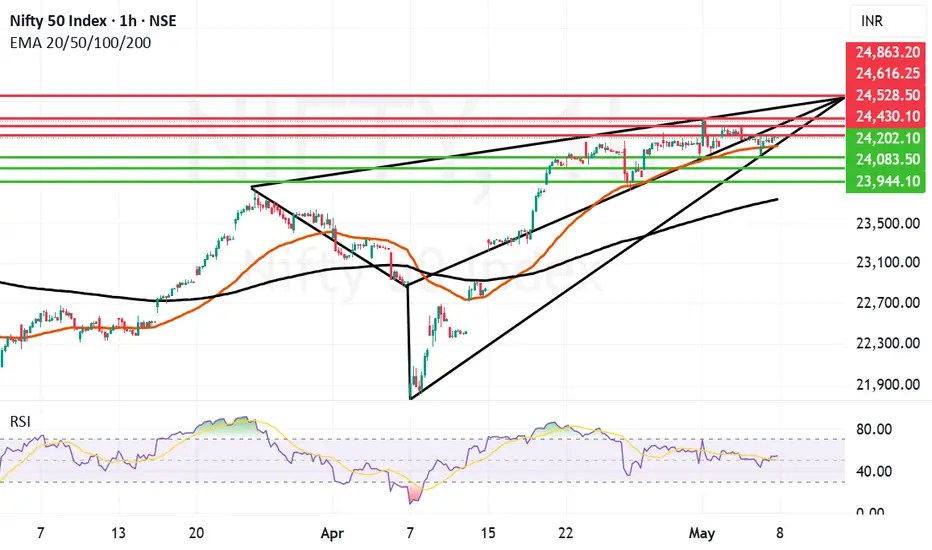
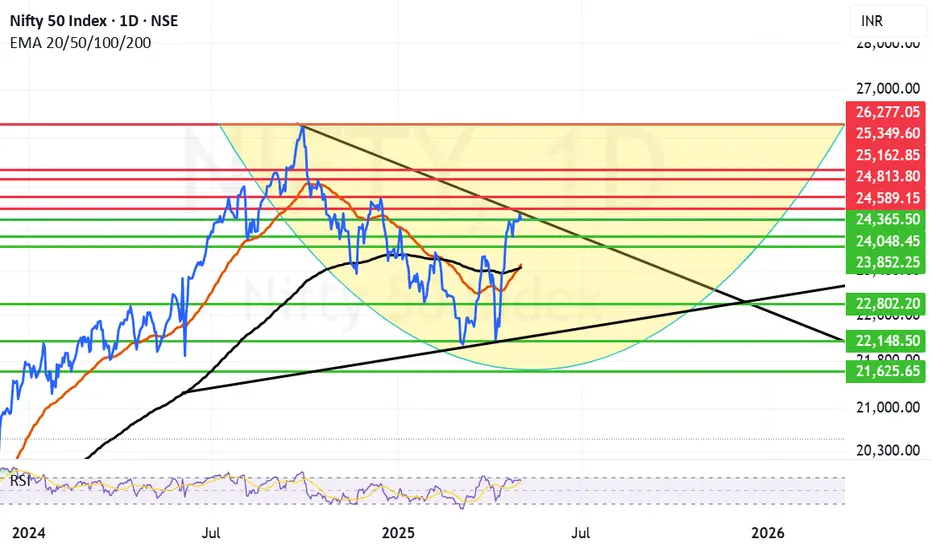
24589 proving to be a difficult resistance to conquerNifty once again tried to sustain the levels above 24500 but again faced resistance and pulled back. Amidst the drums of Ind-Pak war beating and ongoing tariff war the investors are afraid to take seriously long positions. Also we will have a US Fed rate decision coming up which is also adding to the investor anxiety. Mid and Small cap took the maximum brunt today due to all these factors. The Nifty resistance at 24589 is proving very difficult to be conquered with all the noise going around. Nifty resistance levels remain at 24509 and 24589 if we get a closing above 24589 Nifty can easily move for war 24813, and 25162. Supports for Nifty on the down side are at 24365, 24048, 23852 and the zone between 23515 (Mother line) and 23461 (Father line). If we get a closing below 23461, Nifty can again fall to the levels of 22802, 22148 or even 21625. (That is in adverse geo-political developments). A lot right now depends on Macro factors affecting the index and overall situation on Geo-Political front.
Disclaimer: The above information is provided for educational purpose, analysis and paper trading only. Please don't treat this as a buy or sell recommendation for the stock or index. The Techno-Funda analysis is based on data that is more than 3 months old. Supports and Resistances are determined by historic past peaks and Valley in the chart. Many other indicators and patterns like EMA, RSI, MACD, Volumes, Fibonacci, parallel channel etc. use historic data which is 3 months or older cyclical points. There is no guarantee they will work in future as markets are highly volatile and swings in prices are also due to macro and micro factors based on actions taken by the company as well as region and global events. Equity investment is subject to risks. I or my clients or family members might have positions in the stocks that we mention in our educational posts. We will not be responsible for any Profit or loss that may occur due to any financial decision taken based on any data provided in this message. Do consult your investment advisor before taking any financial decisions. Stop losses should be an important part of any investment in equity.
May 6, 2025 GBPUSD Sell📉 Bias: Bearish | Risk: 0.5% | 🎯 Targets: 1:3 (take 75%), final target ~1:7
🧠 Reasoning:
Price reacted from a Daily / Weekly Orderblock with confluence from a 15m OB
Asia Low as target provides clean downside structure
Morning Star formed inside the OB → entry taken at the imbalance left behind
10 pip SL covers highs efficiently ✅

Buy gold, it may continue to rise to 3400-3420!Fundamentals:
Focus on Trump and the Fed’s dynamics;
Technical aspects:
Gold rose to the 3380 area as expected, and even exceeded expectations to 3387. Since gold rebounded near 3222, the willingness to retreat during the rebound was not strong. The lows were constantly raised, and the highs gradually broke upward, which was a very typical shock rise pattern. As the center of gravity of gold shifted upward, the short-term resistance moved up to the 3350-3340 area. Once gold hits this position and rebounds, it may continue to rise to the 3400-3420 area.
Trading strategy:
Consider the opportunity to go long on gold after gold retreats to the 3350-3340 area, TP: 3380

DXY Bullish scenario (Daily)Dxy is still respecting the market maker buy model idea.
Monday traded inside friday range.
Today (Tuesday) price already traded above monday previous high signaling bullish momentum and a higher probability to trade also above friday high.
Right now price is consolidating between a daily bullish fair value gap and a bearish daily volume imbalance.
With the information we have, price is likelly to shop arround with no clear direction before FOMC.
For the current week price is still in the manipulation phase.
Traders will find higher probability trades after FOMC.

ES weekly trading plan for May 6 - May 9ES closed bullish last week. I expect the high of previous weekly candle to be taken out. 15M structure is bullish and in discount zone. I expect manipulation in London open on Tuesday, reversal and move to previous week high

Gold returns to the bull market as expected, follow-up layout🗞News side:
1. The “demand shock” of the Trump administration’s tariffs on the global economy
2. The United States rejected Japan’s request for a comprehensive exemption from 10% reciprocal tariffs and country-specific tariffs in recent negotiations.
3. The conflict between Israel and the Houthis
📈Technical aspects:
From a technical point of view, the 4H gold bulls are once again making an impact. At the top, we focus on the short-term suppression of the 3380-3390 line, focusing on the suppression of the 3400 line. Below, we focus on the short-term support of the 3350 line, and the important first-line support of 3335-3340. In terms of operation, we mainly go long by stepping back on 3350-3360, and the target is temporarily looking at 3380-3390. In the middle position, we should watch more and move less, pursue orders cautiously, and wait patiently for key points to enter the market.
If you agree with this point of view, or you have a better idea, please leave a message in the comment area. I look forward to hearing different voices.
OANDA:XAUUSD FX:XAUUSD FXOPEN:XAUUSD FOREXCOM:XAUUSD TVC:GOLD