Bullish as long as above 24400 As we can see despite the strength in midcap NIFTY fell following the temporary stay in conflict which can be continued at any point of time which creates uncertainties and reflected the same in index. Also operation Keller which has successfully executed by Indian army can add fuel to the fire for upcoming trading sessions and technically as long as we are above 24400, every dip can be bought so plan your trades accordingly and keep watching.
Candlestick Analysis

Bearish sign but we think it pushes to MAJOR RESISTANCEYesterday CRYPTOCAP:BTC formed a BEARISH ENGULFING. We've spoken on this pattern countless times.
However, we didn't bring it up because we didn't/don't think it's relevant.
WHY? Look at the paltry volume. Bitcoin volume is SUPER LOW.
BTC is still in Bullish mode from Late 2022.
---
We turned Bullish again on CRYPTOCAP:BTC around early April:
A) We saw that huge Bitcoin selloff 4/7
2) Which reversed that same day
3) Followed by some buying a couple days later
4) More BTC accumulation 4/21 when it was under 88k
Major resistance coming up soon.
Pause HIGHLY LIKELY.

CPI data market, buy gold!Fundamentals:
Focus on CPI;
Technical aspects:
As expected in my previous article, gold has rebounded to the area around 3250-3260 as expected.According to the current structure, gold tends to fluctuate upward in the short term; it may even extend to the 3280-3290 area.Gold rebounded after touching 3207, and combined with the secondary low point near 3215 to form a "W" structure. This technical structure has formed a strong support structure for gold prices; and after the bad news is exhausted, the on-site wait-and-see funds will gradually enter the market, which will also push up the gold price to a certain extent. So I think gold still has the conditions to challenge the 3280-3290 area!
Trading strategy:
Consider starting to go long on gold in batches in the 3250-3240 area, target price: 3270-3280

NZDCHF: Best Gap to Trade Today?! 📈NZDCHF appears to be a promising trade, out of the different gap openings we see today.
The price has reached a significant intraday resistance level.
I believe that the gap will likely be filled soon, as I am already observing signs of selling pressure on the hourly chart, including the formation of a double top pattern.
It is possible to anticipate a bearish movement towards the 0.4920 support level.

Nifty Analysis EOD - May 13, 2025 - Tuesday🟢 Nifty Analysis EOD - May 13, 2025 - Tuesday 🔴
Is it Retracement or Breakout Failed?
🔍 Nifty Summary
Nifty opened with a mild gap-down of 35 points and within the first 20 minutes, it sliced through multiple supports — Previous Day Close, 24,882, 24,801–24,768, and even 24,730 — in what looked like a determined breakdown. However, the follow-up was missing. Instead of extending lower, the index hovered indecisively near the CPR until 12:30 PM.
Post-lunch, a breakout attempt did arrive — but momentum was lukewarm. Both sides saw significant premium erosion, making it a tough day for option buyers.
Despite the early pressure, Nifty closed at 24,578 (-57 pts) — a mild negative close, but interestingly near multiple fib supports and recent swing zones, hinting at absorption.
🕵️ Intraday Walk
🔽 Broke PDC → 24,882 → 24,801–24,768 → 24,730 within 20 minutes.
🌀 Stuck inside CPR zone until 12:30 PM – volatility without trend.
📈 Breakout attempt post-lunch lacked strength.
💸 Both calls and puts decayed heavily – option writers ruled.
🧭 75-Min Chart Analysis / Zone Commentary
Market flirted with imbalance in the morning, but later balanced out, forming a neutral structure.
The rejection of deeper downside and close near key fibs point to a pause more than a trend.
🔍 Key Observations:
✅ Closed near recent swing high at 24,589
✅ Near 0.382 Fib retracement from the previous close (24,587)
✅ Near 0.618 Fib from the prior session (24,595)
❌ No follow-through after support breaks
❌ Momentum faded quickly after the breakout attempt
📌 Implication:
The market shows signs of absorption near support zones but lacks strength for a reversal — neutral to slightly bullish bias, but still cautious.
🛡 Gladiator Strategy Update
Strategy Parameters
ATR: 362.82
IB Range: 298.2 → 📏 Large IB
Market Structure: ⚖️ Balanced
Trade Highlights
📈 Long Trigger @ 12:40 PM
🎯 Target 1:1 Achieved
💼 Total Trades: 1
🔢 Support & Resistance Levels
🟩 Resistance Zones:
24,660
24,730
24,768 ~ 24,800
24,882
24,980 ~ 25,000
25,100 ~ 25,128
25,180 ~ 25,212
🟥 Support Zones:
24,882
24,800 ~ 24,768
24,730
24,660
24,590
24,530 ~ 24,480
24,461
24,420 ~ 24,400
24,365 ~ 24,330
24,245 ~ 24,240
🔮 What’s Next?
Today’s session looked like a failed to sustain above 24800 and lack of retracement. close around the fib level, raises a question about whether is it breakout failure or just retracement ?
In short: no clarity.
📌 If Nifty holds above 24,530–24,480, it may attract buying towards 24,730–24,800 again.
📉 But a sustained break below 24,480 could invite a retest of 24,365 ~ 24,330 zone.
➡️ For now, traders should stay nimble and option buyers cautious.
💬 Final Thoughts
“Confusion is a part of clarity. Let the market reveal itself — reacting is better than predicting.”
✏️ Disclaimer
This is just my personal viewpoint. Always consult your financial advisor before taking any action.

SPY squeaked above the 78.6 Fib level If the daily candle holds, we could be challenging the all time high shortly thereafter. And if the weekly candle holds above...

USDCHF: Correctional Movement Ahead?! 🇺🇸🇨🇭
USDCHF may continue a correctional movement after
a release of the today's US CPI data.
A technical price action confirmation that I spotted is a
valid Change of Character CHoCH on an hourly time frame.
We can expect a bearish continuation to 0.8358
❤️Please, support my work with like, thank you!❤️
I am part of Trade Nation's Influencer program and receive a monthly fee for using their TradingView charts in my analysis.

CPI data released, golden day analysis and operation layout🗞News side:
1. CPI data is in line with expectations, short-term positive
📈Technical aspects:
As we wrote in the last post, from the 4H point of view, the oversold is serious, and there is a need for rebound correction in the short term. At present, the fluctuation of gold prices is mainly affected by news. Technical analysis and indicators can only be used as a side analysis guide and reference. Gold bottomed out in the morning and rebounded, and the European market continued to rise above 3250. This means that today is not a very weak bear. At the same time, the daily line touches the 30-day moving average support. There is a high probability of turning positive today. The overall idea is to treat the market as a shock.
Intraday gold operation suggestions:
🎁BUY 3240-3250
🎁TP 3260-3270
Looking further towards the 3277 line
If you agree with this view, or have a better idea, please leave a message in the comment area. I look forward to hearing different voices.
OANDA:XAUUSD FX:XAUUSD TVC:GOLD FXOPEN:XAUUSD FOREXCOM:XAUUSD

Nifty cooled down from the overbought zone. The correction in Nifty we saw today in most likelihood seems like a correction from overbought zone. The indicator for this is RSI which had reached 77.09 yesterday in the hourly chart. After the correction today it is back to 53.28 after reaching 51.5 earlier today. Another reason can be US and China agreeing to a trade deal which might also be seen as a negative for Indian markets. whether it will have very negative impact and send market further down is there to be seen. IT, Metals, Infra, MNC, Pvt Banking and Finance stocks were laggard. The indices that were positive today are Midcap, Small cap, Psu Banks, CG, Media and Pharma.
Supports for Nifty remain at: 24450 (Mother line of Hourly chart), 24374, 24165, 23929 (Father line of Hourly chart) and Mid channel support at 23786.
Resistances for Nifty remain at: 24642, 24797 and 25012 (Channel top resistance).
Shadow of the candle looks neutral as of now.
Disclaimer: The above information is provided for educational purpose, analysis and paper trading only. Please don't treat this as a buy or sell recommendation for the stock or index. The Techno-Funda analysis is based on data that is more than 3 months old. Supports and Resistances are determined by historic past peaks and Valley in the chart. Many other indicators and patterns like EMA, RSI, MACD, Volumes, Fibonacci, parallel channel etc. use historic data which is 3 months or older cyclical points. There is no guarantee they will work in future as markets are highly volatile and swings in prices are also due to macro and micro factors based on actions taken by the company as well as region and global events. Equity investment is subject to risks. I or my clients or family members might have positions in the stocks that we mention in our educational posts. We will not be responsible for any Profit or loss that may occur due to any financial decision taken based on any data provided in this message. Do consult your investment advisor before taking any financial decisions. Stop losses should be an important part of any investment in equity.

Bitcoin Forecast: May 2025 OutlookMay 2025 has marked a strong upward trend for Bitcoin, with the leading cryptocurrency steadily trading in the $100,000–$105,000 range and hitting multi-month highs. This growth has been largely fueled by active accumulation from institutional investors, including exchange-traded funds (ETFs), reinforcing Bitcoin’s growing integration into the traditional financial system.
Institutional Demand as a Key Driver
A major factor behind Bitcoin’s recent surge is the increasing flow of capital from institutional investors. Large ETFs, such as those managed by BlackRock and Fidelity, have expanded their positions in BTC, sending a strong signal of confidence from established financial institutions. This has further boosted interest from retail investors and strengthened the overall bullish momentum.
Macroeconomic Context
Another significant influence is the market's anticipation of a potential interest rate cut by the U.S. Federal Reserve. A more dovish monetary policy stance would make riskier assets, including cryptocurrencies, more attractive, encouraging further investment in Bitcoin.
While the Fed is expected to make a rate decision in June, markets tend to price in such moves early, which is already being reflected in Bitcoin’s price trajectory.
Forecast: How Much Could Bitcoin Be Worth by End of May?
Given the current momentum and positive market sentiment, analysts suggest that Bitcoin could continue its ascent. Optimistic forecasts predict that BTC might reach $120,000–$130,000 by the end of the month, provided macroeconomic conditions remain favorable. Still, the inherent volatility of the crypto market means potential pullbacks should not be ruled out.
Conclusion
May 2025 could prove to be a pivotal month for Bitcoin. Increased institutional participation, supportive macroeconomic signals, and favorable technical indicators are all contributing to its ongoing rally. If the current trend continues, Bitcoin could set new all-time highs in the coming weeks.

US 100 - Could The Recovery Continue?A press conference yesterday morning led by US Treasury Secretary Bessant and Trade representative Greer outlined a positive conclusion to the first round of trade talks between the US and China. The news grabbing headline was a 90 day reduction in combined US levies on Chinese imports being reduced from 145% to 30% and Chinese duties on US goods dropping from 125% to 10%.
This announcement put a further squeeze on weak short equity positions, and gave fresh impetus to the bulls, helping to fuel a 4% rally in the US 100, taking it above some interesting technical levels (more on this below).
Now, with a framework in place for further talks between the world’s two biggest economies, representatives from the two countries have 90 days to work towards a broader agreement. However, US Treasury secretary Bessant did say that there may be a chance to extend the tariff reduction for a longer period if there is good faith, engagement and constructive dialog to keep moving forward. A slight caveat which outlines the huge amount of negotiation and focus that needs to be maintained from both sides to finalise a more long term agreement.
While traders may still be focused on trade negotiations and potential trade deal updates with allies across the rest of this week, there is also some economic data to focus on. The latest US inflation reading in the form of CPI is due out later today at 1330 BST, where any deviation from market expectations may either add further buying momentum to the recent move higher, or give traders a reason to take profits against some potentially important technical levels.
Technical Update: Breakout From the Late March Highs
With a positive reaction to the US/China trade talks seen in US equities, the US 100 index has posted its highest closing level since February 26th 2025, as price strength has continued to emerge from the capitulation to 16290 on April 7th.
Traders are possibly now viewing the ability of the index to close above 20871, the March 25th session high, as something that may lead to a more sustained period of price strength.
Of course, a break of a previous price high isn’t always a guaranteed signal of price strength, but with the constructive pattern of higher price highs and higher price lows in place since the April 7th low (16290), the question may now be asked, what are the next potential resistance levels to current strength?
Potential Resistance Levels:
Having seen a new recovery price high for the current phase of strength posted on Monday at 20914, traders may now be viewing this level as a possible first resistance, and how this level is defended on a closing basis could be important.
However, following the latest price strength, if closes above this 20914 high were to materialise, traders might then shift their focus to 22226, which is the February 18th all-time high, as the next possible resistance area.
Potential Support Levels:
Of course, much depends on future market sentiment and price trends, and we know price strength can quickly fail, even reverse back to the downside. So, we must be aware of possible support levels that if broken, may see risks to turn towards potential of declines.
A support focus might now be half of the latest price strength seen from last week’s low, which stands at 20252. If this level gives way, a deeper decline might then be on the cards back towards 19627, which is equal to the 38.2% Fibonacci retracement of April to May 2025 strength.
The material provided here has not been prepared in accordance with legal requirements designed to promote the independence of investment research and as such is considered to be a marketing communication. Whilst it is not subject to any prohibition on dealing ahead of the dissemination of investment research, we will not seek to take any advantage before providing it to our clients.
Pepperstone doesn’t represent that the material provided here is accurate, current or complete, and therefore shouldn’t be relied upon as such. The information, whether from a third party or not, isn’t to be considered as a recommendation; or an offer to buy or sell; or the solicitation of an offer to buy or sell any security, financial product or instrument; or to participate in any particular trading strategy. It does not take into account readers’ financial situation or investment objectives. We advise any readers of this content to seek their own advice. Without the approval of Pepperstone, reproduction or redistribution of this information isn’t permitted.

KEEP A CLOSE WATCH! REVERSAL IS COMING SOON ON GJ!Price is trading high! Earlier today around 1AM (GMT) we had an aggressive sell off around 195.430 that could be sigh of trend exhaustion . I anticipate a decline soon.

Today's gold trend analysis, go long in batches🗞News side:
1. China-US trade relations eased, suspending some tariffs and countermeasures
2. Russia and Ukraine suspended firing for 30 days, and the India-Pakistan conflict was temporarily mediated
📈Technical aspects:
Since the US and China lowered some tariffs after the negotiation, the US dollar has recovered some of its losses, but gold has not completely recovered some of its losses. At present, the price of gold has once again retreated to near the 3260 line. Although the hourly level MACD indicator shows a golden cross, the daily level is still a dead cross and heavy volume.
Then in the short term, the gold price may show some counter-twitching momentum before the US dollar steps back to confirm support, or it may touch near the 3277 line. The gold price may fall further after the US dollar steps back to confirm the support. From a technical point of view, the upper daily resistance is near 3287, while the lower first-line support of 3200 is strong, and there is a tendency to form a double bottom. The European market can consider using 3250-40 US dollars as a support point, and the early trading low near 3220 as a defensive position. First, let's see the gold price continue to rebound to 3277-80-87, unless the European market weakens and breaks the Asian low, and then the US market adjusts. Temporarily, we will see a rebound correction.
If you agree with this view, or have a better idea, please leave a message in the comment area. I look forward to hearing different voices.
FOREXCOM:XAUUSD FXOPEN:XAUUSD TVC:GOLD FX:XAUUSD OANDA:XAUUSD

EURUSD: Pullback From Support 🇪🇺🇺🇸
It looks like it is finally the moment for EURUSD to pull back.
I see a strong intraday bullish confirmation this morning
with a formation of a cup & handle pattern on an hourly time frame.
I expect a pullback at least to 1.117
❤️Please, support my work with like, thank you!❤️
I am part of Trade Nation's Influencer program and receive a monthly fee for using their TradingView charts in my analysis.

NZDUSD Short BUYERS' LAST BREATH — THE SWITCH IS IN
Pair: NZDUSD
Timeframe: 4H (pullback in a Daily downtrend)
Bias: Short
Setup: SnR retest sell, Potential 5R setups
Daily trend is down — this 4H move was just a pullback.
I watched the buyers push from support with weak momentum. First sign? Volume dries up, price stalls — buyer exhaustion kicks in. But no real sellers stepped in yet — they waited. That's what made it deadly.
Then came the final buyer push. One last attempt to save the move.
But instead of strength, it exposed weakness — and the sellers took over. Fast. Clean break, shift in pressure, game flipped.
Entry & Risk:
Entry: After the failed buyer push and a clean shift in momentum.
Stop: Just above the last push (invalidates if price gets back there).
Target: Back into the daily move — lower liquidity zones.
What I’m Trading Here?
Trap logic: Buyers thought they had it — they didn’t.
Structure shift: Reclaim confirms control switched.
Daily momentum: This is a continuation play — not a reversal.
I'm already short

UPS United Parcel Service Stock. Top stock to buy in 2025UPS United Parcel Service Stock. Top stock to buy in 2025 after reaching the strong monthly demand level. It took 50 months to reach it and now it's trying to play out as expected. Long-term longs for this American stock.

Moo Deng Meme Coin Cryptocurrency Expecting a Sell-off Expecting a strong sell-off on Moo Deng Meme Coin Cryptocurrency after the strong monthly supply has been reached. There is a lot of profit for margin on the way down.

GBPUSD SHORTPrice took me out last week but looks like it was a liquidity grab, Now reacting to what the market is showing me;
Market structure bearish on HTFs DW
Entry at both Weekly And Daily AOi
Weekly Rejection at AOi
Daily Rejection at AOi
Daily Previous Structure Point
Around Psychological Level 1.33500
H4 EMA retest
H4 Candlestick rejection
Rejection from Previous structure
Levels 4.43
Entry 100%
REMEMBER : Trading is a Game Of Probability
: Manage Your Risk
: Be Patient
: Every Moment Is Unique
: Rinse, Wash, Repeat!
: Christ is King.

ADANIGREEN
Adani Green Energy Ltd. is showing signs of a potential breakout above ₹980, with short-term targets of ₹1000, ₹1050, and ₹1100. Investors may consider accumulating if the stock dips below ₹856, presenting a strategic entry point.
Fundamental Insights (Q4 FY25)
- Revenue from Power Supply: ₹2,666 crore, up 37% YoY.
- EBITDA from Power Supply: ₹2,453 crore, reflecting 35% growth YoY.
- EBITDA Margin: 91.3%, maintaining industry-leading efficiency.
- Net Profit: ₹230 crore, a 53% YoY increase.
- Total Income: ₹3,278 crore, up 15% YoY.
- Cash Profit: ₹1,231 crore, marking an 18% YoY rise.
- Operational Capacity: Expanded 30% YoY to 14.2 GW, reinforcing its leadership in India's renewable energy sector.
- Energy Sales: 27,969 million units, a 28% YoY increase, equivalent to half of Singapore’s annual power consumption.
- Greenfield Capacity Additions: 3.3 GW, the highest ever by any Indian renewable energy company.
- Solar Capacity Utilization Factor (CUF): 32.4%, showcasing strong operational efficiency.
- Debt Refinancing: Successfully refinanced USD 1.06 billion with long-term debt aligned to cash flow lifecycle.
Happy Investing :)
Stockerrr

Sell Signal for GBPUSD!Hey Guys,
In the new analysis on GBPUSD, price is close to a potential resistance area and based on the latest trend, it can be another good opportunity to open a sell position (as I've defined) with a good risk/reward ratio(1/3)
You can consider different Take profits and partially close your position until to the latest target.
Good luck :)

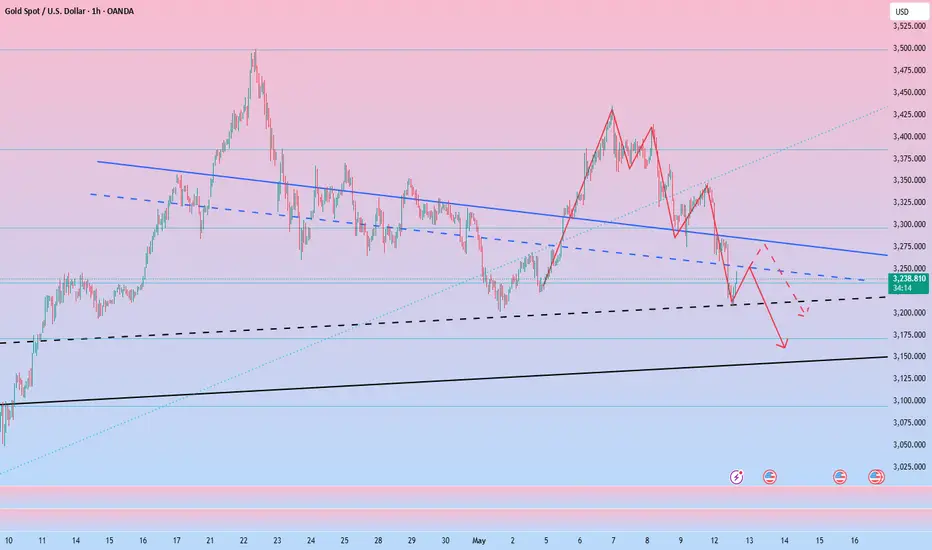
Gold is trading sideways, can the bearish trend continue?🗞News side:
1. China-US trade relations eased, suspending some tariffs and countermeasures
2. Russia and Ukraine suspended firing for 30 days, and the India-Pakistan conflict was temporarily mediated
📈Technical aspects:
The trading strategy given today, if brothers have reference and follow the trading strategy to participate in long orders, I think you should all have good gains on hand. At present, gold is in consolidation, the 4H moving average is in a short position, and the MACD dead cross continues to increase, so the short-term short momentum still exists. From a technical point of view, in the downward trend from last week's high of 3347 to the current low of 3207, 3260 is at a key position. Therefore, we pay attention to the possibility of gold rebounding to 3260 in the evening.
If you agree with this view, or have a better idea, please leave a message in the comment area. I look forward to hearing different voices.
OANDA:XAUUSD FX:XAUUSD TVC:GOLD FXOPEN:XAUUSD FOREXCOM:XAUUSD

Start going long on goldAt present, the trend of gold is relatively calm, but as gold rebounds, a certain support strength has been shown below; and the short-term negative news has all appeared, and gold needs to rebound at the technical level. Therefore, I think we can try to go long on gold in small batches in the current area of 3230-3220, and expect gold to continue to rebound to the 3250-3260 area, or even the 3280-3290 area.
Trading strategy:
Try to start going long on gold in small batches in the 3230-3220 area; TP: 3250-3255

Equity markets look bullishIf the weekly candle closes as it has started - or better - it's a crystal clear bullish reversal for the equity markets.

Continue to short gold after the reboundFundamentals:
The positive signals from the China-US negotiations have eased the market's concerns about the US economic recession, and the weakening of risk aversion has stimulated a sharp pullback in gold. Market funds are no longer eager to seek safe-haven assets, so they withdraw their funds from gold and turn to risk markets.
Technical aspects:
The gold price plummeted by $110 during the day. Although it has rebounded slightly at present, the overall rebound momentum is relatively weak. The upper 3280-3290 area is currently the main short-term suppression level, followed by the 3240-3250 area. If the rebound in this area is not broken, you can continue to short gold, and the shorts may continue to reach new lows; focus on the support of the 3200 mark below. If 3200 is not broken, then the bulls may try to counterattack and fill the upper gap; if gold falls below 3200, gold will continue to fall to the area around 3170.
Trading strategy:
1. Consider shorting gold after it rebounds to the 3245-3255 area, TP: 3220
2. Consider going long on gold after it continues to fall to the 3180-3170 area, TP: 3220;
3. If gold stabilizes above 3200, we can consider going long on gold around 3200 in advance.