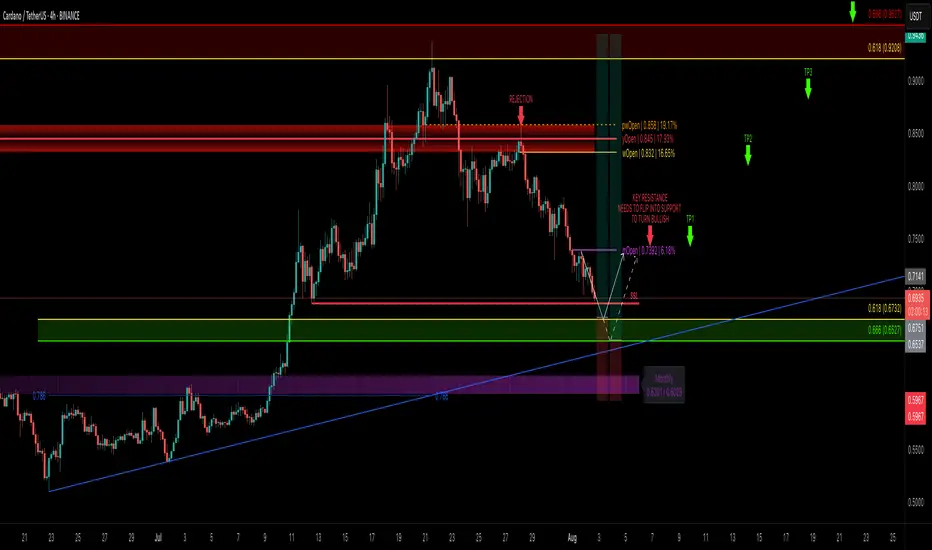
ADA Correction Nearing Completion — Is It Time to Load Up?After tagging the golden pocket resistance zone between $0.9208–$0.9527, ADA completed a clean 5-wave Elliott impulse right into a major resistance. Since then, price has corrected -25%, and we’re now likely nearing the end of an ABC correction — the final wave C.
🧩 Technical Breakdown
➡️ Wave A: 5-wave drop after the peak
➡️ Wave B: Bounce rejected at yearly open (yOpen) — that was a great short opportunity around $0.845
➡️ Wave C: Now working toward completion
🎯 C Wave Target Zone: $0.69–$0.65
This zone has strong confluence:
0.618 Fib retracement of the entire 5-wave move at $0.6732
1.0 TBFE (Trend-Based Fib Extension) aligns perfectly
Sell-side liquidity (SSL)
0.786 Fib Speed Fan support
Monthly 21 EMA/SMA adding a final confluence layer
🟢 Long Setup
Entry Zone: $0.69–$0.65 (ladder in)
Stop Loss: Below the monthly 21 EMA/SMA ($0.6)
Target 1: mOpen key resistance
Target 4: 0.666 Fib at ~$0.95
Risk:Reward: ~1:4+
💡 Educational Insight
After a 5-wave impulsive move, ABC corrections are common. Using the Trend-Based Fib Extension tool to project wave C, especially when paired with liquidity zones, VWAP, or moving averages, helps pinpoint high-probability reversal zones. It’s about confluence and reaction — not prediction.
🔍 Indicators
For this analysis, I’m using my own indicators
DriftLine – Pivot Open Zones and
MFT MA Support/Resistance Zones
both available for free. You can find them on my profile under “Scripts” and apply them directly to your charts for extra confluence when planning your trades.
_________________________________
💬 If you found this helpful, drop a like and comment!
Cardano
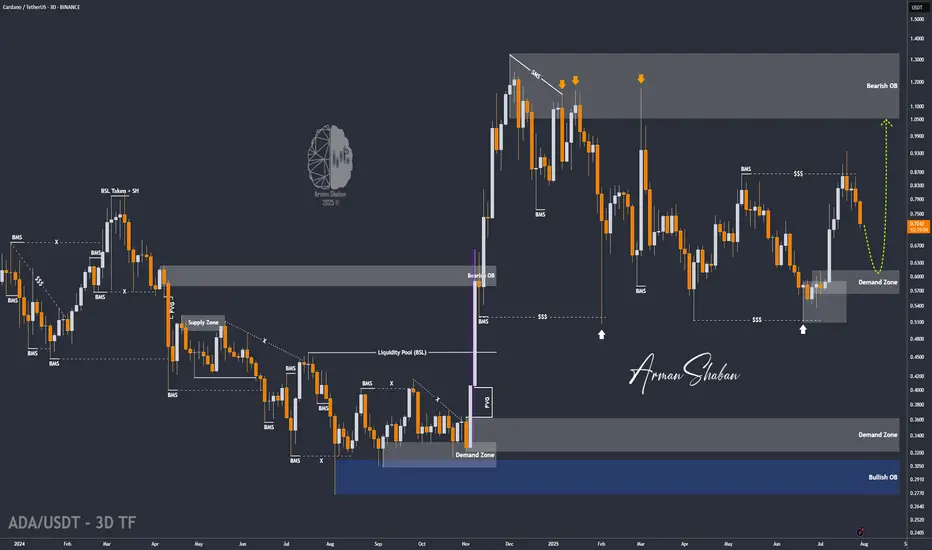
ADA/USDT | ADA Slips Below Support – Watching $0.61 for Support!By analyzing the Cardano chart on the 3-day timeframe, we can see that the price failed to hold above the $0.75 support and is currently trading around $0.72. Given the current momentum, a deeper correction for ADA seems likely. If the price fails to stabilize above $0.69, we could see a sharp drop toward the $0.61 zone. If ADA reaches this key support area, keep a close eye on it — a strong bullish reaction could lead to the next big upside move!
Please support me with your likes and comments to motivate me to share more analysis with you and share your opinion about the possible trend of this chart with me !
Best Regards , Arman Shaban
DeGRAM | ADAUSD held the $0.7 level📊 Technical Analysis
● ADAUSD is respecting the newly established rising support line after bouncing from the 0.695 level, confirming higher lows within a bullish channel.
● The price is now breaking out of a falling flag structure and is on course to retest the confluence resistance near 0.88 and the descending purple trendline.
💡 Fundamental Analysis
● Cardano’s DeFi metrics remain strong, with TVL surpassing $400M—its highest since early 2022—boosted by staking and stablecoin growth.
● Optimism surrounding the Chang hard-fork and renewed institutional interest is helping reinforce mid-term buying pressure.
✨ Summary
Buy above 0.695. Target 0.86 → 0.88. Setup remains valid while price holds above 0.68 trend support.
-------------------
Share your opinion in the comments and support the idea with a like. Thanks for your support

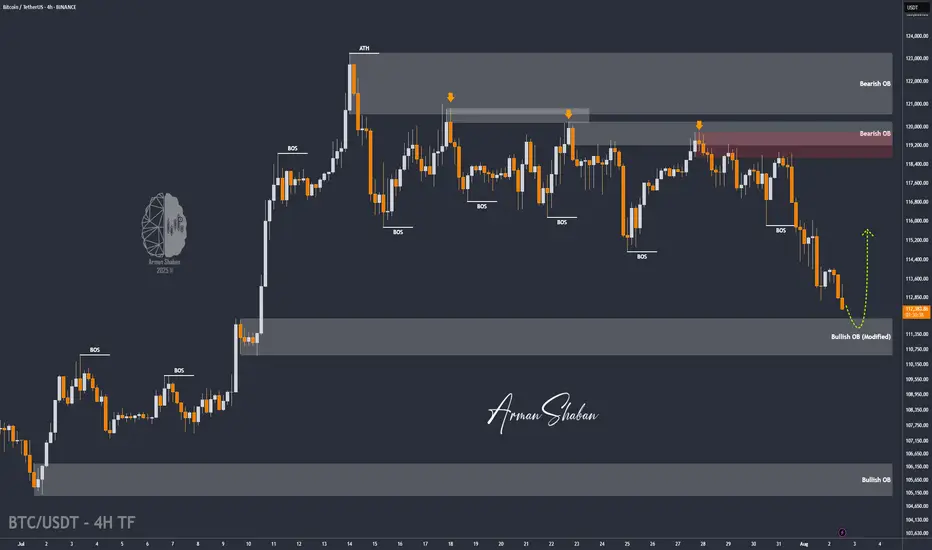
BTC/USDT | Bitcoin Eyes Rebound from $110K Support Zone! (READ)By analyzing the Bitcoin chart on the 4-hour timeframe, we can see that after reaching a new high at $123,218, the price began to pull back and has now corrected down to around $112,500. I expect the current volatility to ease soon. The next critical support zone lies between $110,500–$112,000 — watch price action closely here, as BTC could bounce from this area and push back toward $116,000+. Other key demand zones are located at $109,000, $107,900, and the $105,000–$106,000 range.
Please support me with your likes and comments to motivate me to share more analysis with you and share your opinion about the possible trend of this chart with me !
Best Regards , Arman Shaban
ETH/USDT | ETH Under Pressure – Watch $3500 Support!By analyzing the Ethereum chart on the weekly timeframe, we can see that after reaching the $3940 zone, ETH faced selling pressure and is now trading around $3540. If the price fails to hold the key $3500 support, a deeper decline is likely, with potential targets at $3040 first and possibly $2680 as the second bearish target.
Please support me with your likes and comments to motivate me to share more analysis with you and share your opinion about the possible trend of this chart with me !
Best Regards , Arman Shaban

Cardano will break out of the falling channel ┆ HolderStatBYBIT:ADAUSDT broke out of a falling channel and is showing renewed bullish momentum. With structure turning supportive and higher lows forming, a move toward the $0.84 level appears likely if buying strength sustains.
We are moving - Cardano weekly update August 6 - 12thCardano appears to have completed a clean Wave 2 correction and is now forming the first 1-2 setup within a larger impulsive move to the upside. From an Elliott Wave perspective, this suggests we are at the very beginning of a broader bullish development. Structurally, the chart aligns across multiple degrees of trend: we are currently within Cycle Wave 3, Primary Wave 1, and Intermediate Wave 3 — a highly favourable configuration for strong upside momentum.
The recent retracement reached the 0.5 Fibonacci level, where price reacted strongly and formed a well-defined bullish order block. This confluence between Fibonacci support and structural demand reinforces the idea that the local bottom is likely in place. The move off the lows also began with a clear five-wave advance, indicating that an impulsive structure is developing.
While an alternative scenario is shown on the chart — suggesting a possible deeper correction — this is considered low probability. The main reason this alternative exists is the relatively short time duration of the Wave 2 correction, which might appear shallow compared to expectations. However, given the structural symmetry, the clear order block, and the impulsive reaction from support, the primary bullish scenario remains heavily favoured.
Additional confluence comes from sentiment and derivatives data. Funding rates are still in negative territory but are turning upward, signalling a potential shift in market positioning toward longs. At the same time, open interest is increasing — an encouraging sign of growing participation and conviction in the current move.
The liquidity heatmap currently shows significant clusters both above and below the current price, making the liquidity picture overall neutral. However, this also implies potential for strong directional movement should one side be taken out decisively. Overall, the technical and sentiment-based evidence points to a structurally sound bullish setup with limited downside risk, so long as the current low remains protected.
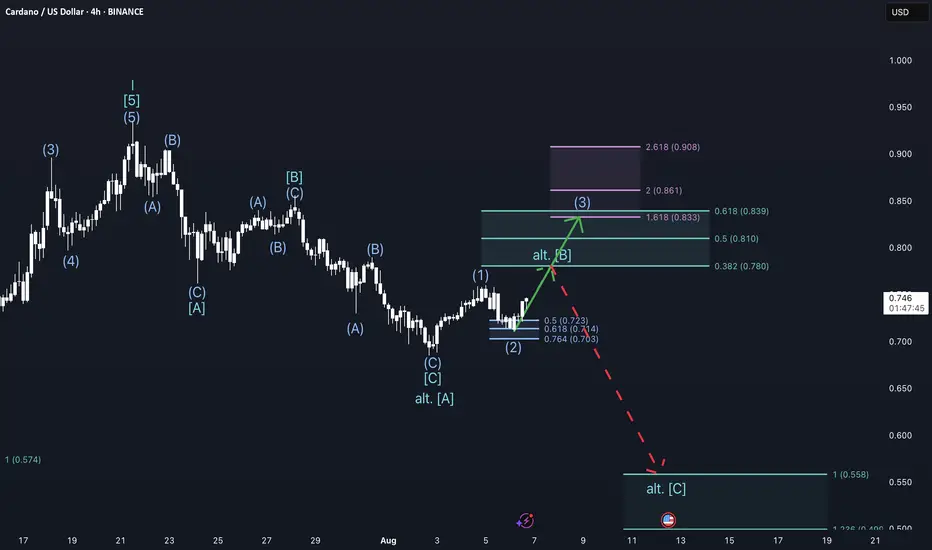
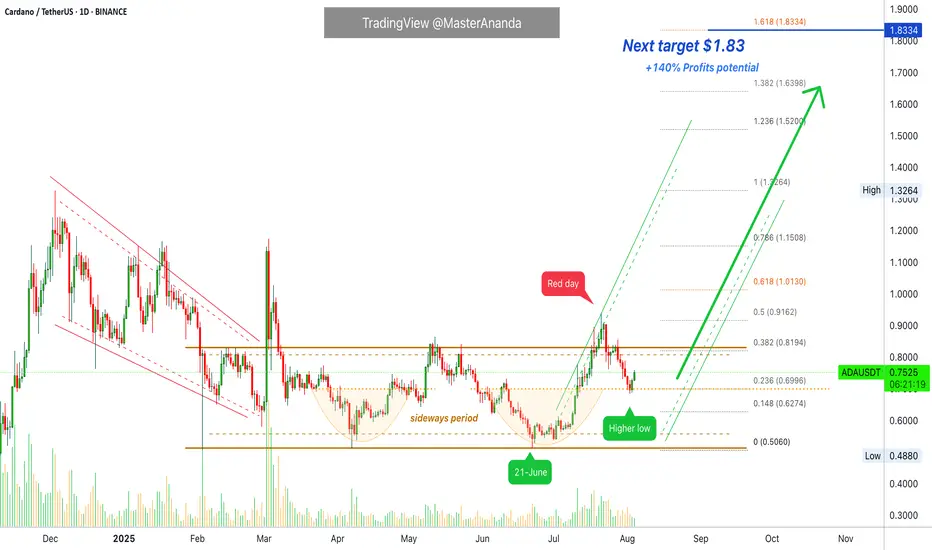
Cardano Higher High Hidden Signal Confirmed · UpdateGood news. We already have a higher low and Cardano back into the long-term accumulation zone but on the bullish side. You know a channel has a middle portion always and the lower portion relates to the bears while the upper portion is owned by the bulls. This is the good news, Cardano is staying safely, nicely on the bullish side of the 2025 consolidation channel. Cardano has been in this range almost the entire year but everything looks great.
The broader bias is bullish based on the strong advance late last year. This was a strong advance and every strong move needs to be consolidated before anything else happens. This is the correction followed by sideways action. After this phase is over, now, then we see a new move develop, the continuation of the previous move—the bullish wave.
We have 140% profits potential (PP) to $1.83 but this is still some middle way, mild, middle portion move. The market will continue to heat up, evolve and grow and as this happens we will be taking out several resistance zones and with these gone we can expect higher prices and finally the new all-time high we have been waiting for for so long. Patience of course.
Chart: Cardano (ADAUSDT) Daily Timeframe with MA200
Notice just three days below MA200 and now back above this level. In the past when ADAUSDT moved below MA200 it would stay months below this level. This time it was pierced briefly and the action moves back above. This means that the bulls are in control.
The retrace was short, small and low volume which means weak. Weak bears, weak sellers means that we are bullish and bullish means green.
With all this said and done, you can expect growth for months. Continue to buy, continue to trust and continue to hold. You will be happy with the results. Crypto is going up.
Energy for all readers. Let's grow together, let's be open, learn and share. The best is yet to come. You are special. You are a divine living being and you deserve the best... Thanks a lot for your continued support.
Namaste.
SOL/USDT | NFP Volatility Could Trigger Drop Toward $154!By analyzing the Solana chart on the daily timeframe, we can see that the price is currently trading around $169. If it fails to hold above the $168 level, a deeper drop could follow. With the upcoming NFP data release, increased volatility is expected across the markets. If Solana begins to decline, the potential correction targets are $163, $157, and $154. Watch the $145–$154 zone closely for a possible bullish reaction and buy opportunity.
Please support me with your likes and comments to motivate me to share more analysis with you and share your opinion about the possible trend of this chart with me !
Best Regards , Arman Shaban
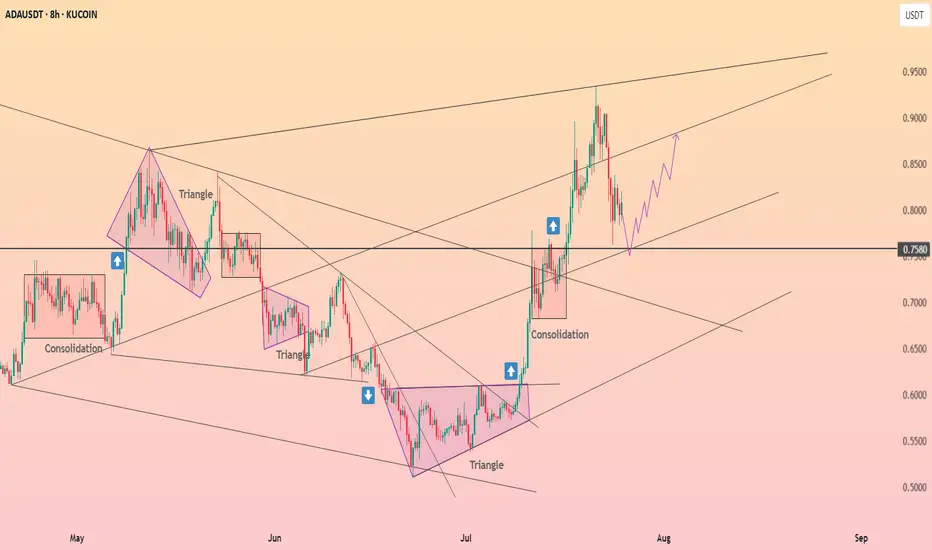
ADA Ready for PUMP or what ?The price on the 3d timeframe is within a triangle, which can create some uncertainty about which direction it will move. Here, we should wait to see which side of the triangle the price breaks out from. Remember, the trend is our friend.
Best regards CobraVanguard.💚

Cardano has successfully completed retesting ┆ HolderStatBINANCE:ADAUSDT is trading inside a symmetrical triangle near support at $0.445. Price continues to coil tightly with lower highs and higher lows, building pressure. A breakout above $0.465 would confirm bullish momentum toward the $0.49–0.50 zone. Key support remains intact and buyers are stepping in at every dip. A major move looks imminent.

TON/USDT | Surges 18% – Eyes on $3.63, Then $4.20 and $4.68!By analyzing the Toncoin chart on the 3-day timeframe, we can see that after a pullback to the $3 area, strong demand kicked in, and within just one week, the price surged over 18%, reaching above $3.5. Toncoin is currently trading around $3.53, and I expect it to hit the $3.63 target soon. The next bullish targets after that are $4.20 and $4.68.
Please support me with your likes and comments to motivate me to share more analysis with you and share your opinion about the possible trend of this chart with me !
Best Regards , Arman Shaban
ADA, long term dubious speculationWARNING: This idea is highly dubious!
This is a logarithmic estimate of potential targets, in case Cardano moves in long logarithmic measures.
The real potential of this idea is strongly linked to the fundamentals evolution on time, i.e.: FED reducing the interest rate, for instance, but not only.
The plot features top and bottom limits drown by hand!, these are not perfect logarithmic measures, thus they certainly lacks of math accuracy. Beware.
There are zones in red and green, as transparent boxes, which depicts potential zones of buy and sell interest, of course, everything is in a log scale.
Everyone wish these kind of scenarios to be true. Only time and reality will show us the true face of it. In any case, in the total chaos of uncertainty that this market is, we try to make a sense of it.
Best of the lucks for everyone.
T.
DISCLAIMER: Do your own research! This idea is not a financial advice. All the information presented is highly speculative and cannot be taken as a reference in any circumstance.
Short Breakdown of Cardano (ADAUSDT) weekly/daily technicalsLooked over this for a friend. Rowland I would love your feedback in the comments 🫡
I will see my biggest expectation is for this to make it's way into the weekly imbalance range below the weekly Mother Candle we are existing within. The entire crypto market seems to want to revisit some key lows to correct some inefficiently delivered rally ranges (meaning too many pending orders left behind due to price not coming back to grab them, happens when HUGE money places--attempts to place/fill--bulk orders).
We are getting what I think is a temporary bullish correction due to taking of profits at key lows. It is my belief/observation that after correcting the newly minted bearish range (grabbing pending shorts above daily highs--turtle soup I think they call it), we will be able to drive down into the bullish imbalance weekly candle's range.
Let's see how we go! 😈

ADA/USDT | Pullback to Key Support – Can It Rebound Toward $1.32By analyzing the Cardano chart on the 3-day timeframe, we can see that after reaching $0.935, the price faced selling pressure and dropped by 18% to the $0.76 area. Now, the key is whether ADA can hold above the $0.75 level by the end of the week. If it succeeds, we could expect further bullish continuation. The next potential targets are $0.86, $0.93, $1.02, and $1.32.
Please support me with your likes and comments to motivate me to share more analysis with you and share your opinion about the possible trend of this chart with me !
Best Regards , Arman Shaban
ADA - Time to buy again! (Update)The pattern has broken, and now I expect the price to rise to $1.20 . AB=CD.
Give me some energy !!
✨We spend hours finding potential opportunities and writing useful ideas, we would be happy if you support us.
Best regards CobraVanguard.💚
_ _ _ _ __ _ _ _ _ _ _ _ _ _ _ _ _ _ _ _ _ _ _ _ _ _ _ _ _ _ _ _
✅Thank you, and for more ideas, hit ❤️Like❤️ and 🌟Follow🌟!
⚠️Things can change...
The markets are always changing and even with all these signals, the market changes tend to be strong and fast!!

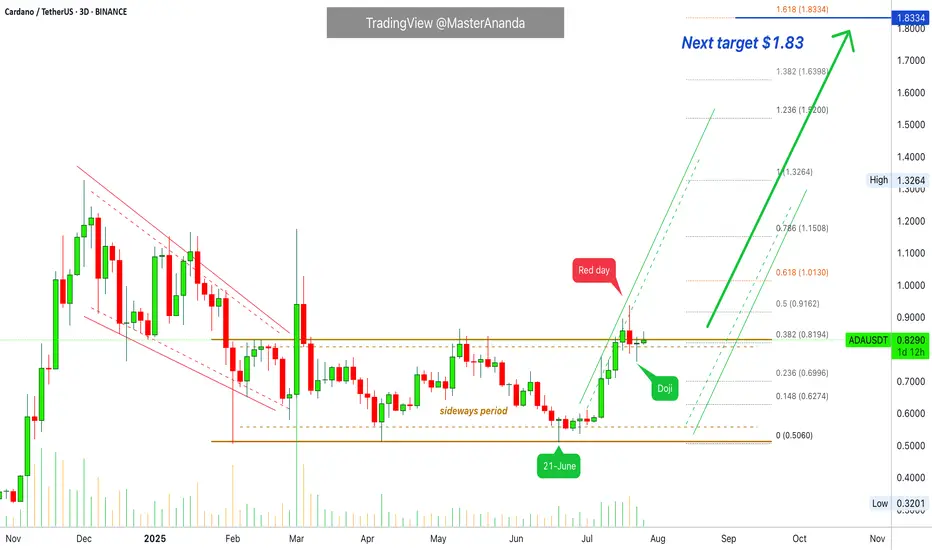
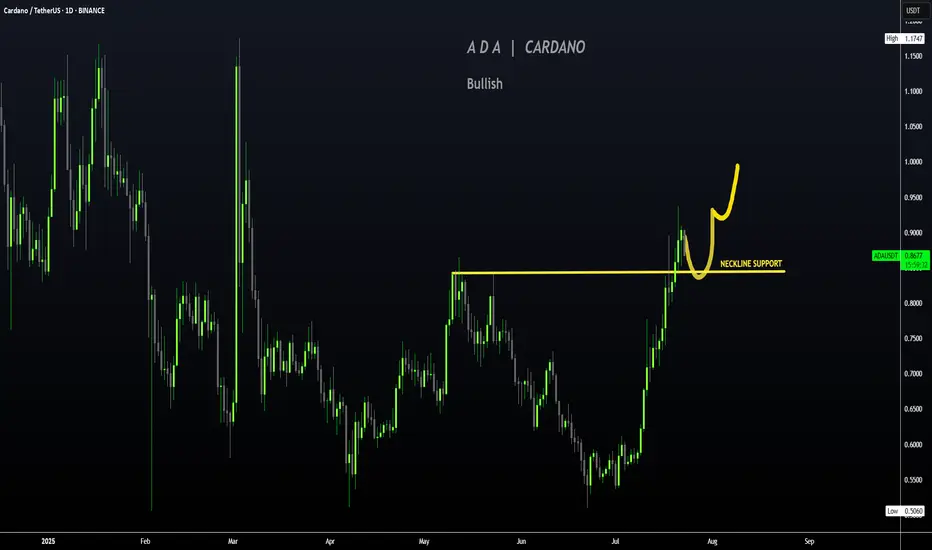
Cardano Update · Wait For New ATH Before Selling · Chart BullishI am using 3D candles. The last session is a Doji on ADAUSDT. There was a red session followed by a continuation with prices moving lower. That's last session, but it—the Doji—ended up closing green.
Sellers started to put pressure on the market and pushed prices lower (red day), by the next session, all selling was bought (Doji) and now ADAUSDT is back above 0.382 Fib. extension (0.8194). This is a bullish setup based on candlestick reading.
From here on ADAUSDT can grow to produce a higher high as long as it trades above this Fib. level, the continuation of the bullish move that started 21-June. So we had a small retrace and the action is recovering, right before bullish momentum grows, which means that this is a good setup to go LONG. It seems some positive event will develop soon and this will create a major wave, a major advance here and Cardano will see the highest prices in more than four years.
It can take a few days, not much longer; everything is pointing higher.
Here it is also wise to avoid selling too early. When we consider Cardano's potential for growth beyond $7, easily, we have to avoid paying attention to the temptation to sell when prices are still too low, the rise is only starting. It is ok to sell at major resistance levels if you have experience because there is always a stop before additional growth. If one is very active, it is easy to sell some at resistance and then buy more at support. But the easiest way is to buy and hold. If the entire bullish wave is set to produce 500%, this is always more than good enough so it is easy to hold thinking of the long-term.
We continue within the accumulation phase. While many pairs are already advanced and while prices are definitely growing, this is not it yet; things are about to go wild and it is better to be fully invested before the event. Everything Crypto. Buy Crypto. Hold Crypto. We are going up.
Namaste.
CARDANO | ADA Creeping UP to $1Cardano has made a big move in recent weeks, boasting a 77% increase.
If you were lucky enough to buy in around 30 or 40c, this may be a great TP zone:
Looking at the Technical Indicator (moving averages), we can see the price makes its parabolic increases ABOVE - which is exactly where we are currently beginning to trade. This could mean more upside is likely, and the 1$ zone is a big psychological resistance zone:
A continuation of the current correction may look something like this for the next few weeks:
_____________________
BINANCE:ADAUSDT
ATH for ADA soonChart says it all, ADA looks prime to run, could reach as high as $6.80
1. Technological Upgrades and Hard ForksThe Plomin Hard Fork in Q1 2025 enhanced governance, while upcoming features like Leios for scalability, BTC DeFi interoperability, L2s, and partnerchains boost efficiency and adoption, positioning Cardano as a leader in secure, sustainable blockchain tech.
2. Spot ETF Speculation and Institutional InterestGrayscale's pending ADA ETF filing with Nasdaq, plus inclusion in their Large Cap ETF, could unlock massive demand. Analysts see this as a game-changer, similar to Bitcoin/ETH ETFs, potentially driving prices to $5+ by year-end.
3. Ecosystem Expansion and IntegrationsNew tools like the EMURGO global Cardano card for ADA payments, Blockchain.com DeFi wallet integration (37M users), and Tokeo Wallet's XRP bridge enhance real-world utility. DeFi TVL and on-chain activity (unique addresses +4.79%, active wallets +12%) are surging.
4. Whale Activity and On-Chain MomentumWhales are accumulating amid spikes in network volume and no downtimes/hacks. Features like privacy via Midnight Network and Charles Hoskinson's White House advisory role add credibility, fueling a "silent surge."
5. Technical Breakouts and Market CorrelationADA has formed bullish patterns like a golden cross, double-bottom, and breakout from descending channels, correlating with Bitcoin's rally. RSI at 76 signals strong momentum, with targets at $0.82–$1.18 short-term and up to $2.80+ long-term.
6. Airdrops and Community HypeUpcoming events like the Glacier airdrop and NIGHT airdrop are creating buzz, alongside Cardano's unmatched decentralization and energy efficiency, potentially sparking a 383% rally as in past cycles.

ADAUSDT Breaks Long-Term Downtrend – Critical Support Retest!The ADAUSDT pair is showing a compelling technical setup. The price has successfully broken out of a long-term descending trendline (yellow line) that had been acting as dynamic resistance since late 2024. This breakout came with strong momentum, signaling a potential shift from a bearish trend to a bullish reversal.
After the breakout, price managed to rally up to minor resistance around $0.90, but is now pulling back and retesting the key support zone (highlighted yellow box) — a previous strong resistance area now potentially flipping into support.
---
🟢 Bullish Scenario:
If the price holds above the $0.80 - $0.83 support zone, the break-and-retest structure will be validated.
A successful bounce from this area could push ADA back toward:
$0.90 (current minor resistance)
$1.13 (psychological and horizontal resistance)
$1.23 (previous supply zone)
$1.32 (recent local high)
A confirmed bullish continuation will be more convincing if the price forms a higher low and breaks above $0.90 with strong volume.
---
🔴 Bearish Scenario:
If ADA fails to hold the $0.8281 support and falls back below the descending trendline, then:
It may re-enter the previous range and test lower support around $0.75 or even $0.65.
This would suggest a potential false breakout and return to bearish territory.
Watch for bearish candlestick confirmations below $0.80 as an early warning.
---
📌 Pattern Insights:
Descending Trendline Breakout: Suggests a possible long-term trend reversal.
Break & Retest Structure: Price is currently testing the previous resistance zone as new support.
Layered Resistance Zones: Several clear resistance levels above provide logical targets for a bullish rally.
---
📊 Conclusion:
ADAUSDT has printed an early signal of a bullish reversal by breaking out of a long-standing downtrend. However, the sustainability of this trend depends heavily on the ability of price to hold the $0.80 - $0.83 support zone. Look for bullish confirmation candles in this area for a safer long entry.
#ADAUSDT #Cardano #CryptoBreakout #TechnicalAnalysis #Altcoins #BreakoutSetup #BullishRetest #CryptoChart #SupportAndResistance #PriceAction #TrendReversal

ADA Cardano Decsending Triangle Use Caution HereCardano had a heck of a move but i think its going to erase most if not all of it before it goes on its next leg up. A break over the overhead resistance line and finding support above would invalidate this. Not financial advice just my opinion. Thank you
Cardano held above $0.76 ┆ HolderStatBINANCE:ADAUSDT is compressing under $0.44 with support from $0.418. Breakout from wedge structure may target $0.462. If $0.418 breaks, downside risk opens to $0.40. Watch for volatility.
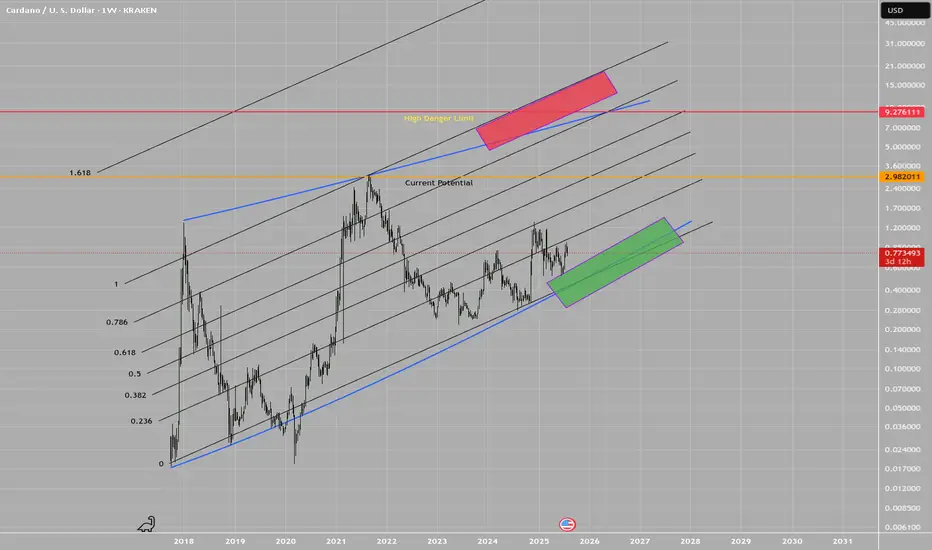
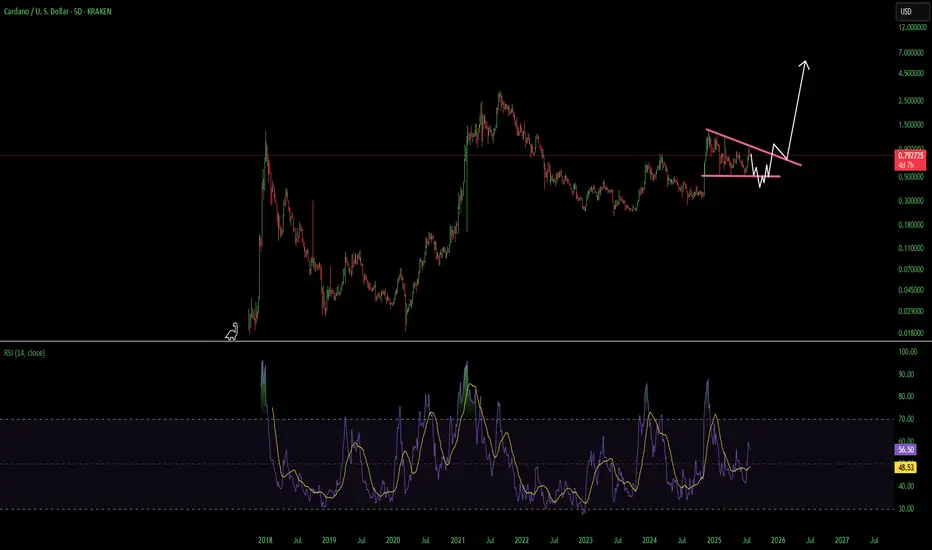
ADA/USDT | Multi-Month Breakout Brewing — a 10x play ?Cardano is quietly mirroring its previous macro cycle — but this time, the structure looks tighter, cleaner, and potentially more explosive.
The multi-month chart reveals a consistent uptrend forming off the 2022 lows, contained within a well-respected ascending channel. The price action shows strong similarities to the 2018–2020 accumulation phase, followed by the breakout that led ADA to its all-time high in 2021.
The current price structure is forming higher highs and higher lows within a channel — a strong bullish continuation pattern.
Volume has been increasing steadily during the up-moves, signaling real demand building underneath.
Fibonacci Extensions from the previous cycle highs and lows show key long-term resistance zones:
1.618 – $4.91
2.618 – $7.79
4.236 – $12.47
These levels could act as major psychological targets if the trend continues to evolve similarly to the last cycle.
⏳ Current Price (~$0.64) is still significantly below previous all-time highs and long-term extension zones — offering a potentially favorable risk/reward setup for patient investors.
⚠️ As always, nothing moves in a straight line — but if you're a macro-mind investor, you’ll start to notice more straight lines than most. Zooming out often reveals the patterns that noise hides.
