Ada has good potential in 2024🔥Hello, dear friends!☺️
🧐Today, I present to You my chart showcasing the promising potential of the ADA coin (from Cardano). As you all know, Cardano has its own cryptocurrency called ADA, which serves as the primary asset of the platform. They utilize the Proof of Stake (PoS) algorithm to ensure network security and support its decentralization.💻
⚡️It's essential to highlight that the Cardano project adheres to scientific methods in the development and implementation of its technologies, contributing to increased security and stability of the network.
Regarding the price movement of the ADA coin, let's take a look at the chart.👀
In December 2023, the price broke through the resistance line of a parallel channel that had been forming for almost a year (marked in red). The formation of this channel began after a prolonged sharp decline in price following the last bull run. I've labeled this parallel channel as the bottom on the chart!👇
💡It's safe to assume that in the coming months (medium-term perspective), we can expect the price of this coin to rise. By placing several buy orders (orange zone) to catch it at the optimal price, setting the marked levels for selling (take profits) at 0.9, 1.0, and 1.2, and keeping in mind the stop-loss level 🛑 - under 0.38, it could be a very profitable deal!🔥
🚀I believe the potential for this coin is quite good, but significant growth will require more time. So, let's add it to our checklist and keep an eye on it 😉
🧐What do You say, folks? How do You feel about ADA and the Cardano project itself? Do You have any experience trading this coin?
Thanks for Your attention, stay tuned! Subscribe not to miss out. 🫶
Always sincerely yours, Kateryna💋
Cardano

ADA BULLISH IN 1H TIMEFRAMEADA has just shown the bullish signal in short term (1h) timeframe.
Targets and SL are given in analyzed chart.

ADA Cardano Double TopIf you haven`t bought ADA before the altcoin season rally:
Now, I believe we are going to see a retracement from this Double Top formation, one of the most bearish chart patterns, to $0.53!

ADA (Y24.P1.Video1).Not looking goodHi Traders,
Here are my thoughts on ADA and why I am looking to take my business elsewhere.
All the best,
S.SAri

💎 GTAI/USDT - First Target hit , What's Next ? (READ CAPTION)By examining the GTAI/USDT chart, we can see that after entering the demand range of $3.35, the price went up with the price and was able to hit the target of $4 and even grew up to $4.3, which means more than 35% price growth in less than a week (Cheers) and I hope you have used this analysis! Based on the main analysis, the next targets will be $4.50, $5 and $5.5 respectively! (This analysis will be updated)
Please support me with your likes and comments to motivate me to share more analysis with you and share your opinion about the possible trend of this chart with me !
Best Regards , Arman Shaban

ADA bullish continuation.Here's another one, so ADA has been in correction as well,
Based on the chart, the correction ended around 0.5800
From the current price, Im expecting for the ADA price to continue with the bullish rally to the new ATHs,
for confirmation, if the next 4 hour candle closes above 0.6400 and the next candle after fails to go below this price, then long it without hesitation and set stoploss around 0.5900 If you enter around .06400 when the candle fails to go below this price.
Otherwise below this price, around 0.5800 and below theres just liquidity for long orders.
In terms on the analysis, count etc, everything has been labelled on the chart.
Remembers always its NFA.

ADA Cardano Potential Retracement SoonIf you haven`t bought ADA just before the rally:
Then using the Fibonacci Retracement tool, I believe there will be a new buy opportunity in the $0.58- $0.62 range!

Cryptolean Cardano ADA UpdateAs expected, ADA dipped to below $0.66 and re-tested the ascending daily trendline.
Above $0.66, bulls will be more active towards $0.76-$0.80.
An inability to return to the bullish territory above $0.66 will result in a bearsih pressure towards $56,97 and a bearsih break-out of the trendline will lead to $0.523.

💎 GTAI/USDT -Ready for another Bullish move? (READ THE CAPTION)By examining the GTAI/USDT chart, we can see that after entering the demand range of $3.35 , the price is associated with the relative demand, and if the price can stabilize above this level, we can expect more growth from this cryptocurrency, and its next targets are will be $4, $4.50, $5 and $5.5!
Please support me with your likes and comments to motivate me to share more analysis with you and share your opinion about the possible trend of this chart with me !
Best Regards , Arman Shaban

ADA - Be Ready for a SUDDEN PUMP📉Hi Traders, Investors and Speculators of Charts📈
Fundamentally - I'm no fan of Cardano. In a certain sense it gives me XRP2.0 vibes, with the cult following community and all. Over-promise and under-deliver with youtube shillers is XRP style and raises red flags. Ultimately, I believe crypto is bigger than one person , and most definitely bigger than than one industry expert / founder. These are a few reasons as to why fundamentally, I'm not an ADA fan.
HOWEVER. As I've said many times before, any coin can and will be traded by whales. Herewith lies opportunity for retail traders, IF you manage to get a good entry. From a chart analysis, Cardano has broken out of accumulation phase by forming a clear bottom. We even start to see glimpses of a new bullish cycle starting as the price makes higher lows.
To the left from a weekly outlook, a wick to the purple 200d moving averages is possible. On the right, from a daily perspective, we'd like to see the turquoise 100d moving averages hold:
I believe it's possible for the price to continue increasing from here and I even believe a hard and sudden, random pump is possible (likely followed by a sudden dump). I'll be looking for increases 30% and 45% from here, as near term targets. Higher is possible, but I'll leave higher targets for a later post once we have actually achieved these price levels. You may need some patience though:
If you found this content helpful, please remember to hit like and subscribe and never miss a moment in the markets.
_______________________
📢Follow us here on TradingView for daily updates📢
👍Hit like & Follow 👍
CryptoCheck
KUCOIN:ADAUSDT COINBASE:ADAUSD

ADA: Pullback in UptrendTrade setup : Price remains in an Uptrend. It reached $0.80 resistance but got rejected 2x (Double Top pattern – bearish) and pulled back, breaking below $0.65-0.68 key level. Now it’s reached $0.57 support and is getting oversold (RSI ~ 30), which could be a swing trade entry opportunity in Uptrend, with +15% upside potential back to $0.65-$0.65 near-term. Stop Loss (SL) level at $0.52.
Trend : Downtrend on Short-Term basis and Uptrend on Medium- and Long-Term basis.
Momentum is Bearish (MACD Line is below MACD Signal Line, and RSI is below 45).
Support and Resistance : Nearest Support Zone is $0.57, then $0.46. The nearest Resistance Zone is $0.65 - $0.68, then $0.80.

Cryptolean Cardano ADA Update Last two weeks, in the daily chart ADA is teasing the key resistance zone of $0.76-$0.80.
Above $0.80, bulls will take control of the ADA price chart towards $1.
A daily candle closure above $0.80 will push ADA price towards $0.90 and higher.
Below $0.66 is the bearish zone and ADA price will decline towards $0.57 for another re-test of the ascending daily trendline.
Intraday Chart
The ADAUSDT 4-Hour chart is in the bullish territory and holding the key intraday support of $0.736.
A reversal from its current price location is likely and a bullish rejection of $0.736 will push Cardano to the key intraday resistance zone of $0.84-$0.88.
A bearish dip to $0.69 or, even better, to $0.65 and a bullish rejection of one of these levels could offer a long trade towards $0.84-$0.88 and higher.
Like once read.
Thank you!

ADA/USDT Primed for a Bullish Swing from Demand Zone? 👀🚀ADA💎 Paradisers, it's time to spotlight #ADAUSDT as it gears up for an intriguing bullish leap from its current demand level.
💎 Reflecting on #Cardano journey, we noticed a pattern where it bounced off the major supply level at $0.6864, forming an equal high before descending. Currently, it's showing signs of a bullish upturn from the demand level of $0.4667. Should the price maintain its momentum here, we could see it ascend to challenge the overhead supply.
💎 As astute traders, we're always on the lookout for alternative outcomes. If the initial plan doesn't pan out, we're eyeing a possible bullish rebound for #ADA from a lower bullish Order Block at $0.4293. A drop below this critical point might signal a further bearish trend.

New ADA Long Opportunity 18-30%+ BreakoutIf CRYPTOCAP:ADA continues on its uptrend over the next few weeks to months, which is more than likely if you look at the total Altcoin Market Cap breaking out, then here are two targets to watch: 0.82 for an 18% gain and 0.9 for a 31% gain.
Watch and wait for confirmed breakouts from the drawn resistance levels, and enter once it surpasses them with some momentum. These resistance levels are based on past price action and can usually be relied on for market price walls.
DYOR AND GET THOSE GAINS!
Like and follow if you're longing for CRYPTOCAP:ADA , and check out my X account, same handle!

Cardano(ADA) is Ready to Fall at least 🚨➖10%🚨🏃♂️ Cardano(ADA) is moving near 🔴 Heavy Resistance zone($1.053-$0.746) 🔴 and Resistance line .
🌊According to Elliott wave theory , Cardano(ADA) seems to have completed Zigzag correction(ABC/5-3-5) .
🔔I expect Cardano(ADA) to start falling again from the 🟡 Potential Reversal Zone(PRZ) 🟡 and at least fall to the 🟢 Support zone($0.661_$0.633) 🟢.
❗️⚠️Note⚠️❗️: An important point you should always remember is capital management and lack of greed.
Cardano Analyze (ADAUSDT), 15-minute time frame ⏰.
Do not forget to put Stop loss for your positions (For every position you want to open).
Please follow your strategy; this is just my Idea, and I will gladly see your ideas in this post.
Please do not forget the ✅' like '✅ button 🙏😊 & Share it with your friends; thanks, and Trade safe.

Cardano(ADA) Bullish continuation to the ATHsCardano, also been one of those tokens that are actually not pumping that hard, also mves like a tortoise, XRP's Brother.
Based on the chart, ADA on the Bull run as well, from around 0.6400 we have been bullish, then we hit correction from 0.7525 which has just completed around 0.6827 then our perfect entry was at 0.7000, from there Im still expecting more moves to the upside till 0.8000, but also note that we might break above this zone till new ATH's, as im expecting ADA to atleast create a new ATH this bull-run.
So you can take positions from the current price if you want to ride the wave as well.
Otherwise its NFA as always. Awesome trading week.

ADA - LONG TERM - Cardano is a blockchain platform that aims to provide a more secure and scalable infrastructure for the development and deployment of decentralized applications (dApps) and smart contracts. Founded by Charles Hoskinson, one of the co-founders of Ethereum, Cardano distinguishes itself through its rigorous scientific philosophy and commitment to peer-reviewed research.
One of the key features of Cardano is its use of a layered architecture, consisting of two main layers: the Cardano Settlement Layer (CSL) and the Cardano Computation Layer (CCL). The CSL is responsible for handling transactions and the transfer of value, similar to Bitcoin's blockchain. On the other hand, the CCL is designed to support smart contracts and dApps, similar to Ethereum's platform.
Cardano's development is guided by a research-driven approach, with a focus on academic rigor and formal methods. The platform utilizes the Haskell programming language, known for its strong emphasis on correctness and safety, to implement its protocols.
The project is governed by three key organizations: the Cardano Foundation, responsible for overseeing the platform's development and adoption; IOHK (Input Output Hong Kong), the engineering and development firm tasked with building Cardano; and Emurgo, which focuses on driving the adoption of Cardano and supporting commercial ventures built on the platform.
Cardano's native cryptocurrency is ADA, which is used to pay for transactions, run smart contracts, and participate in the platform's governance through stake delegation and voting. The platform employs a proof-of-stake (PoS) consensus mechanism called Ouroboros, which aims to achieve scalability, security, and sustainability by allowing ADA holders to participate in the block validation process based on the amount of ADA they hold and are willing to stake.
Overall, Cardano aims to address the shortcomings of existing blockchain platforms by offering a scalable, interoperable, and sustainable ecosystem for decentralized applications and smart contracts, driven by scientific research and community governance.

ADA is poised for an upswingHello traders!
If you "Follow" us, you can always get new information quickly.
Please also click “Boost”.
Have a good day.
-------------------------------------
(ADAUSDT 1M chart)
The upward trend began when the MS-Signal indicator rose above.
Additionally, since the MS-Signal indicator has switched to a bullish sign, it is expected to continue its upward trend if the price holds above 0.236 (0.6024).
(1W chart)
If the upward trend continues,
1st: 0.9250
2nd: 1.3678
3rd: 1.9655
It is expected to rise to around the 1st to 3rd levels above.
We need to check whether the price can be maintained above the top of the box of the HA-High indicator.
(1D chart)
The (1) section is the psychological volume profile section.
Accordingly, the key is whether the (1) section can be broken upward.
To do that, we need to make sure the price stays above 0.6984.
If it falls below 0.6984 and shows resistance, there is a possibility that it will turn into a short-term downtrend.
The important point to continue the upward trend is around 0.236 (0.6024).
Looking at the Renko chart, it shows that an upward trend is about to begin.
Have a good time.
thank you
--------------------------------------------------
- The big picture
The full-fledged upward trend is expected to begin when the price rises above 29K.
This is the section expected to be touched in the next bull market, 81K-95K.
#BTCUSD 12M
1st: 44234.54
2nd: 61383.23
3rd: 89126.41
101875.70-106275.10 (when overshooting)
4th: 13401.28
151166.97-157451.83 (when overshooting)
5th: 178910.15
These are points that are likely to encounter resistance in the future.
We need to see if we can break through these points upward.
Since it is thought that a new trend can be created in the overshooting area, you should check the movement when this area is touched.
If the general upward trend continues until 2025, it is expected to rise to around 57014.33 and then create a pull back pattern.
1st: 43833.05
2nd: 32992.55
-----------------

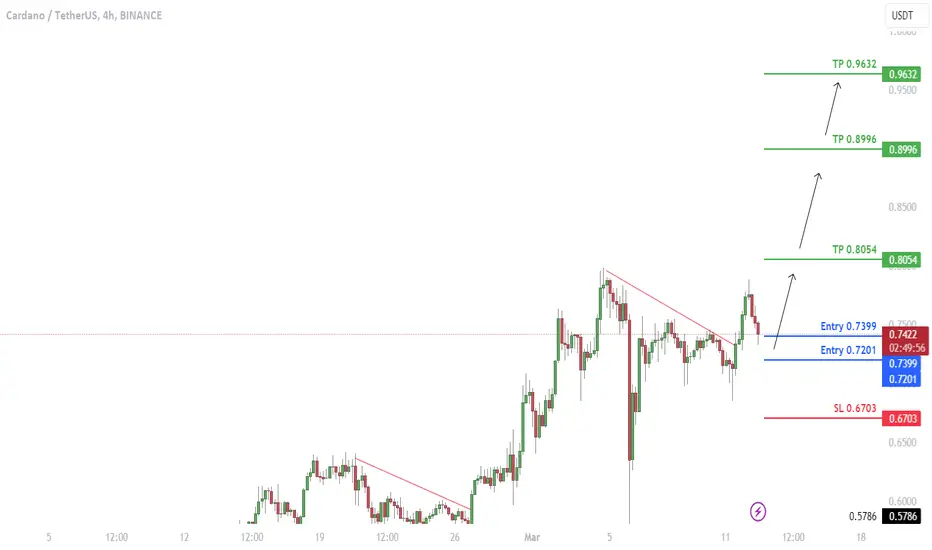
ADA has formed a bullish patternADA has formed a bullish pattern
🔵Entry Zone 0.7201 - 0.7399
🔴SL 0.6703
🟢TP1 0.8054
🟢TP2 0.8996
🟢TP3 0.9632
Risk Warning
Trading Forex, CFDs, Crypto, Futures, and Stocks involve a risk of loss. Please consider carefully if such trading is appropriate for you. Past performance is not indicative of future results.
If you liked our ideas, please support us with your likes 👍 and comments.
ADAUSD LongWe see potential 50% on Cardano H4 chart. consolidation between 0.57 - 0.65 was strong enough to move market higher. Target 0.76

💎 BTC/USDT - New ATH ~ $72K , What's Next ? (READ THE CAPTION)With the new review of the Bitcoin chart in the weekly time frame, we see that in the past moments we saw the price reach a new ATH and Bitcoin managed to grow to $72,000! I congratulate Bitcoin holders on this attractive growth! As you know, when Bitcoin reached the level of $70,000 last week, And it even dropped to $58,000, which quickly filled this liquidity gap and we saw its further growth to higher levels! The next possible targets of Bitcoin will be $77,700, $79,000, $85,000 and $100,000 respectively!
Please support me with your likes and comments to motivate me to share more analysis with you and share your opinion about the possible trend of this chart with me !
Best Regards , Arman Shaban

ADA: sell-high buy-low📊Analysis by AhmadArz:
🔍Entry:
sell:0.758
buy:0.598
🛑Stop Loss:
sell:0.788
buy:0.562
🎯Take Profit:
sell:0.726-0.687-0.654
buy:0.662
🔗"Uncover new opportunities in the world of cryptocurrencies with AhmadArz.
💡Join us on TradingView and expand your investment knowledge with our five years of experience in financial markets."
🚀Please boost and💬 comment to share your thoughts with us!

Channel's FloorThe price trend of Cardano is identified as bullish, and it is positioned within an ascending channel. It is expected that the price will oscillate between the ceiling and the floor of this channel. The price was located at the channel's ceiling and had been predicted to possibly decrease to the channel's floor.
The price is corrected to the floor of the channel, received support again, and grew, reaching the ceiling area once more.
Currently, it is predicted that the price will decrease again and return to the floor area of the channel. However, if the price grows contrary to this prediction and stabilizes above the channel's ceiling, it might experience significant growth.
Enjoyed the analysis? Don’t forget to hit like, drop a comment with your thoughts, and share it with your friends.
